


Pepperstone mobile app
Find your next trade on the go with our native mobile app designed by traders for traders. Stay in control whenever and wherever.
Why choose the Pepperstone mobile app?
Trade the world’s markets on the move in a secure and intuitive trading environment – simplifying market discovery, trade execution and risk management.

Mobile alerts & notifications
Get real‑time price alerts and push notifications with settings that suit your strategy. Stay informed of market moves wherever you are.
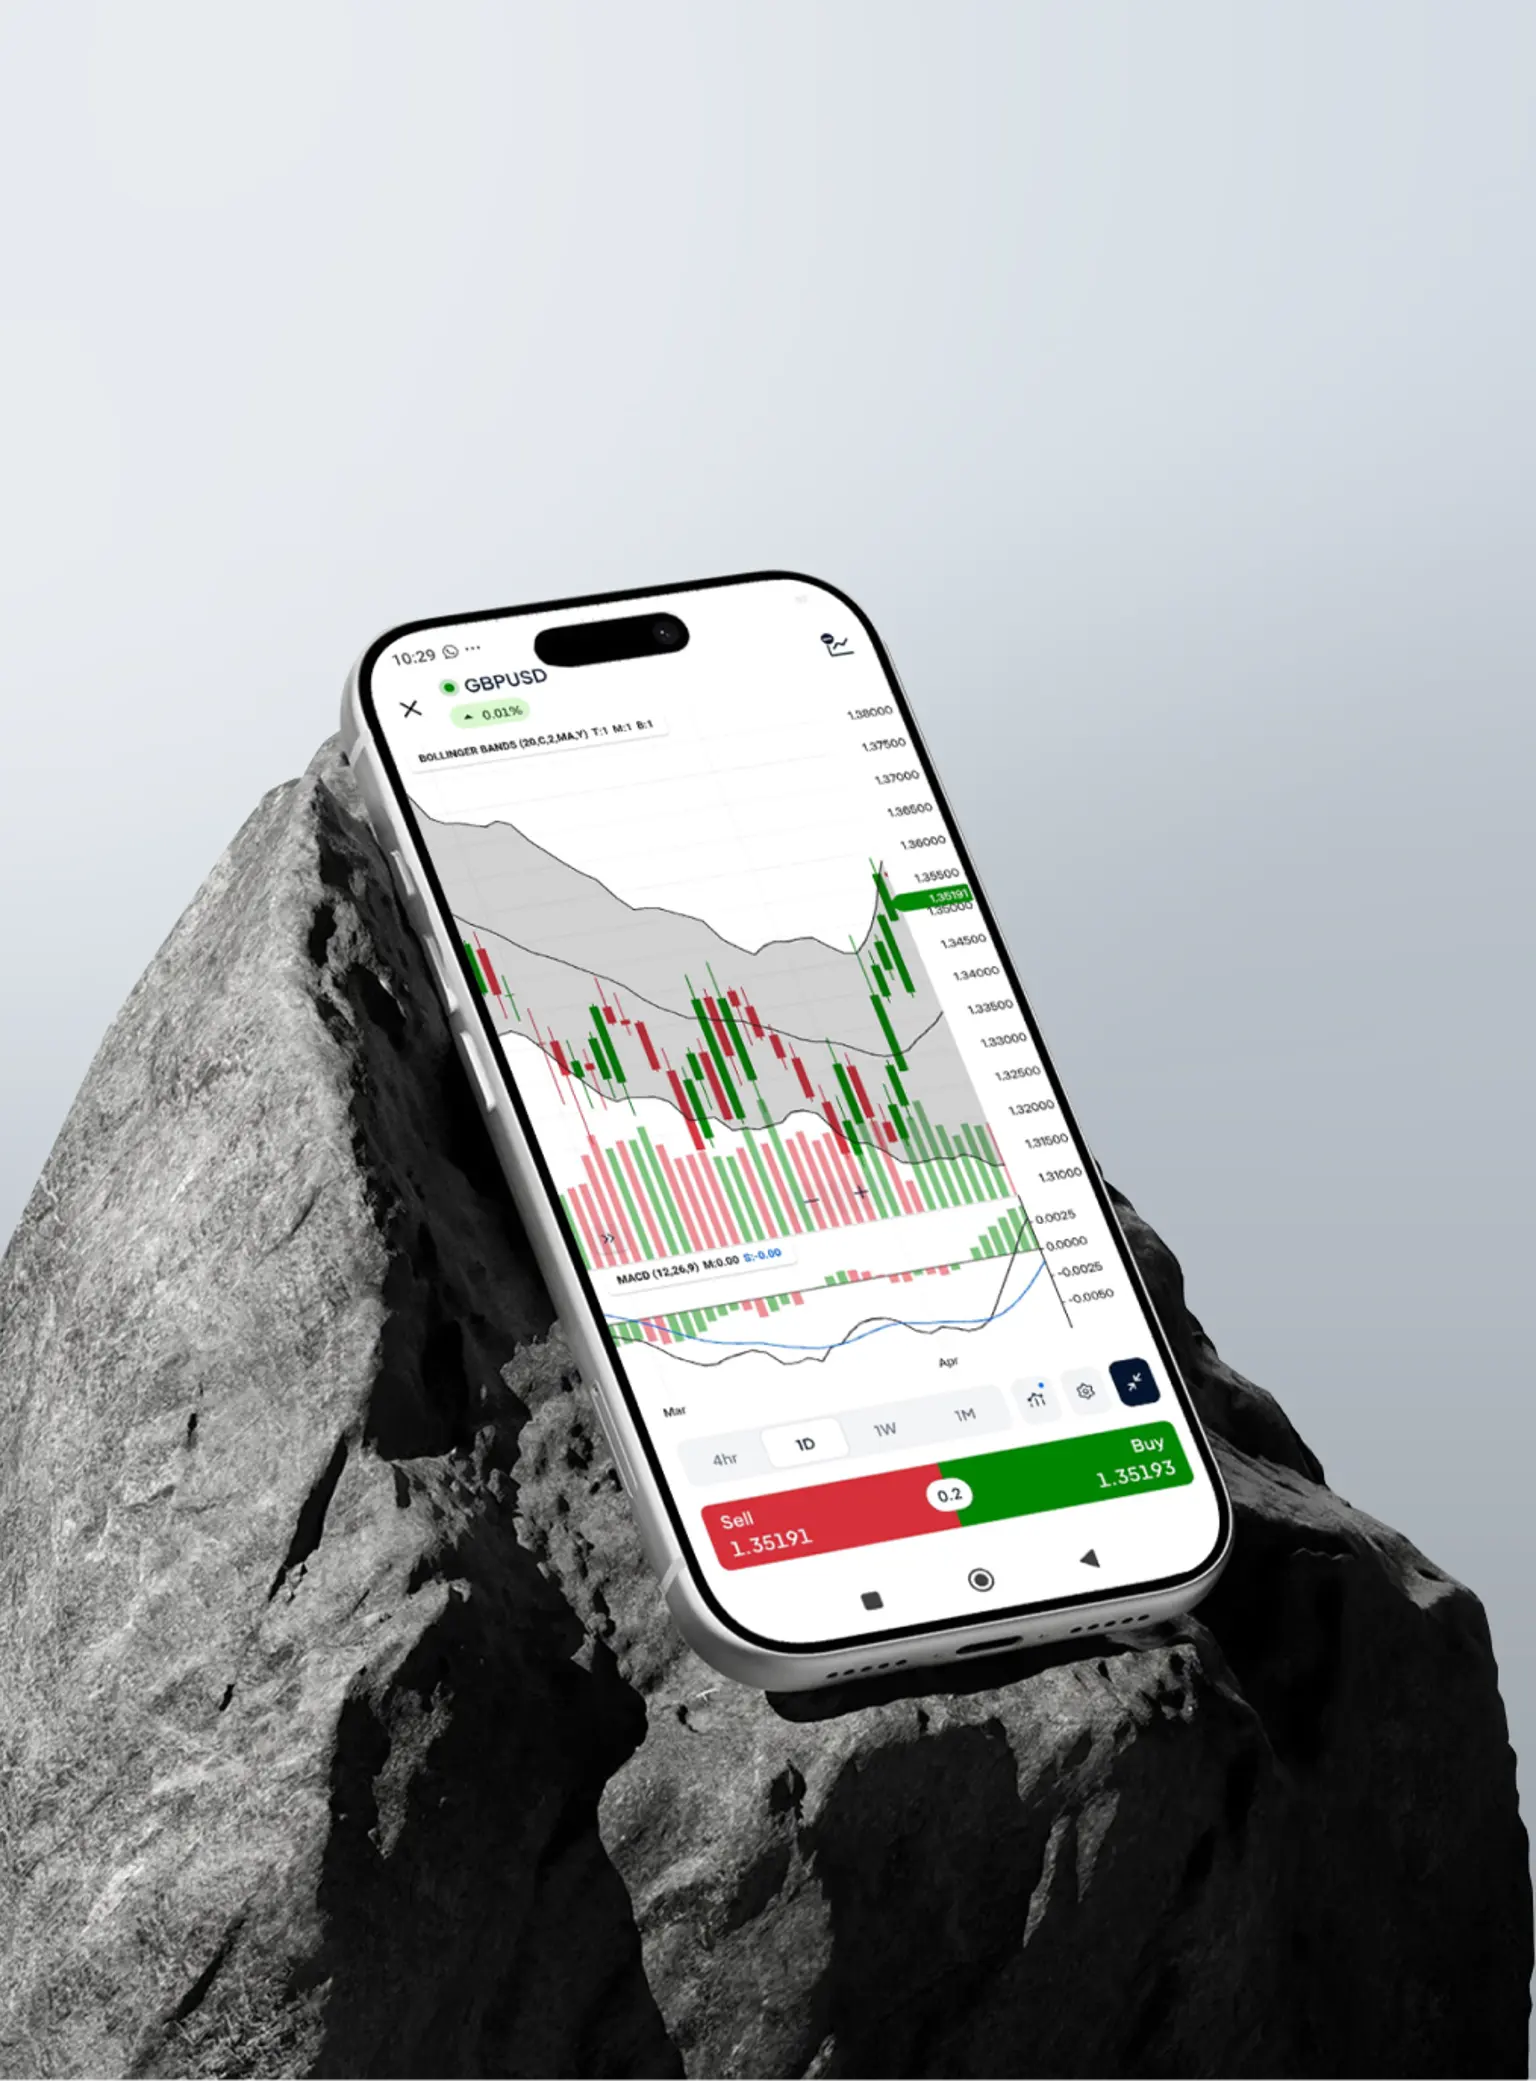
Advanced charting
Analyse markets using flexible charts, multiple timeframes, and technical tools. Trade directly from full-screen charts without interrupting your workflow.
Mobile alerts & notifications
Get real‑time price alerts and push notifications with settings that suit your strategy. Stay informed of market moves wherever you are.
Advanced charting
Analyse markets using flexible charts, multiple timeframes, and technical tools. Trade directly from full-screen charts without interrupting your workflow.
Advanced charting
Analyse markets using flexible charts, multiple timeframes, and technical tools. Trade directly from full-screen charts without interrupting your workflow.
Mobile alerts & notifications
Get real‑time price alerts and push notifications with settings that suit your strategy. Stay informed of market moves wherever you are.
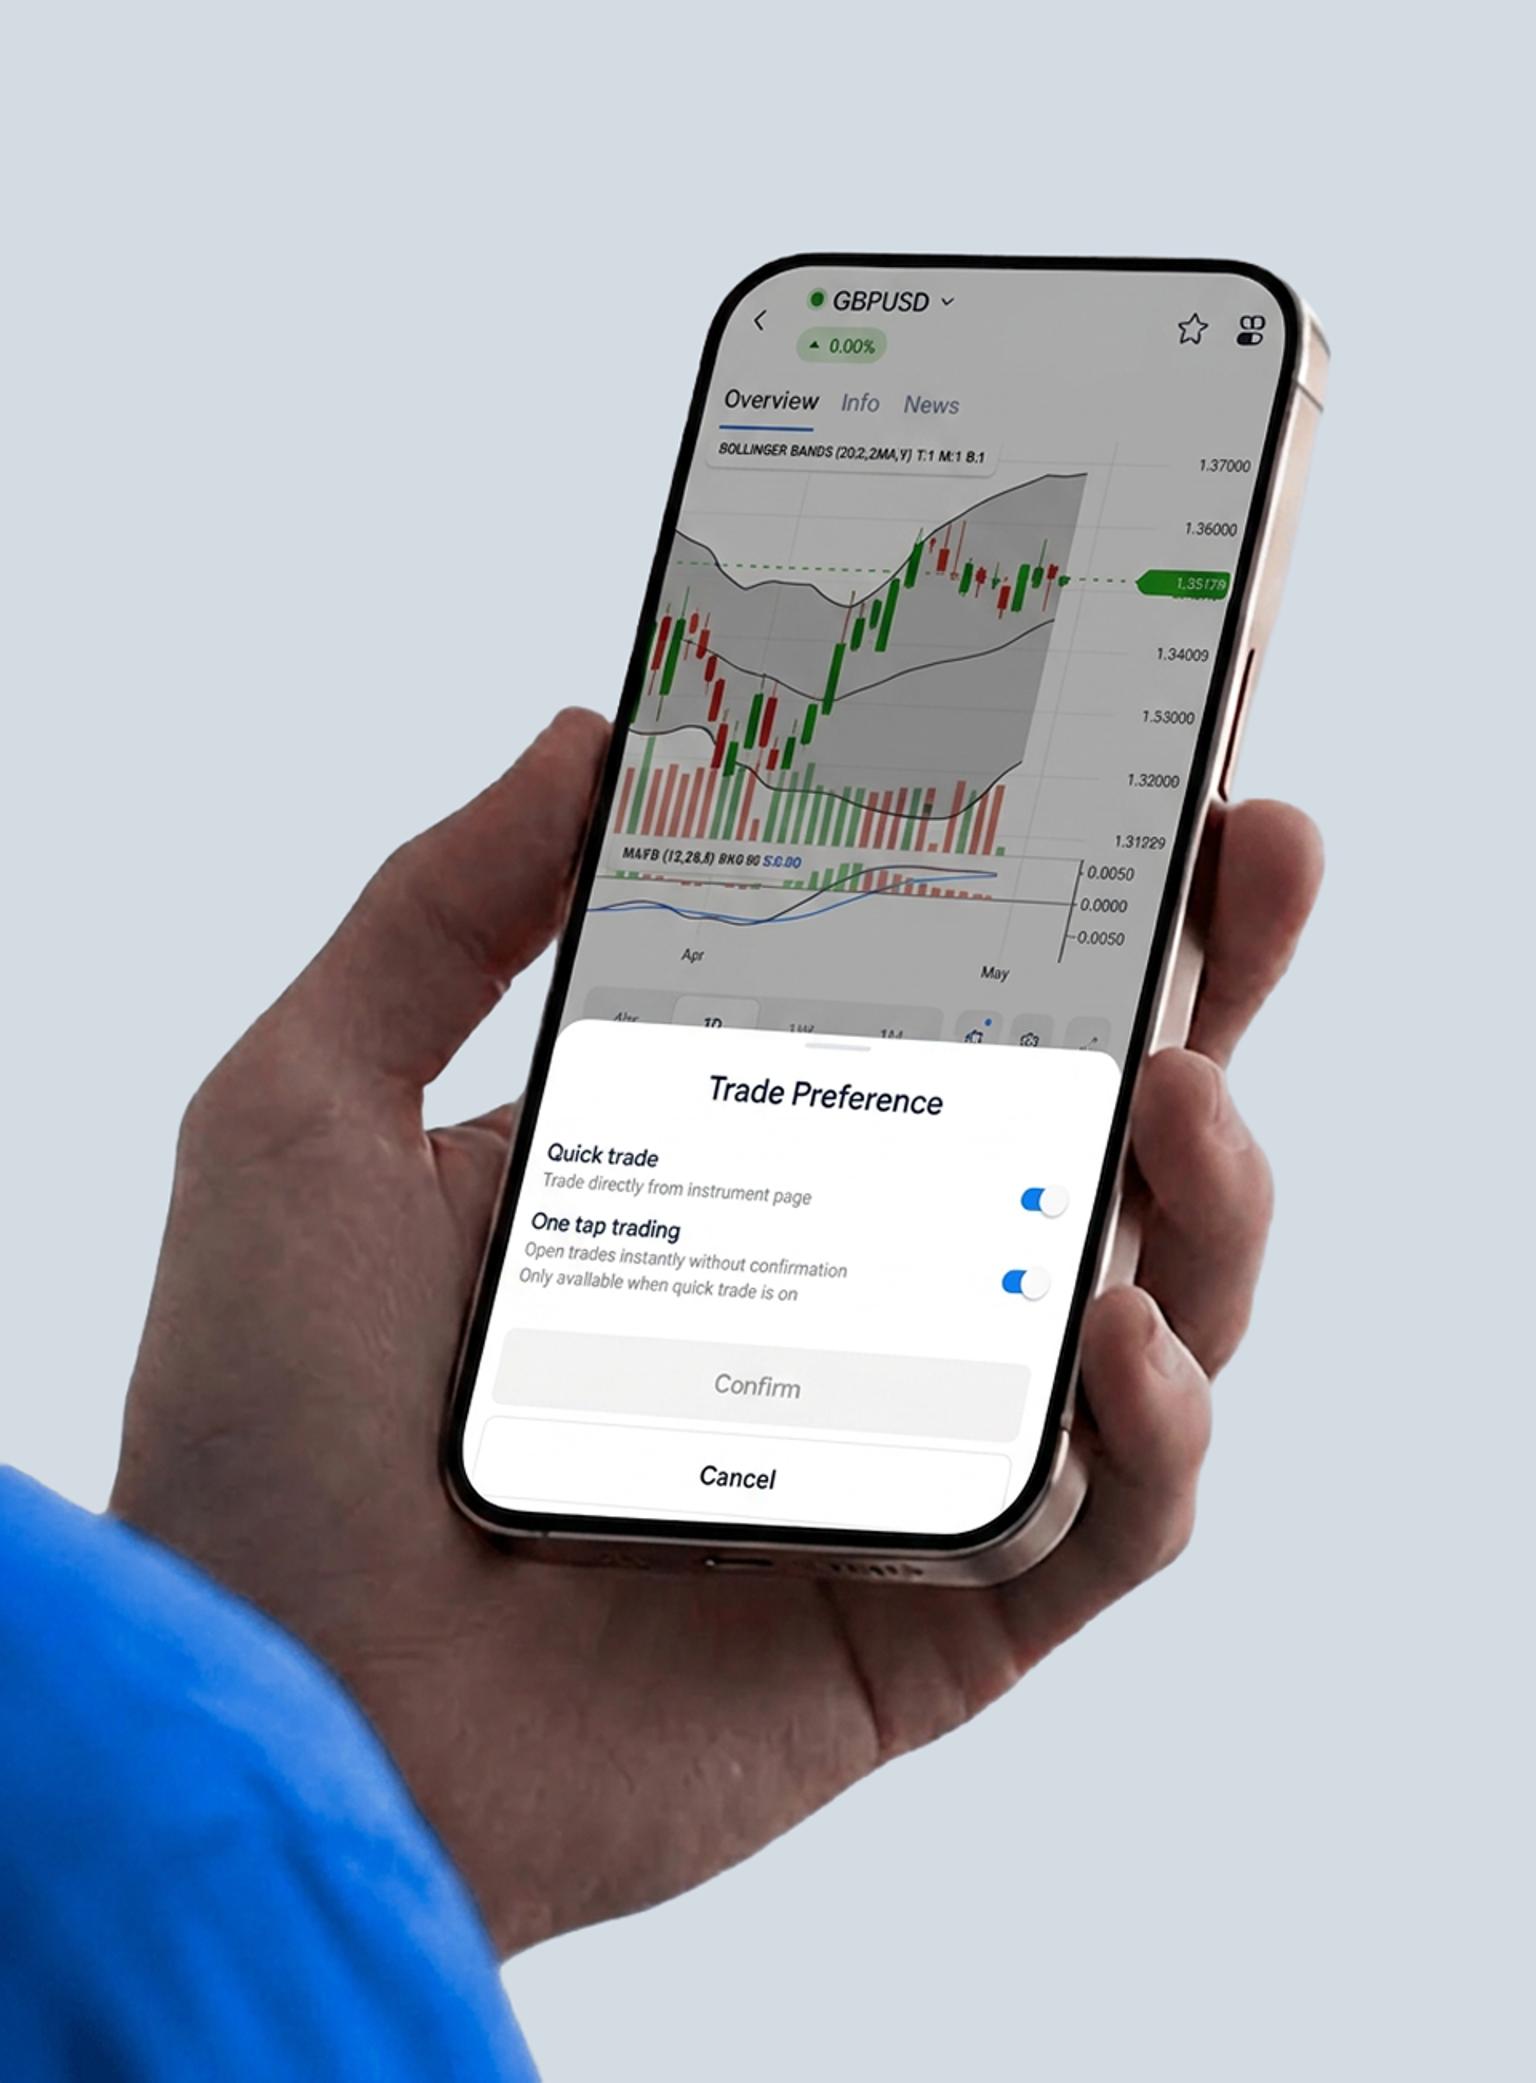
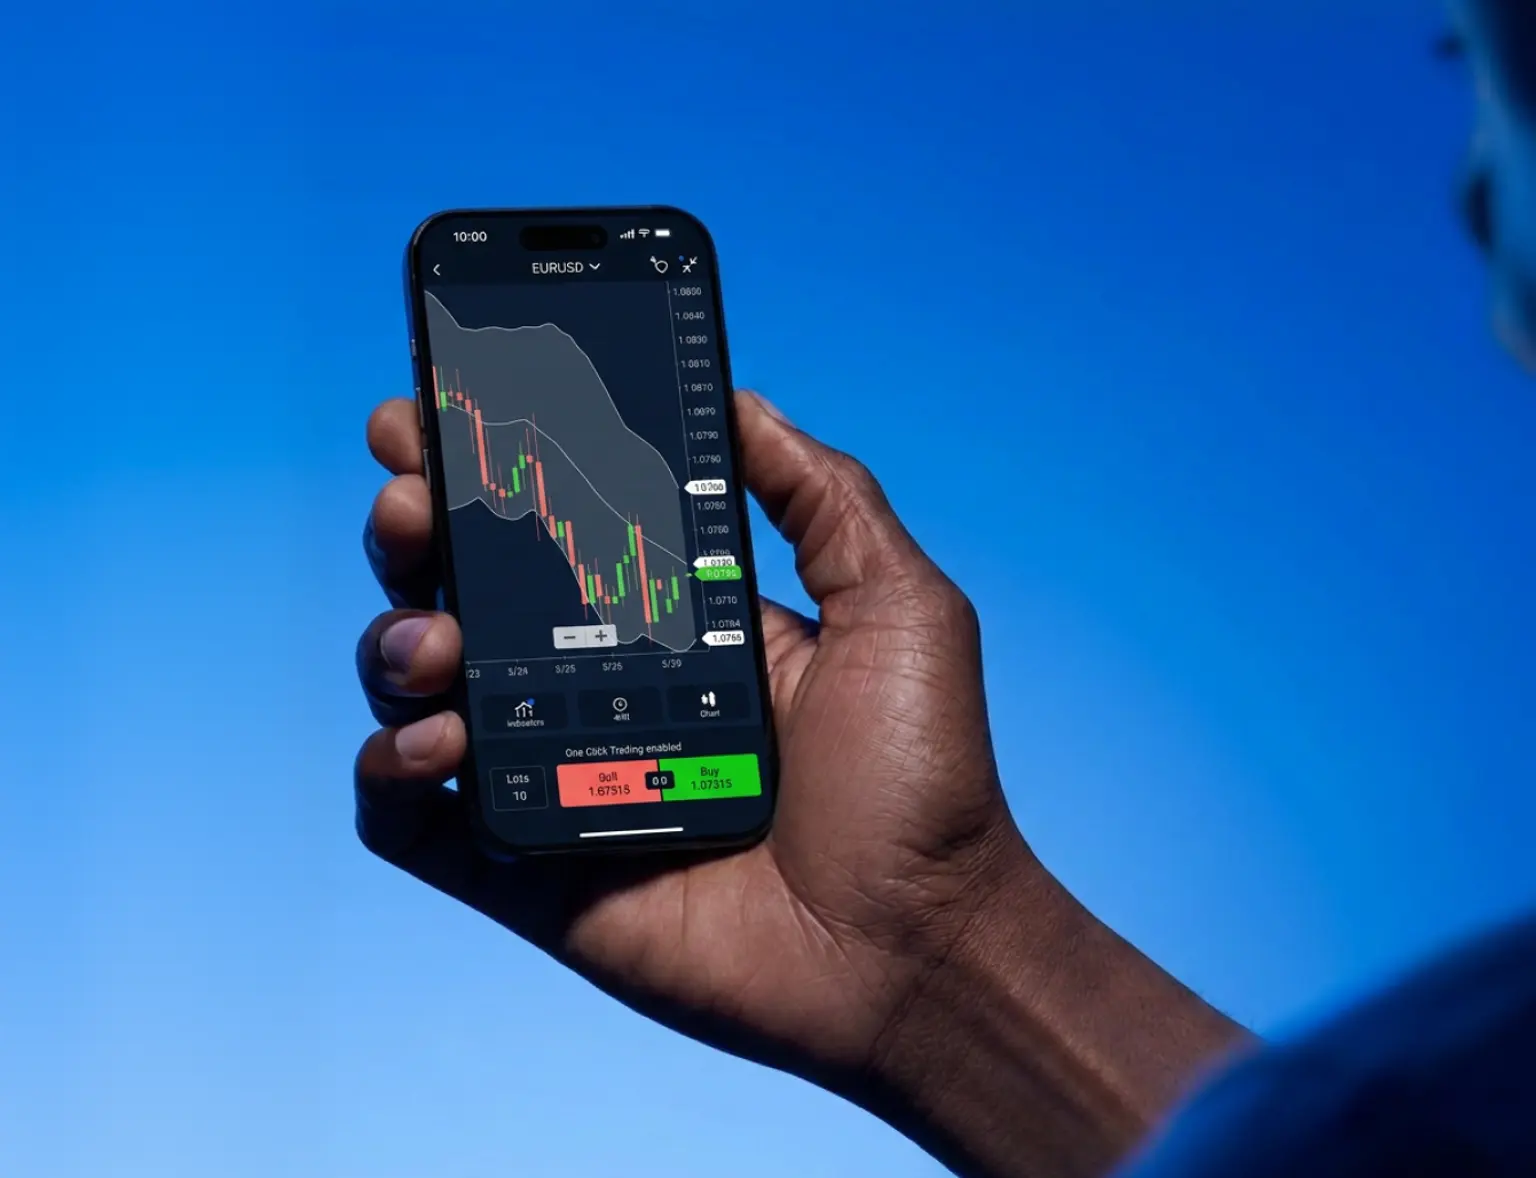
One-tap trading and quick trade
Open positions instantly with a single action, without confirmation. Act promptly on market movements. Set your stop-loss and take-profit levels* in advance.
*These tools do not guarantee the prevention of losses.

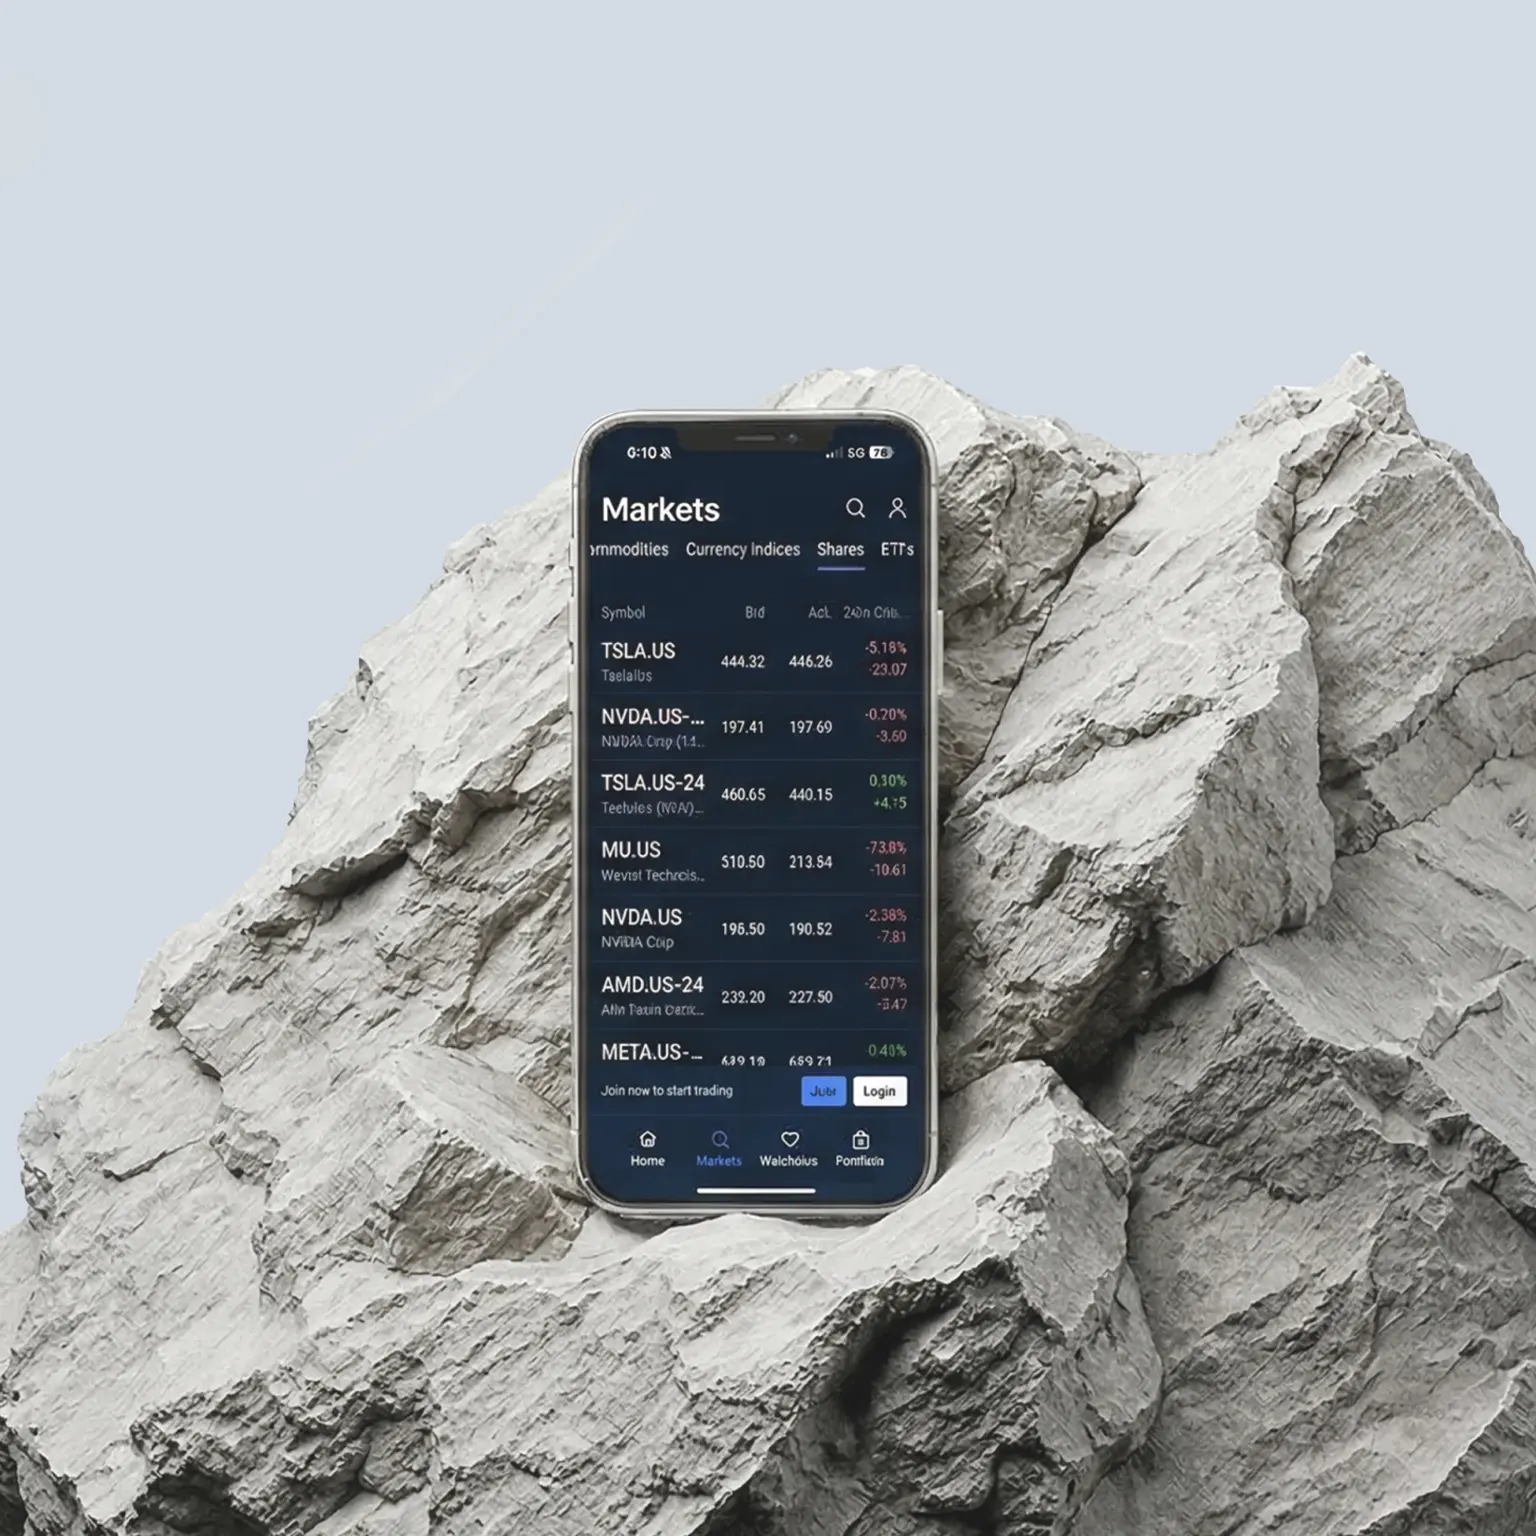
Custom & public watchlists
Stay on top of the markets that matter most to you. Create and manage custom watchlists with ease to match your priorities, and update symbols in seconds. Explore public watchlists for broader market ideas.
One-tap trading and quick trade
Open positions instantly with a single action, without confirmation. Act promptly on market movements. Set your stop-loss and take-profit levels* in advance.
*These tools do not guarantee the prevention of losses.
Custom & public watchlists
Stay on top of the markets that matter most to you. Create and manage custom watchlists with ease to match your priorities, and update symbols in seconds. Explore public watchlists for broader market ideas.
Custom & public watchlists
Stay on top of the markets that matter most to you. Create and manage custom watchlists with ease to match your priorities, and update symbols in seconds. Explore public watchlists for broader market ideas.
One-tap trading and quick trade
Open positions instantly with a single action, without confirmation. Act promptly on market movements. Set your stop-loss and take-profit levels* in advance.
*These tools do not guarantee the prevention of losses.
Even more features to enhance your trading
Smart discovery
Explore markets faster with AI-powered categories to quickly find and access the right markets.
Flexible risk management
Set stop-loss and take-profit by price, lots or order duration for precise risk control.
Transparent order details
See full trade details - margin, balance, price, and conversion rates - before you execute.
1350+ CFD instruments at your fingertips
From margin FX and indices to commodities, shares, ETFs and crypto, we’ve got something for every trader.
Ways to trade on the Pepperstone mobile app
CFD Standard
Gain similar exposure to buying the underlying market outright, while only having to put down a fraction of the full value of your position. All fees – apart from any overnight funding – are included in the spread, and there is no commission to pay.
CFD Razor
Offers identical trading conditions to our Standard account, but with a raw spread + fixed commission pricing model on margin FX and Spot Gold (XAU/USD). Raw spreads from 0.0¹ on margin FX and 0.1 on XAU/USD, alongside fixed, transparent commission from USD$3.50 per lot, per side.
Getting started with the Pepperstone mobile app
Download the app
Search and download the Pepperstone app on your mobile device.
Create account
If you don’t have a Pepperstone trading account, tap ‘Join now’ to sign up.
Log in
Open the app and log in using your Pepperstone credentials.
Ready to trade
You’re all set! Explore the app and start trading.
First time using the Pepperstone mobile app?
Watch the video and take a tour of the app.
Why trade CFDs with Pepperstone?
Elevate your CFD trading with a broker that knows what you need.
Razor-sharp spreads
Starting from 0.0 pts on margin FX on a Razor account, and 0.1 pts on gold CFDs.¹
Fast, reliable execution
From 50 milliseconds, with a 99.32% fill rate and no dealer intervention.²
Dedicated support
We’re here 24hrs a day Mon-Fri, and 18 hrs at the weekend.
Trusted global brand
We have 830,000 clients across 160 countries, and 10 global offices.³
FAQs
To create an account through the mobile app:
- Open the Pepperstone mobile app and tap ‘join now’.
- Select ‘continue with email’.
- Fill in your profile details and choose either a live or a demo account.
- Follow the on-screen prompts to complete the setup.
To log in to your account:
- Open the app and tap ‘login’.
- Enter your Pepperstone email and password.
- Tap ‘login’ to access your account and start trading.
Note that your account is initially temporary, pending verification of your submitted documentation.
To fund your account through the Pepperstone mobile app, follow the steps below.
Method 1:
1. Tap ‘portfolio’ at the bottom right of the screen.
2. Open the ‘overview’ tab. A summary of your current account appears:
3. Tap ‘add funds’ to enter your secure client area.
If requested, enter your email address and password registered with Pepperstone.
4. Click on ‘deposit’ and then choose your preferred funding method.
5. Follow the instructions on the screen. (These vary according to the payment method chosen).
Method 2:
1. Tap the profile icon in the top right corner of the screen.
If profile icon is not visible, either tap < or close any secondary window.
2. Tap ‘deposit’ and you will be redirected to your secure client area.
3. Tap LIVE to select the live account you want to fund
4. Select ‘deposit’, then choose your preferred funding method and follow the instructions on the screen. (These vary according to the payment method chosen).
To withdraw funds from the Pepperstone mobile app, follow the steps below:
1. Tap the profile icon at the top right of the screen.
If profile icon is not visible, either tap < or close any secondary window.
2. Tap ‘withdraw’ and you will be redirected to your secure client area.
3. Tap the menu icon at the top left of the screen and select ‘funds’ and ‘withdraw funds’.
4. Select the method and account you want to withdraw funds from and then follow the on-screen instructions.
Yes, you can use the same Pepperstone account across both the web-based Pepperstone platform and mobile app. They are synchronised, meaning trades initiated on the mobile platform will automatically appear on the web, and vice versa. You can trade on the go with the mobile app and conduct detailed analysis on the desktop web-based platform.
You can place a trade either by using the standard multi-step approach or one-click trading. Note that one-click trading places the trade instantly at the current market price.
Standard multi-step approach:
1. Display the instrument you want to buy or sell.
You can select the instrument from the markets page, the watchlist you have created or a public one.
2. Tap on the sell or buy button at the bottom of the screen, depending on your trading strategy.
3. Specify your trade parameters such as order type, lot size, stop-loss or take-profit levels.
4. Tap the buy button to execute the trade.
You can find out that process in detail in our help and support section.
Yes, the Pepperstone mobile trading app is available on both iOS and Android devices. You can download the Pepperstone mobile app from the Apple App Store for iPhone and iPad, or from the Google Play Store for Android smartphones and tablets. The app allows traders to manage accounts, search and trade instruments, monitor markets, and place orders securely while on the go.
Using the Pepperstone mobile trading app, you can access 1,350+ CFDs across a wide range of global markets, including margin FX, indices, commodities, shares, ETFs, and cryptocurrencies.
You might also be interested in
Ready to trade better?
Switch to Pepperstone now and join our global community of over 900,000 traders.³ Apply in minutes with our online application process.
Register
Sign up with your email address or social account.
Answer
We’ll check your suitability for our products.
Verify
Your safety is our top priority.
Fund
That’s it! You’re ready to trade.
Ready to trade with Pepperstone?
1 Other fees and charges may apply.
2 99.32%. Fill rates are based on all trade data between 01/10/2025 and 31/12/2025.
3 Data correct as of 1 March 2026.