
Market Returns Have 'Fat Tails'
A ‘normal’ distribution is one that most are familiar with, where results cluster tightly around an average value, resulting in a symmetrical ‘bell curve’ around a mean value.
At risk of stating the obvious, returns in financial markets are not ‘normal’. There is seldom symmetry between the number of daily gains, and losses, that an asset will record over a period of time. In fact, returns in financial markets often follow a relatively flat curve, with what we tend to describe as ‘fat tails’ – representing, in this example, periods where outsized losses (left tail), or gains (right tail), have been recorded. Those tails are, typically, where opportunity can lie for market participants.
The below, which shows the distribution of the daily % change in the S&P 500 over the last 5 decades helps to evidence this point. The curve is much flatter, with much wider ‘tails’, than the normal distribution plotted in orange.
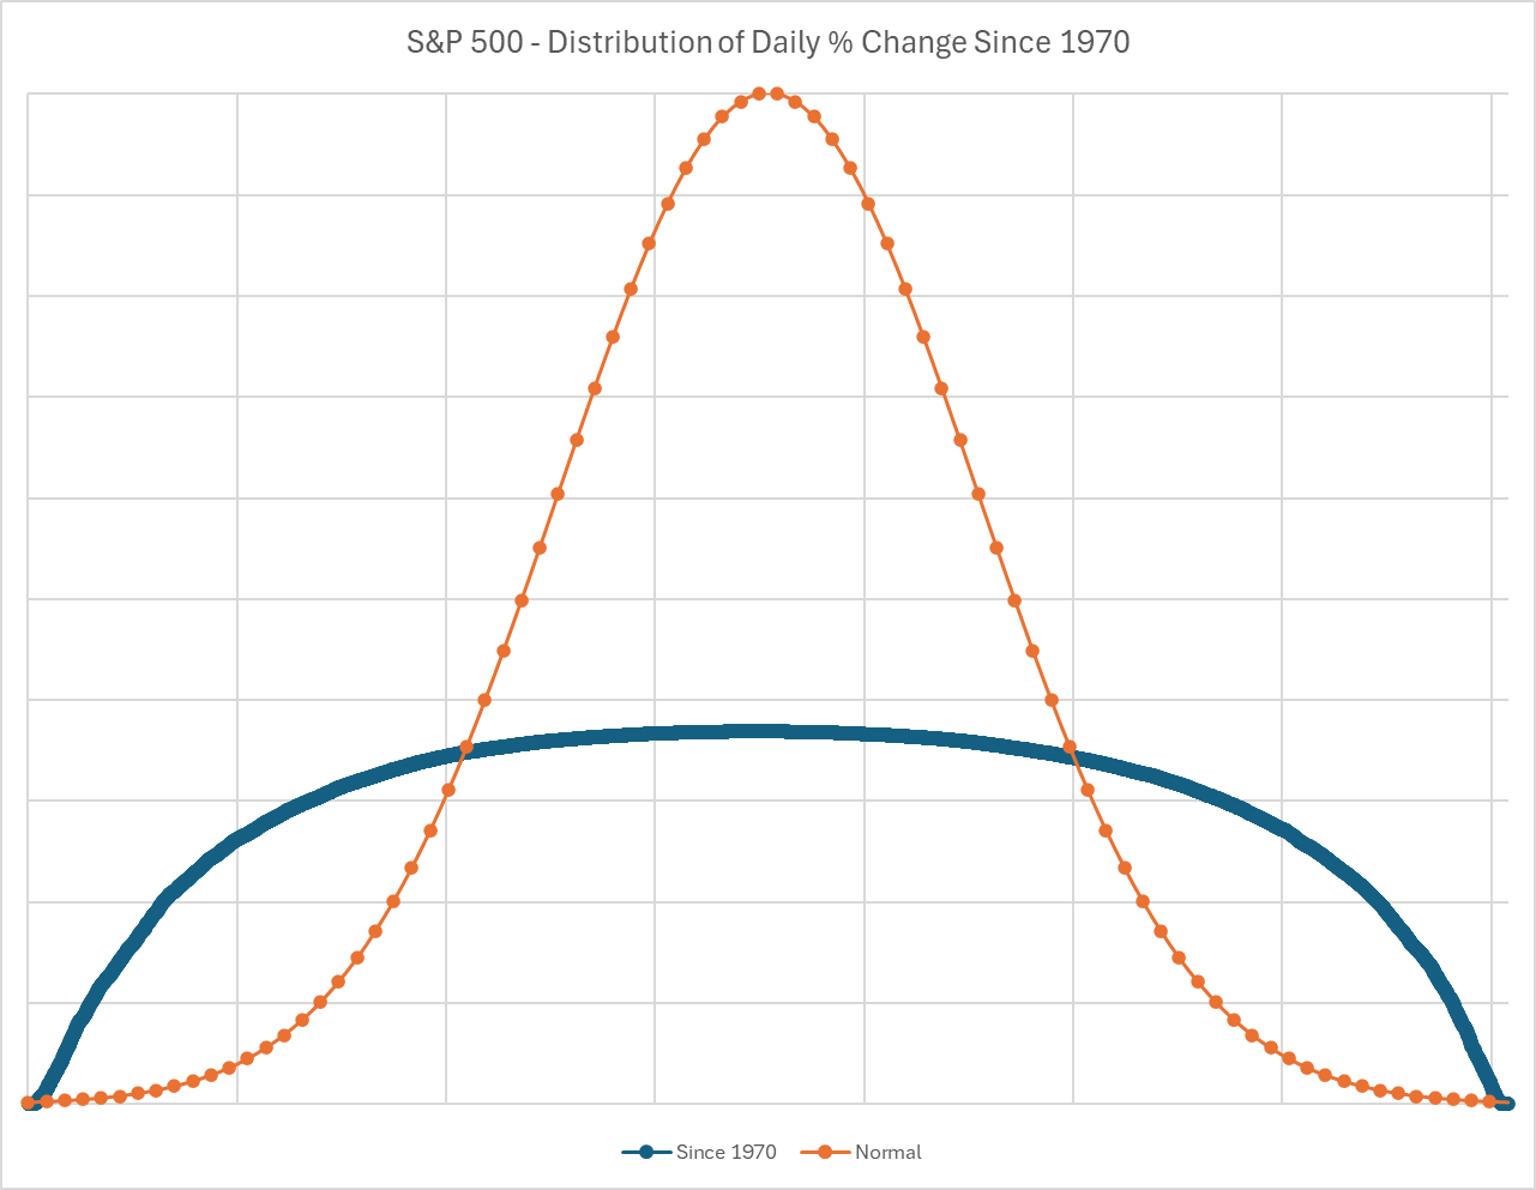
The shape of this curve makes plenty of sense; a modest bias towards positive daily returns, demonstrating the natural upwards drift that equities typically display, combined with a fat ‘left tail’ illustrating those days the market has had to digest an unexpected downside surprise (e.g., last year’s ‘Liberation Day’), as well as a fatter ‘right tail’ pointing to occurrences when positive catalysts have had to be digested (e.g., Trump’s U-turn on those very tariffs).
Market Mentality Differs From The Distribution
This, in fact, brings me on to the broader point that I wish to make. While, in reality, returns are distributed across a curve akin to the one above, in the minds of market participants the curve likely looks very different. On numerous occasions over the last twelve months, we’ve seen instances where real risks have been present (e.g. UK fiscal jitters, the French government on edge, etc.), especially in the political realm, but where – eventually – that risk has ended up being managed effectively.
Not only does that lead to a degree of complacency creeping in among market participants, it also creates a very unusual dynamic where, short of discounting risk as we usually would, markets at large are essentially incentivised to ignore it, on the assumption that, eventually, whatever mess politicians have created will be resolved by the actors in question eventually moving in a more rational manner.
While this doesn’t mean that nobody can, or ever will be, short of risk assets, it does nonetheless further dent the attraction of such positions, with it simply being too expensive, and too risky, for most to be short for any particular length of time, given the rapid and violent nature of market moves in the event of whatever risk folk were fretting about being resolved.
A Higher Volatility Environment Is Likely
Returning to the distribution, above, this likely leads to a considerably more skewed curve than the one that we’ve become familiar with. Expectation of greater upside returns grows, given the presence of a ‘political put’ to backstop sentiment, in turn shifting the mean rightwards. Concurrently, given those expectations, the ‘left tail’ risk grows greater, with participants less likely to engage in hedging activity, in turn amplifying the potential for more significant downside if those rational resolutions to risk do not in fact come to pass.
This is not to say that I’m suddenly turning bearish – far from it! Instead, it seems plausible that vol will likely ratchet higher, slowly but surely, and that the lopsided nature of both sentiment and positioning could lead to downside moves being exacerbated, if and when risk (political, geopolitical, trade, etc.) increases to a point where it is no longer possible to ignore.