
Bitcoin Extends Losing Streak as Momentum Remains Skewed to Lower Levels
Bitcoin has now closed lower for four consecutive weeks, sliding from $96,000 to $68,350 in the process. Should we see a fifth consecutive weekly decline, it would mark the longest run of weekly losses since May 2022.
The key question for traders is whether the bulls can regain control and stabilise price action, or whether BTCUSD remains vulnerable to a deeper pullback toward the $60,000 region.
Weekly Chart Signals: Support Emerging Below $68K
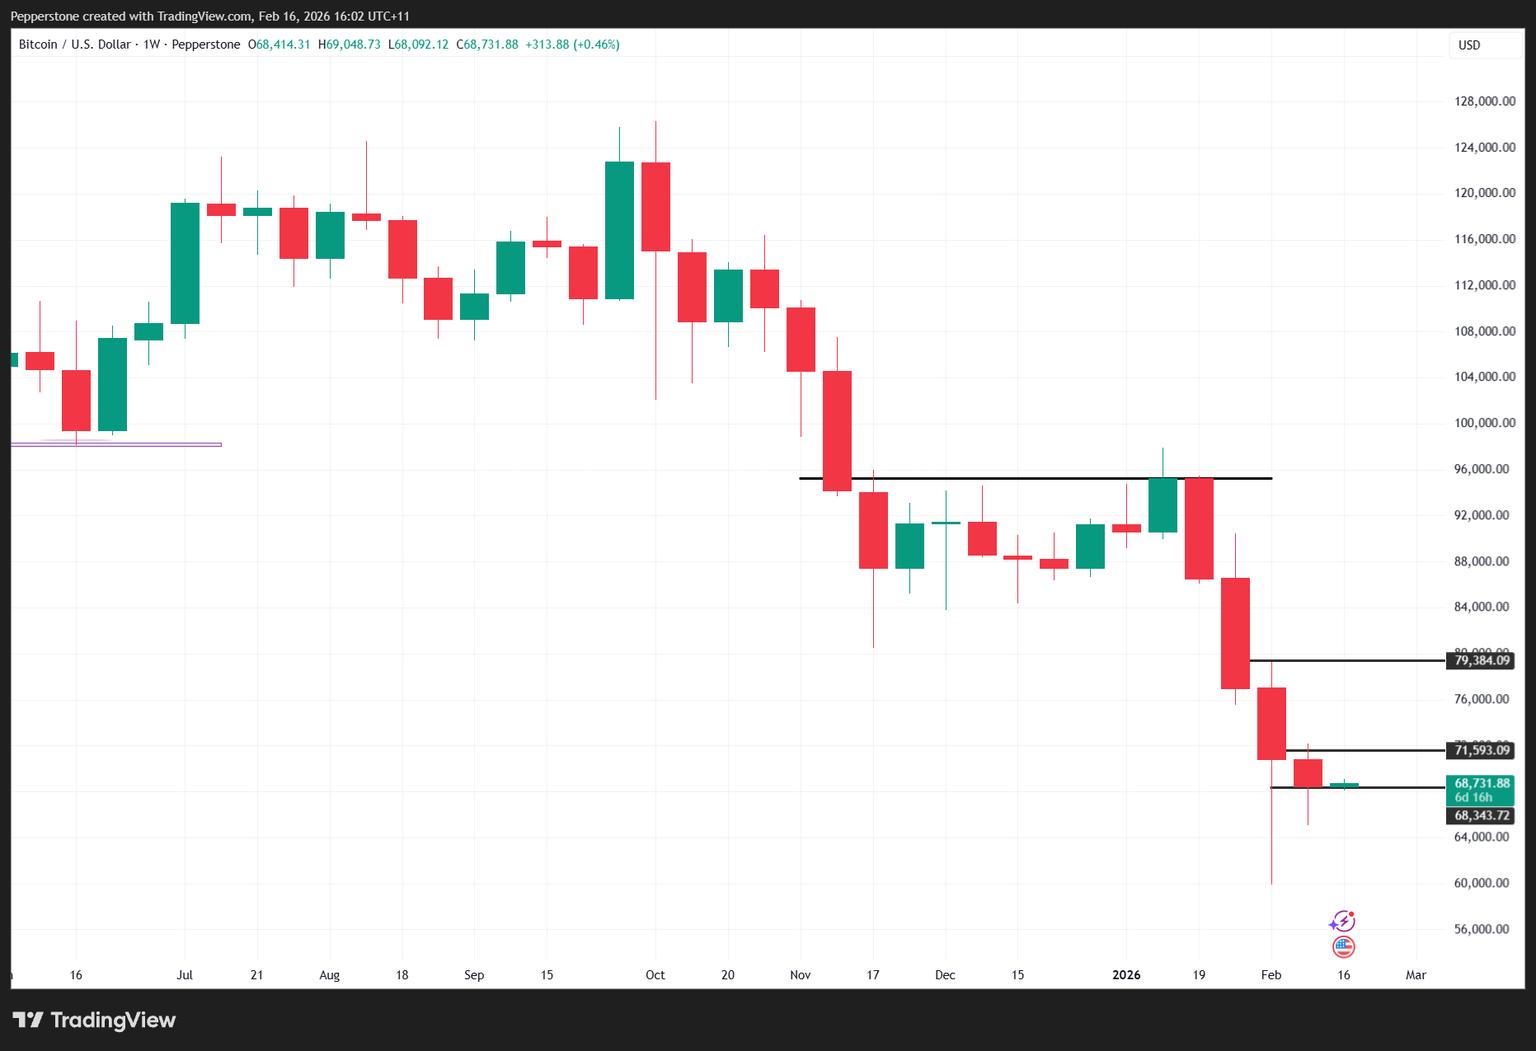
On the weekly timeframe, there are early signs that buyers are attempting to defend key levels. Notable support has emerged on dips below $68,000, suggesting that demand is still present on weakness.
If price moves lower again this week, the recent buyers who entered below $68,000 could find themselves under pressure and potentially in loss. That dynamic may force weaker hands to exit positions, increasing short-term volatility.
Last week’s closing level at $68,418 based on Pepperstone pricing provides a useful reference point. Bulls will likely use that close as a pivot level in assessing whether momentum is stabilising or deteriorating further.
Four-Hour Chart: Breakout Failure and Two-Way Order Flow
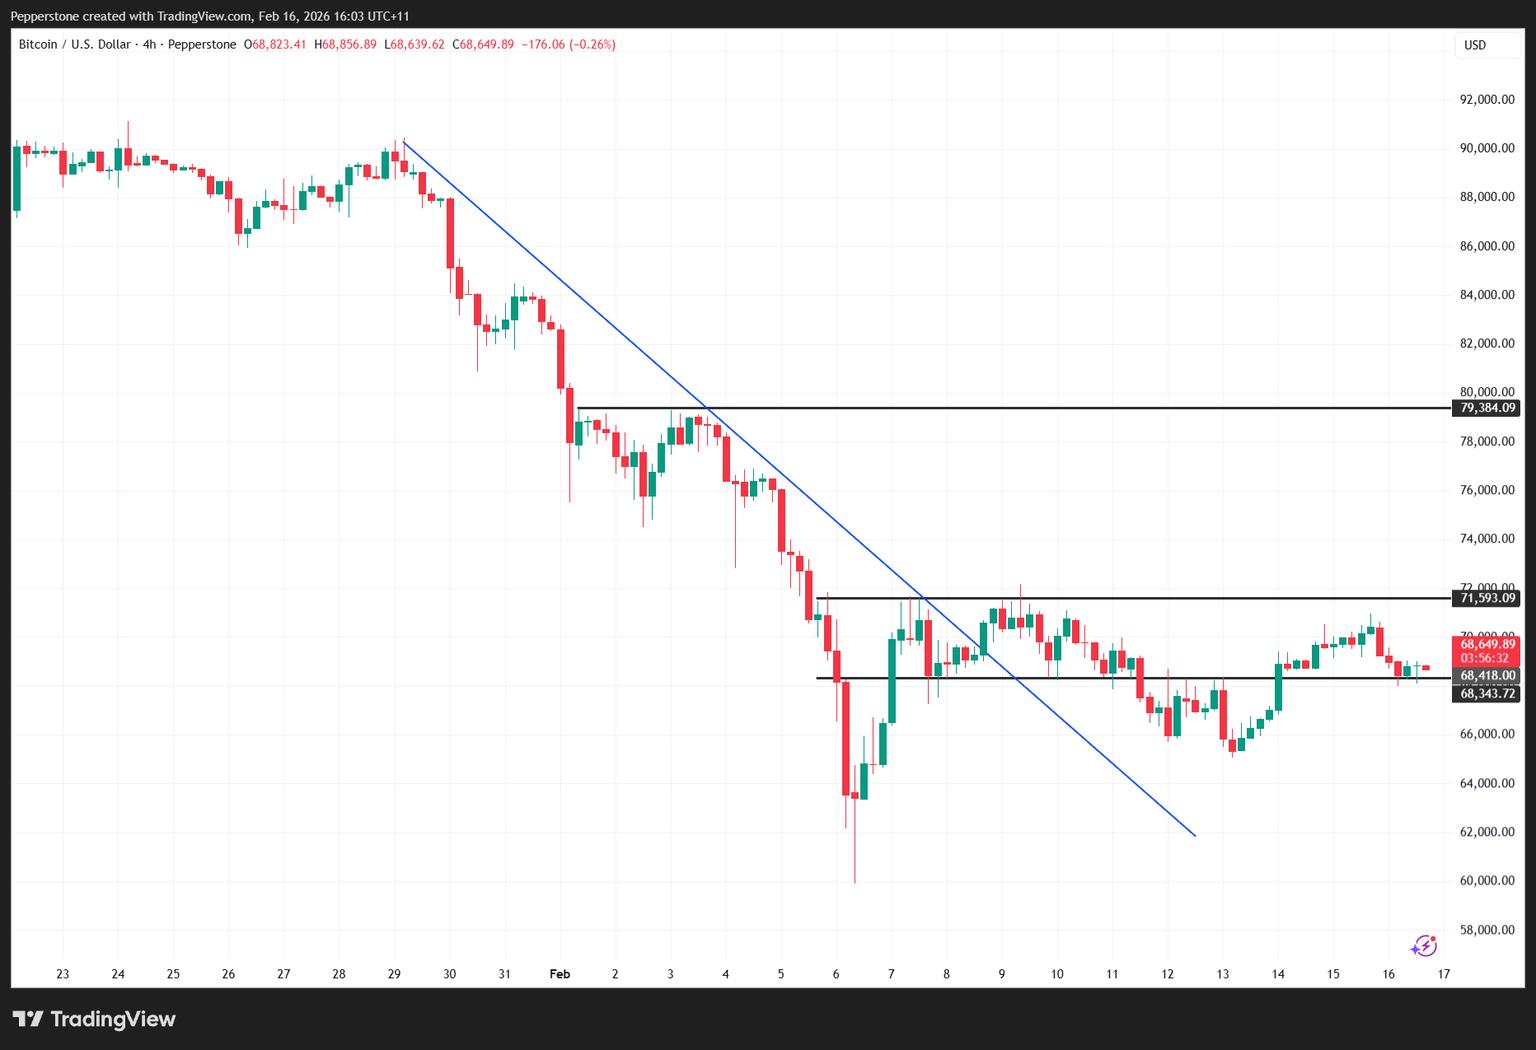
On the four-hour timeframe, BTCUSD broke the downtrend drawn from the 29 January high. Following that break, price action showed improved two-way order flow and a more balanced market structure.
Bitcoin traded within a defined range between $71,500 and $68,300 for six days before breaking lower. However, technical sellers who acted on that downside breakout were frustrated by the lack of follow-through. BTCUSD dropped to $65,059 before sharply reversing back toward the prior trading range.
This failed breakdown highlights the importance of monitoring momentum confirmation rather than reacting solely to initial range breaks.
Key Bitcoin Levels to Watch This Week
Downside Levels to Monitor
• $65,059 – 13 February low
• $59,884 – 6 February low
• $58,354 – 200-week moving average
A break below $65,059 would increase the probability of a retest of the $60,000 region. A sustained move toward the 200-week moving average at $58,354 would likely trigger broader risk reassessment across crypto markets.
Upside Levels to Monitor
• $70,949 – 15 February high
• $72,180 – 9 February range high A sustained move above $70,949 would suggest renewed bullish momentum.
A breakout through $72,180 could shift short-term structure back in favour of buyers and increase upside acceleration.
Liquidation Risk and Leveraged Positioning
Traders should also monitor liquidation heatmaps, such as those provided by Coinglass, to identify clusters of leveraged positioning. Breaks of key technical levels could trigger forced liquidations, amplifying directional moves and increasing short-term volatility.
Bitcoin Outlook: Range Expansion Incoming?
Bitcoin remains at an inflection point. After a four-week decline, price is attempting to stabilise above key structural support. The next decisive move beyond either $65,059 or $72,180 could define the directional tone for the weeks ahead.
With volatility compressed relative to the prior sell-off, traders should prepare for potential range expansion as liquidity builds around these critical levels.
Good luck to all.