- Deutsch
Analysen
Week Ahead Playbook: CPI Looms As Markets Meander The Path Of Least Resistance

The Week That Was
In any case, as a result of the last five trading days being somewhat quieter in terms of the volume of incoming information, markets have done little more than take what is now an all-too-familiar ‘path of least resistance’. US equities, perhaps, epitomise this better than any other instrument, with the S&P 500 future trading north of the 5,000 figure for the first time ever, and being set for a 5th straight weekly advance, having also gained in 13 of the last 14 weeks, the first time such a run has been notched since the ‘80s. Unsurprisingly, both the Dow and the Nasdaq 100 have joined the S&P in notching new record closing highs.
_spx_ro_2024-02-09_10-00-58.jpg)
It is frequently stated in these columns that there are few more bullish signs than a market printing new record highs, taking us back to the old adage that ‘strength breeds strength’. Assuming no nasty hotter-than-expected surprises in the January CPI report (more on which below), the balance of risks for US equities continues to tilt to the upside, until Nvidia – the S&P’s best performer this year – report on 21st February.
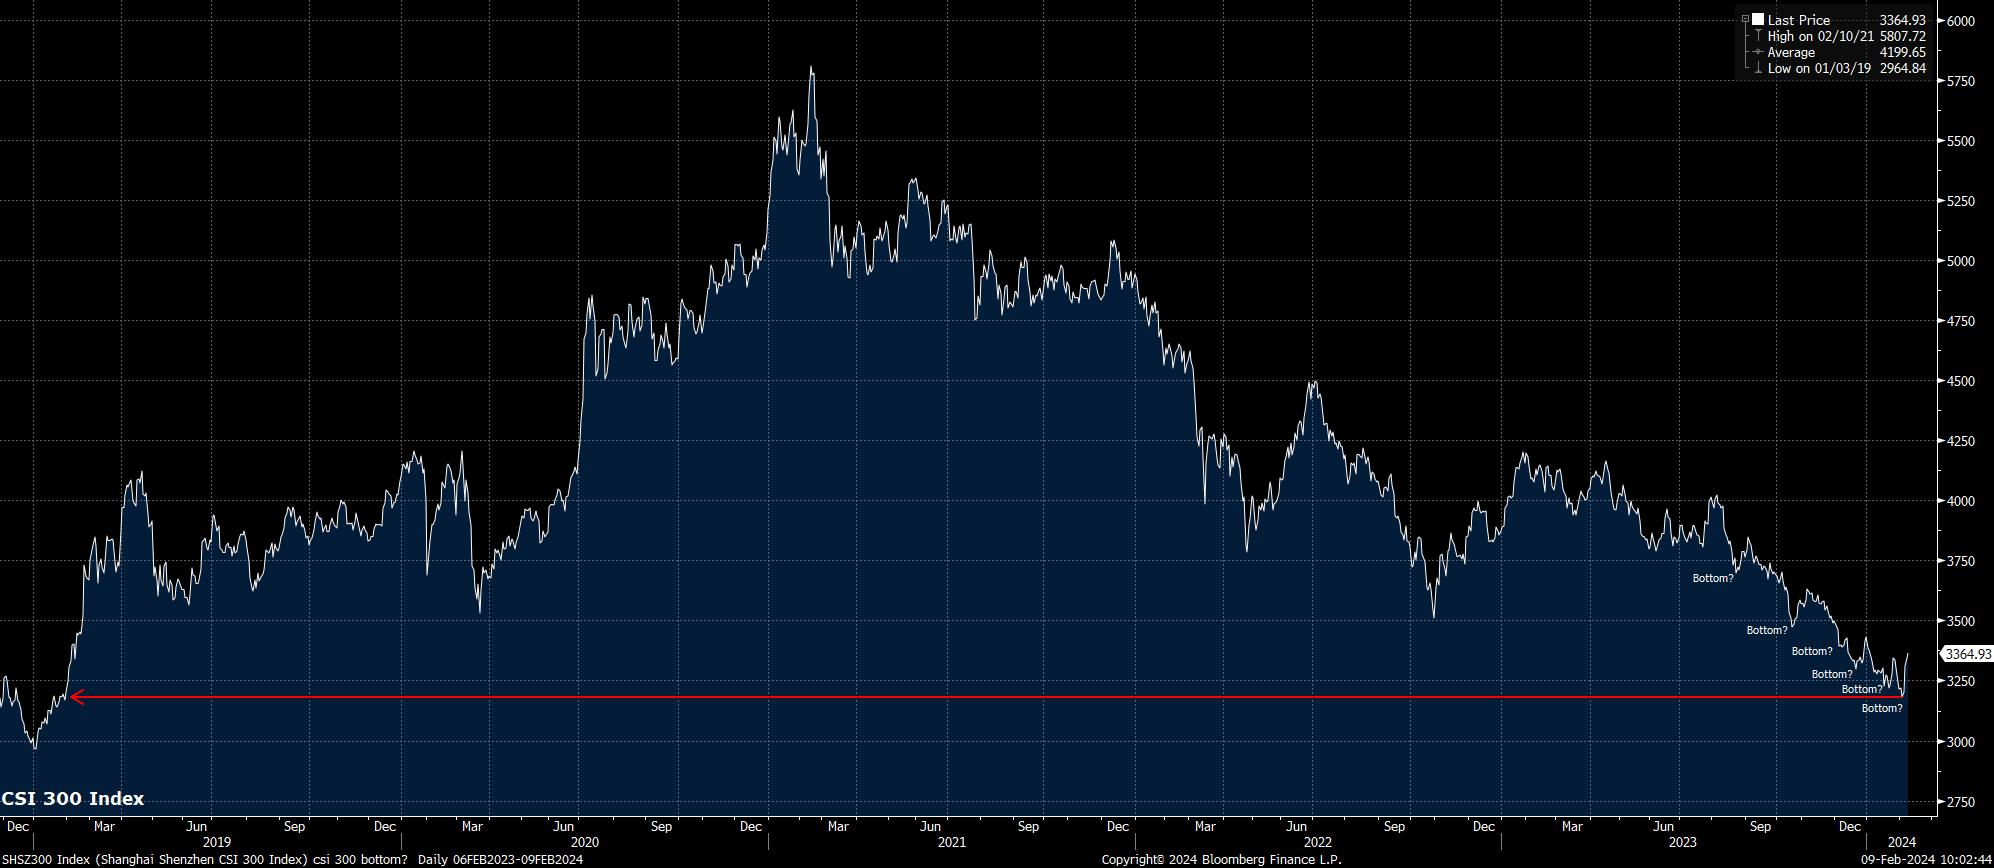
While European equities have also notched solid enough weekly gains – besides, of course, the FTSE 100, which continues to badly lag peers – it is the Chinese market where upside has been most significant. The CSI 300 ends the week almost 6% higher, its best weekly gain since April 2022, with sentiment buoyed into the Lunar New Year holiday week by yet another round of state-initiated market stabilisation measures, including a pledge to increase equity ETF holdings, in addition to President Xi being briefed on said measures, and subsequently replacing the head of the Chinese securities regulator.
Caution is needed, however, with long-running structural issues persisting within the Chinese economy, the property sector remaining deeply indebted, and deflation persisting, with CPI falling 0.8% YoY in January, the biggest drop since 2009, though some of this was caused by base effects. My hunch remains that recent gains will, again, prove to be a ‘dead cat bounce’, and that more pain is likely on the way for China bulls; Japan and India both remain, in my view, better options for Asia equity exposure.
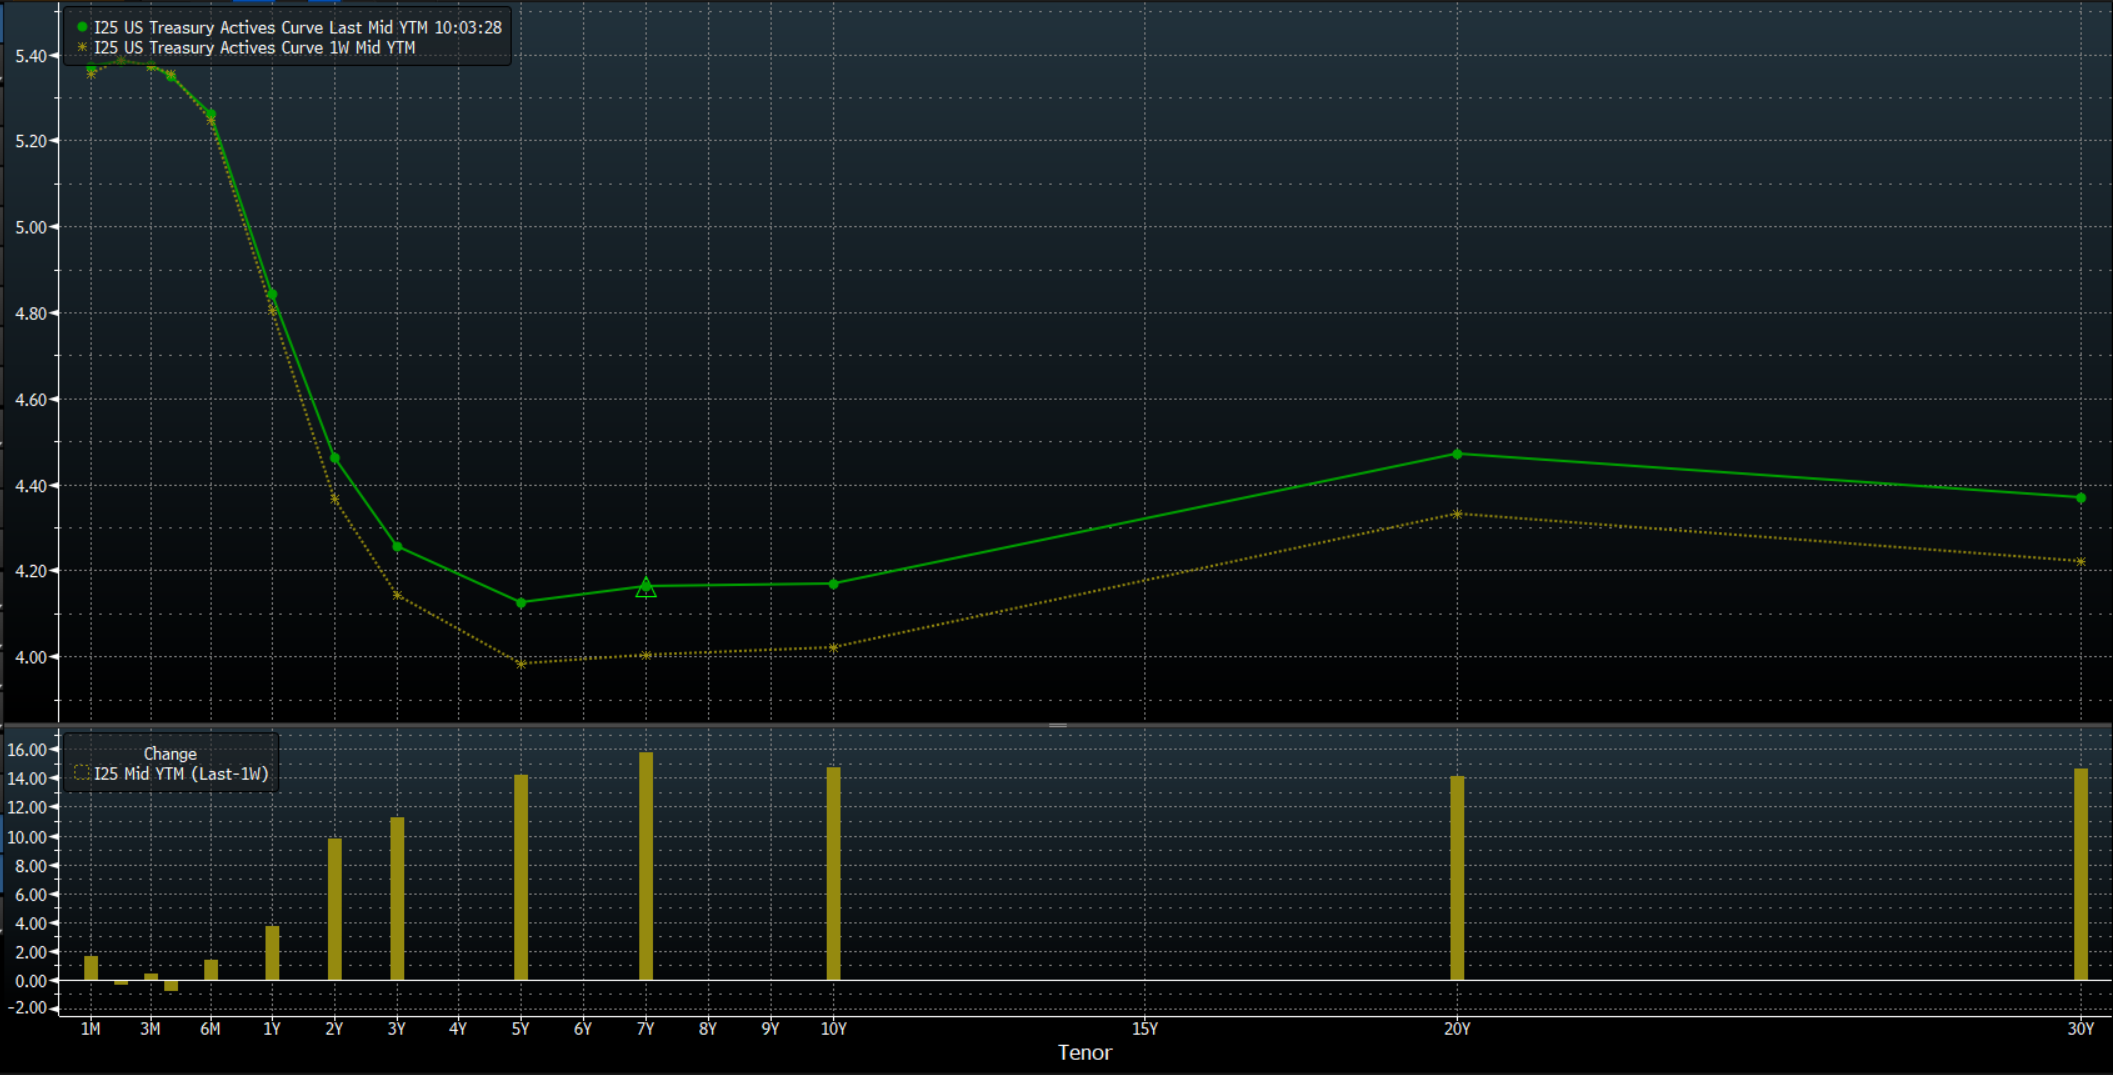
Away from equities, the last week has seen modest selling pressure persist across the Treasury curve, despite all three of this week’s auctions – including a record $42bln 10-year sale – stopping thru the WI yield rather considerably, allaying some concerns that markets may not be able to absorb ever-increasing US government funding requirements.
The modest sell-off, then, and subsequent bear steepening of the curve, seems most likely to be another function of markets plodding along the aforementioned ‘path of least resistance’, as participants continue to hawkishly reprice the Fed outlook, now seeing just a 70% chance of the first cut coming by May, as the ‘goldilocks’ US economic outlook persists, with a ‘soft landing’ now well and truly the consensus expectation.
Rates continuing to ratchet higher remain a healthy tailwind for the greenback, which rallied to a new YTD high against a basket of peers, as the DXY touched, then retreated from, 104.60. Bloomberg’s US dollar index (BBDXY), a broader and more equally weighted measure of the buck’s strength, also touched its best levels of the year, nearing a fresh 3-month high in the process.
Back to the DXY, where the balance of risks continues to point to further upside, though the aforementioned gains did rather stall out around the 100-day moving average. It is perhaps unsurprising that some longs decided to take profit here, given the 3-ish% rally YTD, though a further move higher seems likely in the short-term, particularly with the rally looking far from over-extended when compared to the sell-off in the Treasury complex.
_d_2024-02-09_10-03-55.jpg)
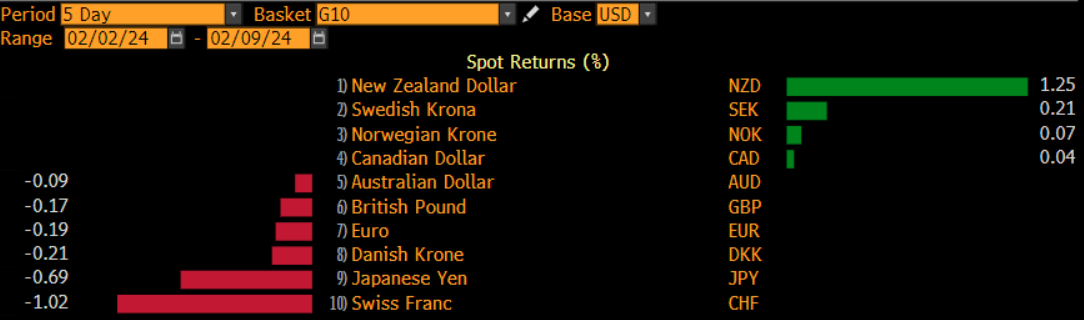
Nevertheless, the strength in the USD seen over the last few days hasn’t been as broad based as in prior weeks, with gains concentrated against lower-yielders such as the JPY and the CHF, with the latter also being pressured by relatively dovish remarks from BoJ Deputy Governor Uchida, who poured some cold water on the idea that the BoJ will embark on a significant tightening cycle upon ending NIRP. Though, in truth, few expected more than one or two hikes in any case.
On the other hand, the NZD stands as the week’s best performer, benefitting from a significantly hotter than expected labour market report, with unemployment rising just 0.1pp to 4.0% in Q4 (exp. 4.3%), and labour costs jumping 1.0% QoQ in the same period (exp. 0.8%). An out-of-consensus RBNZ call from ANZ, forecasting a further 50bp of tightening being delivered by April also helped to give the Kiwi back its wings though, to quote their own research note on this, it seems that they’ve “lost the plot” with this forecast.
The commodities space has also seen some decent vol, though most certainly not in gold, with the yellow metal stuck a handful of dollars either side of its 50-day moving average for much of the week. Other precious metals have been of more interest, with spot palladium falling below spot platinum for the first time since 2018 amid increasing concerns over auto industry demand.
_2024-02-09_10-05-21.jpg)
Meanwhile, front WTI managed to recover most of last week’s decline, gaining around 5% on the week, and rising back above $75bbl, as geopolitical tensions in the Middle East continue to be closely monitored, despite thus far having no impact whatsoever on crude production.
The Week Ahead
Looking ahead, the week to come brings a significantly busier data docket, and with it likely higher levels of cross-asset volatility.
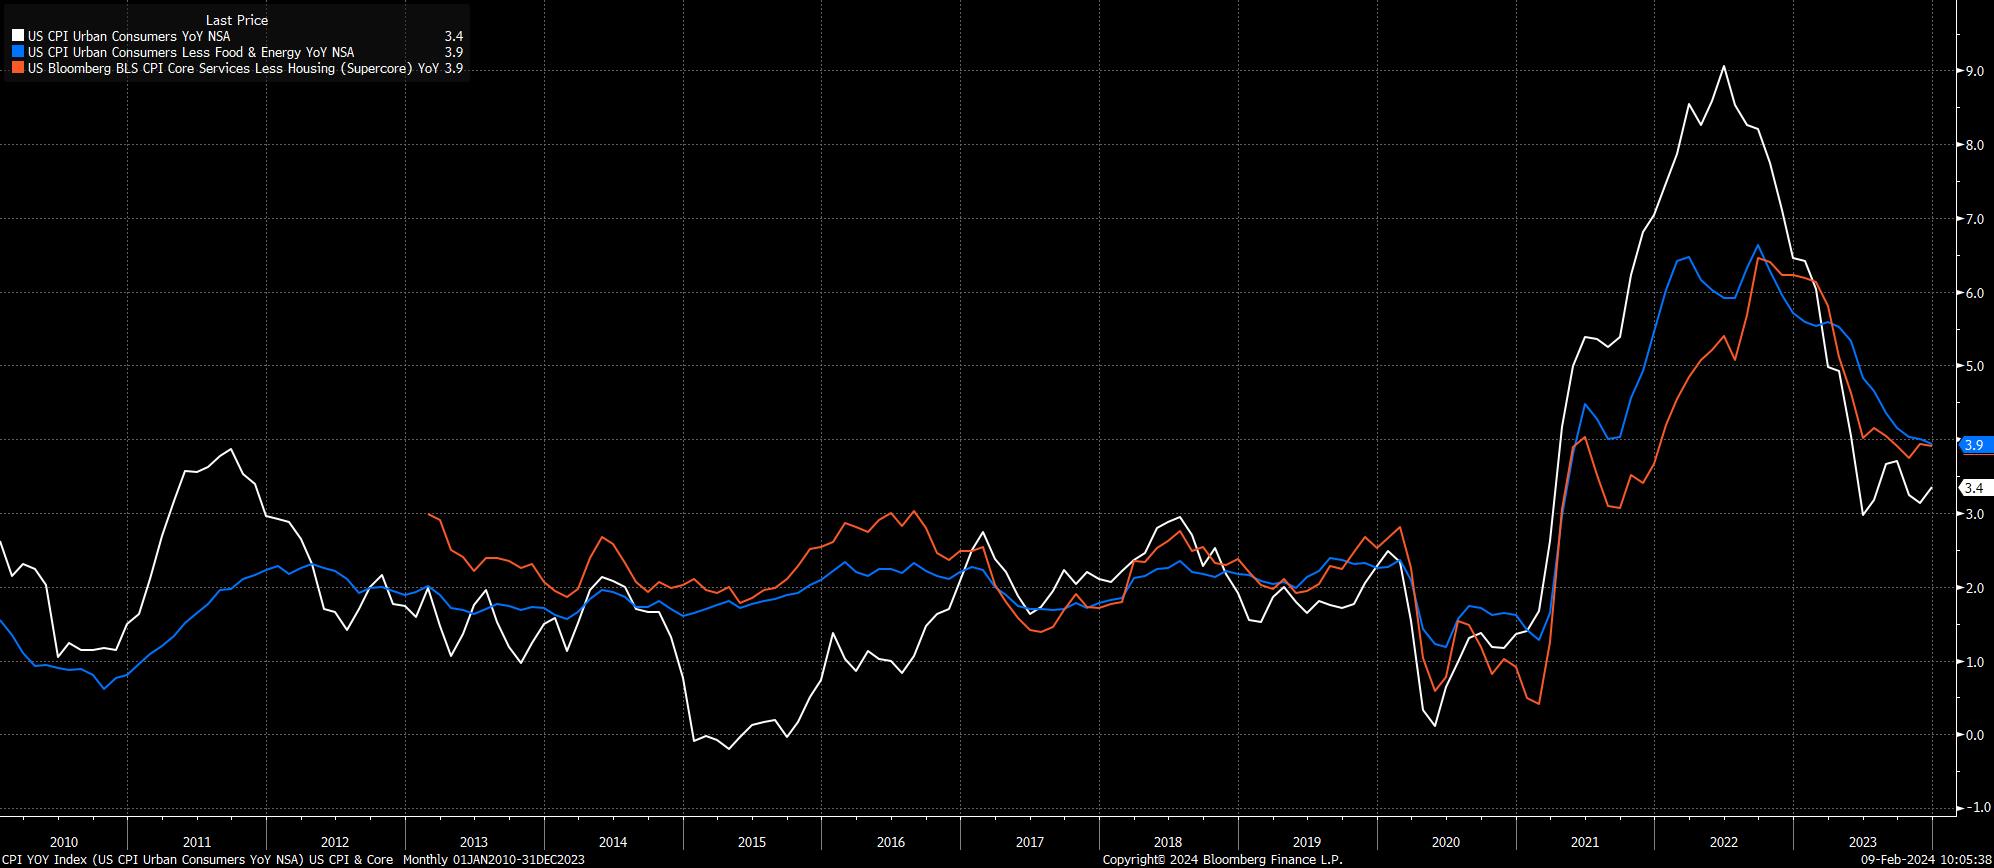
As already flagged, the January US CPI report is the standout event, with headline inflation seen rising 2.9% YoY, a chunky drop from the 3.4% prior, while core CPI is also set to fall, seen printing 3.7% vs. 3.9% prior. Of course, significant attention will also be paid to the ‘supercore’ metric, seen by FOMC policymakers as an important gauge of underlying price pressures, while the 3- and 6-month annualised MoM prints - both of which are now below the Fed’s 2% price target – will also be examined for further progress towards the aforementioned aim.
Nevertheless, given recent pushback from FOMC members, including Chair Powell himself, on the idea of a March cut, with further data needed to provide “confidence” that the disinflationary process will indeed take headline prices back to 2%, it seems highly unlikely that even a significantly cooler-than-expected print will push policymakers to fire the starting gun on the easing cycle as soon as next month, though said data would likely bring May back into the equation (vs. your scribe’s current expectation of a June cut), providing a fillip for equities in the process.
Besides the marquee CPI figures, the Stateside docket provides plenty of other measures that will grab attention. These include the January retail sales report, likely to show a modest 0.2% MoM decline in headline sales, after a blockbuster 0.6% MoM rise over the festive period.
The week ahead also brings the preliminary read on February consumer sentiment from the University of Michigan, where inflation expectations will be the main focus, with the year-ahead measure having hit a 3-year low in the January survey. The latest PPI and jobless claims data is also likely to be worth a look, though neither the initial or continuing claims prints will pertain to the February nonfarm payrolls survey week.
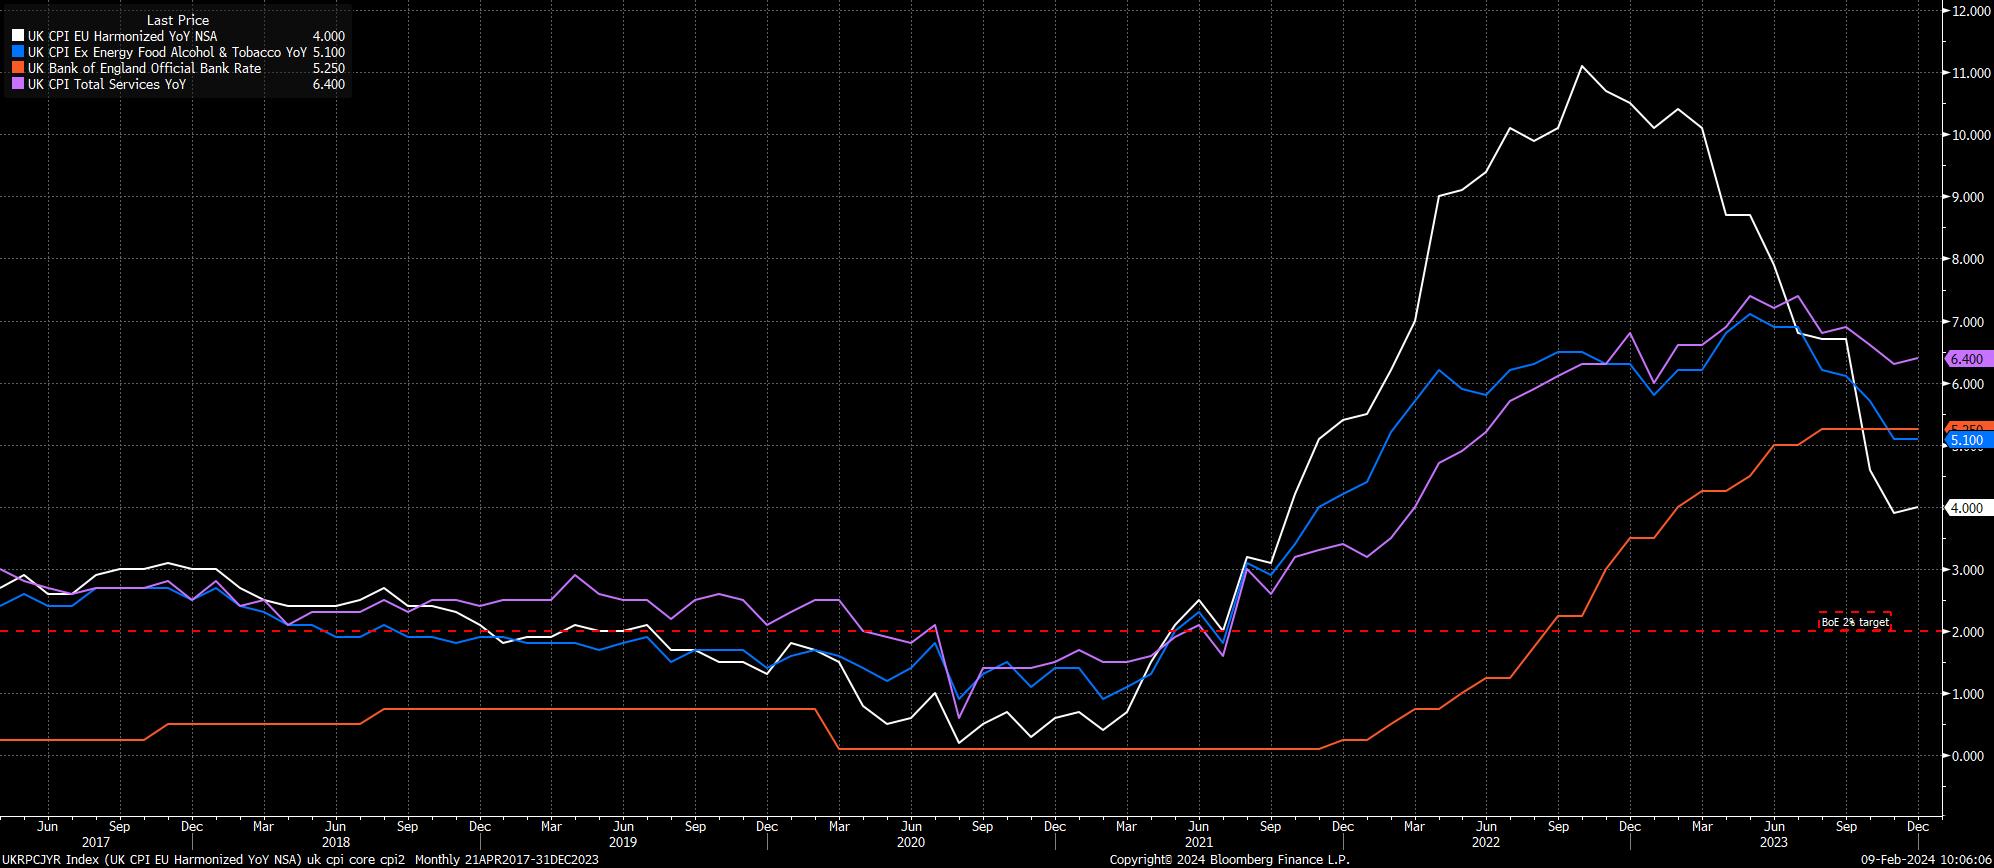
Elsewhere, a jam-packed data docket awaits here in the UK, with the latest labour market, inflation, GDP, and retail sales reports due, from Tuesday to Friday respectively.
Though concerns remain over the accuracy of some jobs data, namely the employment/unemployment figures, the average weekly earnings components will be closely watched, as the MPC’s hawks continue to worry about pay growth being incompatible with a return to the 2% inflation target. On that note, headline inflation is set to tick marginally higher on a YoY basis in January, to 4.2% from 4.0% prior, largely due to base effects skewing the data. Core CPI, meanwhile, should fall 0.1pp to 5.0% YoY, with the data coming as the market continues to reprice its BoE expectations in a hawkish direction, now pricing less than 75bp of easing over the remainder of the year.
Meanwhile, the initial estimate of fourth quarter GDP growth will likely point to the economy having stagnated in the final three months of 2024, though risks to this point firmly to the downside after a catastrophically poor 3.2% MoM decline in retail sales in December, which alone is likely to have subtracted around 0.2pp from GDP during the month. Of course, after an 0.1% QoQ contraction in the third quarter, a further GDP decline in Q4 would result in the economy having ended the year by falling into a technical recession. As noted, the January retail sales print drops on Friday morning, where a modest 1.0% MoM rebound is expected.
Away from the data docket, another busy calendar of central bank talking heads awaits, including a whopping 14 ECB Governing Council members, a handful of FOMC folk including 2024 voter Barkin (again!), and some notable BoE speakers including Governor Bailey on Monday evening.
Elsewhere, geopolitical concerns will of course continue to be monitored, particularly in the Middle East, though the impact of said news on assets outside of crude has dwindled of late. Earnings may also attract some attention, even as the volume of reports on Wall St dies down, with just over 40% of the S&P/ASX 200 (Australia) set to report next week.
Related articles


Diese Inhalte stellen keine unabhängige Finanzanalyse dar, sondern gehören zu unserer Werbemitteilung. Folglich sind die gesetzlichen und regulatorischen Bestimmungen, die sich auf unabhängige Finanzanalysen beziehen, nicht auf diese Website und unsere Kommunikation anwendbar. Diese Inhalte (unabhängig davon, ob sie Meinungen wiedergeben oder nicht) dienen nur der allgemeinen Information und berücksichtigen Ihre persönlichen Umstände oder Ziele nicht. Die Inhalte unserer Webseite und unserer Kommunikation sind nicht als Finanzberatung, Anlageberatung oder andere verlässliche Beratung gedacht und dürfen auch nicht als solche betrachtet werden. Keine auf der Website wiedergegebene Meinung stellt eine Empfehlung seitens Pepperstone oder seitens des Autors dar, nach der eine bestimmte Anlage, Transaktion oder Anlagestrategie oder ein bestimmtes Wertpapier für eine bestimmte Person geeignet wäre.
Obwohl die in dieser Werbemitteilung enthaltenen Informationen aus Quellen, welche als verlässlich betrachtet werden können, bezogen wurden, gewährleisten weder Pepperstone noch der Autor die Richtigkeit oder Vollständigkeit dieser Informationen. Alle Informationen sind nur indikativ, können ohne vorherige Mitteilung abgeändert werden und können jederzeit veraltet sein. Weder Pepperstone noch der Autor übernehmen Haftung für Verluste, welche Sie entweder direkt oder indirekt durch eine Anlageentscheidung, die Sie auf Grundlage einer auf dieser Webseite enthaltenen Informationen getroffen haben, erleiden. Diese Website kann Graphiken enthalten, die frühere Wertentwicklung eines Finanzinstruments und/oder Schätzungen und Prognosen abbilden. Informationen über die frühere Wertentwicklung eines Finanzinstruments lassen keine verlässliche Schlussfolgerung auf die zukünftige Entwicklung zu.