CFD sind komplexe Instrumente und beinhalten wegen der Hebelwirkung ein hohes Risiko, schnell Geld zu verlieren.75.7% der Kleinanlegerkonten verlieren Geld beim CFD-Handel mit diesem Anbieter. Sie sollten überlegen, ob Sie verstehen, wie CFD funktionieren und ob Sie es sich leisten können, das hohe Risiko einzugehen, Ihr Geld zu verlieren.

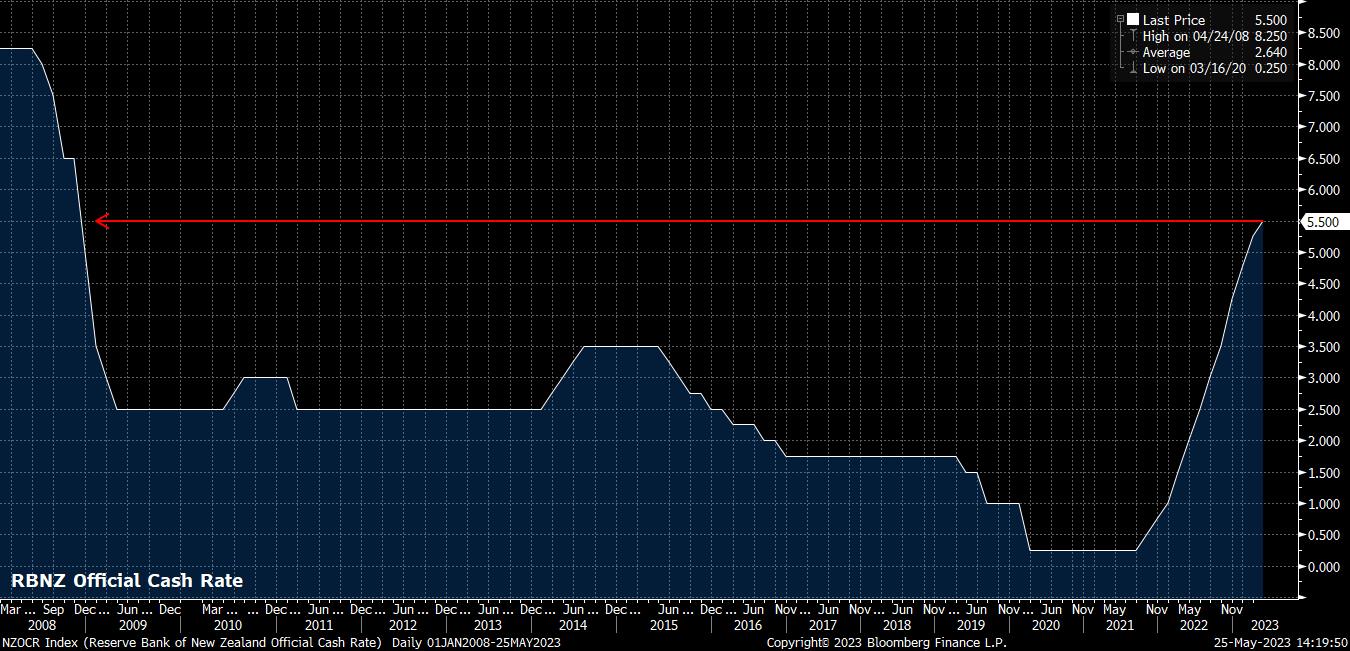
As expected, and as priced by money markets, the RBNZ raised the Official Cash Rate (OCR) by 25bps this week, taking the OCR to its highest level since 2008 at 5.5%. However, this was the only part of the decision that was in line with prior expectations.
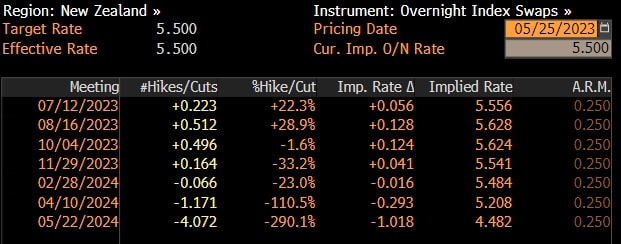
Firstly, the vote split had a dovish bent, with 2 of the 7 member MPC dissenting in favour of leaving rates unchanged, a break from the unity seen thus far in the tightening cycle. Of more importance, the RBNZ effectively declared the hiking cycle to be over, believing that enough tightening has now been delivered to tame price pressures, and return inflation to target. Furthermore, the RBNZ’s own economic forecasts pencilled in rate cuts as soon as the second half of 2024, despite also indicating that a mild recession will likely be experienced in mid-2023.
This was substantially more dovish than markets had been expecting, with the OIS curve pricing at least one additional hike (beyond that delivered this week), before expecting rates to remain on hold. Unsurprisingly, the curve has undergone a significant dovish repricing since, with traders marking their bets to the RBNZ’s own projections, albeit expecting a slightly more aggressive pace of loosening than the central bank itself.
This dovish shock, and subsequent repricing, had a predictably violent impact on the NZD. NZD/USD notched its biggest one-day decline since the early days of the pandemic on Wednesday, while also breaking a number of key technical levels – tumbling below all of the 50-, 100-, and 200-day moving averages, in addition to cracking under the 0.61 handle which has represented the bottom of the range traded since early-March.
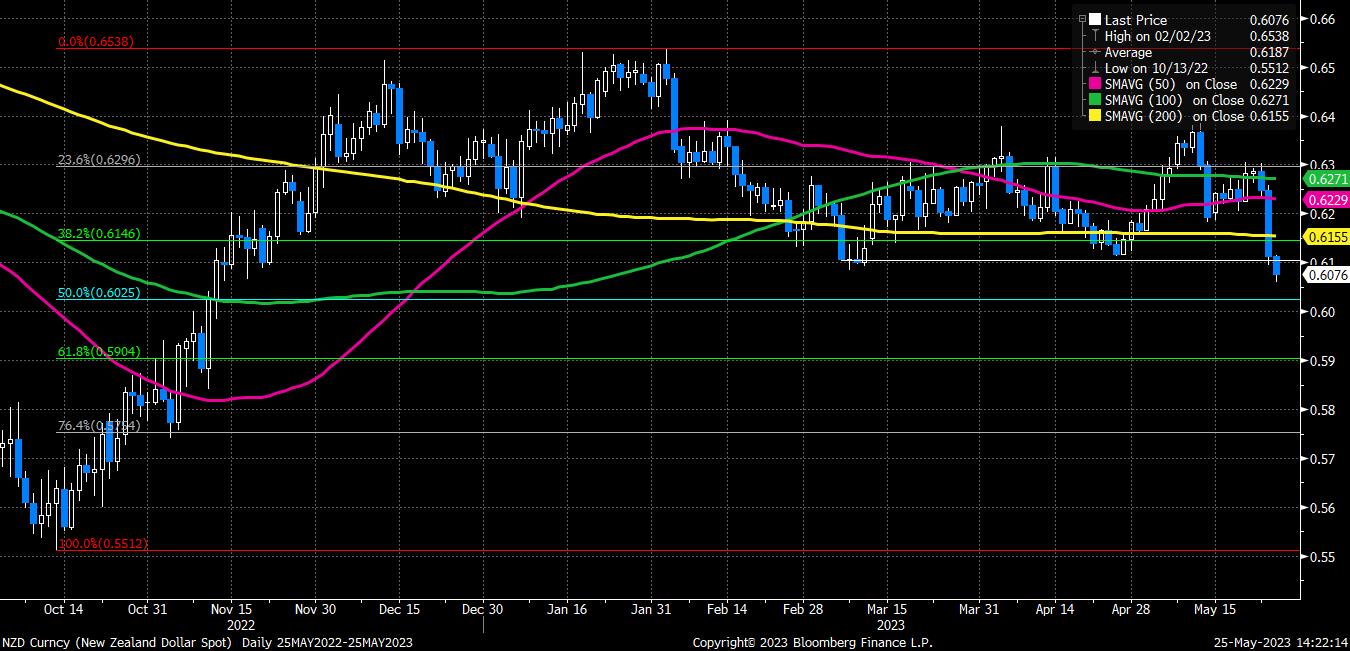
Given that the RBNZ have somewhat demolished the bull case for the Kiwi with their surprisingly dovish decision, and with the aforementioned technical levels breaking, playing from the short side is likely to become increasingly popular. The bears are likely to now be eyeing the 0.60 figure, both due to its psychological importance, and this being the 50% retracement of the rally from Oct 22 to Feb 23.
Against its antipodean peer, the NZD has also come under pressure, seeing AUD/NZD reclaim its 50-day moving average for the first time since late-April.
_M_2023-05-25_14-23-26.jpg)
Once again, we see policy divergence at work here, with the RBA having abandoned their pause at the May meeting, reinstating a tightening bias, and markets pricing a roughly 50/50 chance that the RBA deliver at least one more rate hike. AUDNZD bulls are likely now to be targeting the 100-day moving average at 1.0810, a break of which would add further momentum to the move.
Related articles


Diese Inhalte stellen keine unabhängige Finanzanalyse dar, sondern gehören zu unserer Werbemitteilung. Folglich sind die gesetzlichen und regulatorischen Bestimmungen, die sich auf unabhängige Finanzanalysen beziehen, nicht auf diese Website und unsere Kommunikation anwendbar. Diese Inhalte (unabhängig davon, ob sie Meinungen wiedergeben oder nicht) dienen nur der allgemeinen Information und berücksichtigen Ihre persönlichen Umstände oder Ziele nicht. Die Inhalte unserer Webseite und unserer Kommunikation sind nicht als Finanzberatung, Anlageberatung oder andere verlässliche Beratung gedacht und dürfen auch nicht als solche betrachtet werden. Keine auf der Website wiedergegebene Meinung stellt eine Empfehlung seitens Pepperstone oder seitens des Autors dar, nach der eine bestimmte Anlage, Transaktion oder Anlagestrategie oder ein bestimmtes Wertpapier für eine bestimmte Person geeignet wäre.
Obwohl die in dieser Werbemitteilung enthaltenen Informationen aus Quellen, welche als verlässlich betrachtet werden können, bezogen wurden, gewährleisten weder Pepperstone noch der Autor die Richtigkeit oder Vollständigkeit dieser Informationen. Alle Informationen sind nur indikativ, können ohne vorherige Mitteilung abgeändert werden und können jederzeit veraltet sein. Weder Pepperstone noch der Autor übernehmen Haftung für Verluste, welche Sie entweder direkt oder indirekt durch eine Anlageentscheidung, die Sie auf Grundlage einer auf dieser Webseite enthaltenen Informationen getroffen haben, erleiden. Diese Website kann Graphiken enthalten, die frühere Wertentwicklung eines Finanzinstruments und/oder Schätzungen und Prognosen abbilden. Informationen über die frühere Wertentwicklung eines Finanzinstruments lassen keine verlässliche Schlussfolgerung auf die zukünftige Entwicklung zu.