- Deutsch
Analysen
.jpg?height=93&quality=100)
EURUSD:
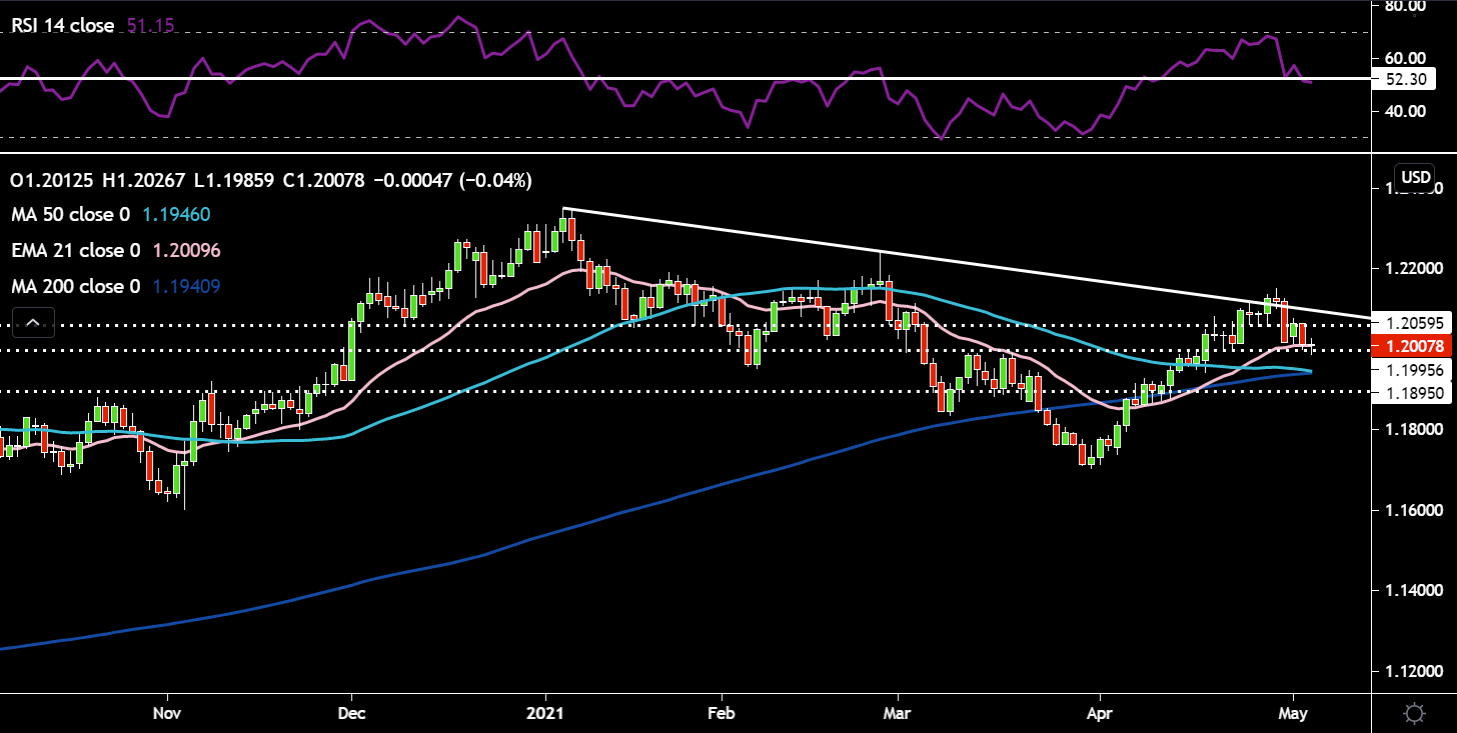
EURUSD was looking strong throughout April, but now seems to be paring back its gains as it peaked its head above the downtrend line around the 1.212 area. It has come off quite aggressively from this area and now finds itself right on the 21-day EMA, around 1.20. Speaking of moving averages the 50-day SMA is very close to falling below the 200-day SMA, which would mean a death cross would occur (typically bearish). The RSI definitely seems to have suffered some high altitude sickness and looks to have rolled over, now just below the key 52 level. There is some minor support around the 1.1995 area as indicated by the white horizontal dotted line. If price slides below that then the next area which seems plausible would be the 50-day/200-day SMA around 1.194. If price decides to shift gears and turn northwards then 1.205 resistance would come into play. The US Non-Farm Payroll numbers out tomorrow could be a big driver of euro direction into the weekend close.
GBPUSD:
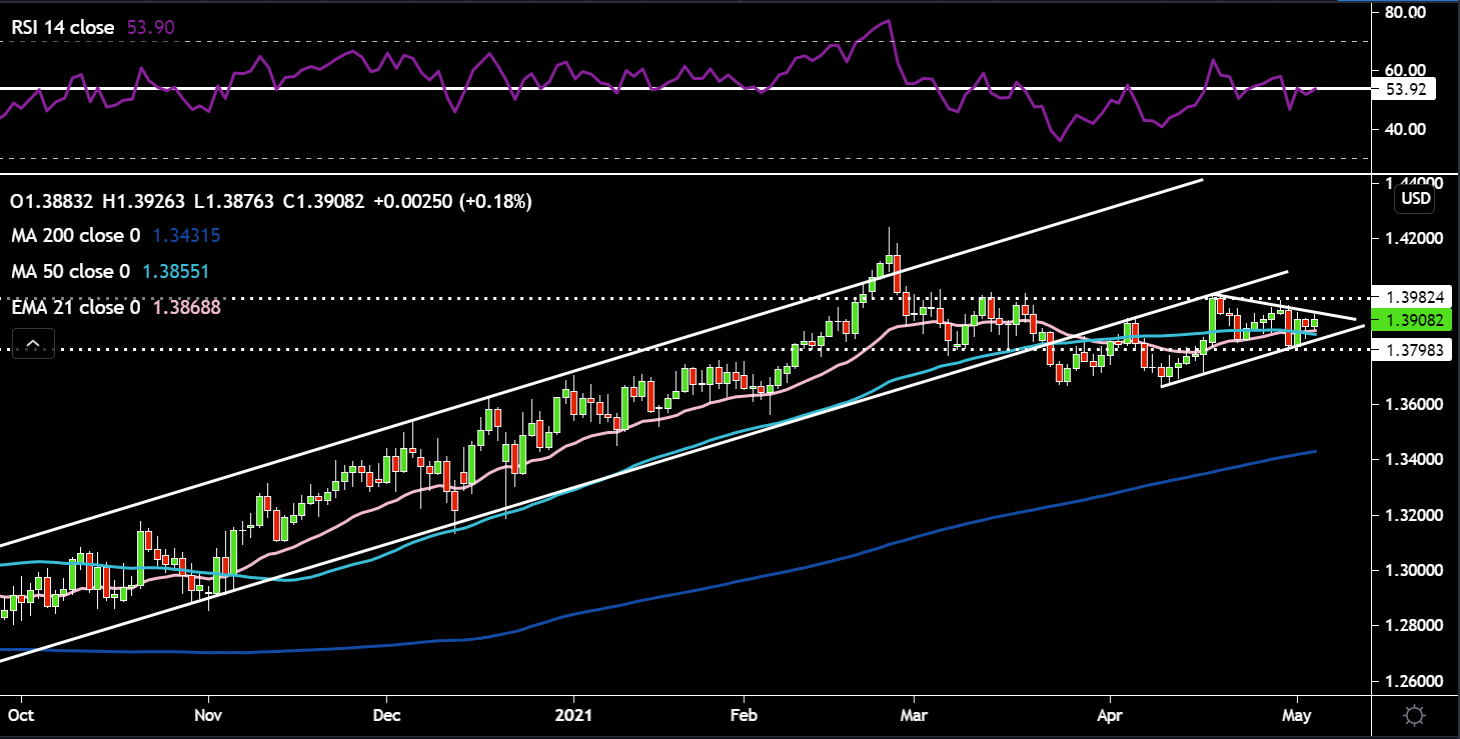
Price just can’t seem to overcome the 1.40 handle at the moment. Could today’s twin events be the catalyst to see this sticky zone eventually negotiated? The RSI recently had a go at piercing through the key 53 level, rolled over and is now having a 2nd go as of writing. Price is just above the 21-day EMA & 50-day SMA with the 50-day SMA just crossing below the 21-day EMA. In terms of chart patterns we have a small triangle pattern which has emerged, signifying a breakout in either direction is becoming increasingly likely. I’d like to see a move above the 1.40 level and back into the ascending channel to feel more confident on longs. From a seasonality perspective, the dollar is historically strong during the month of May, which could see Cable struggle to move higher throughout this month.
AUDUSD:
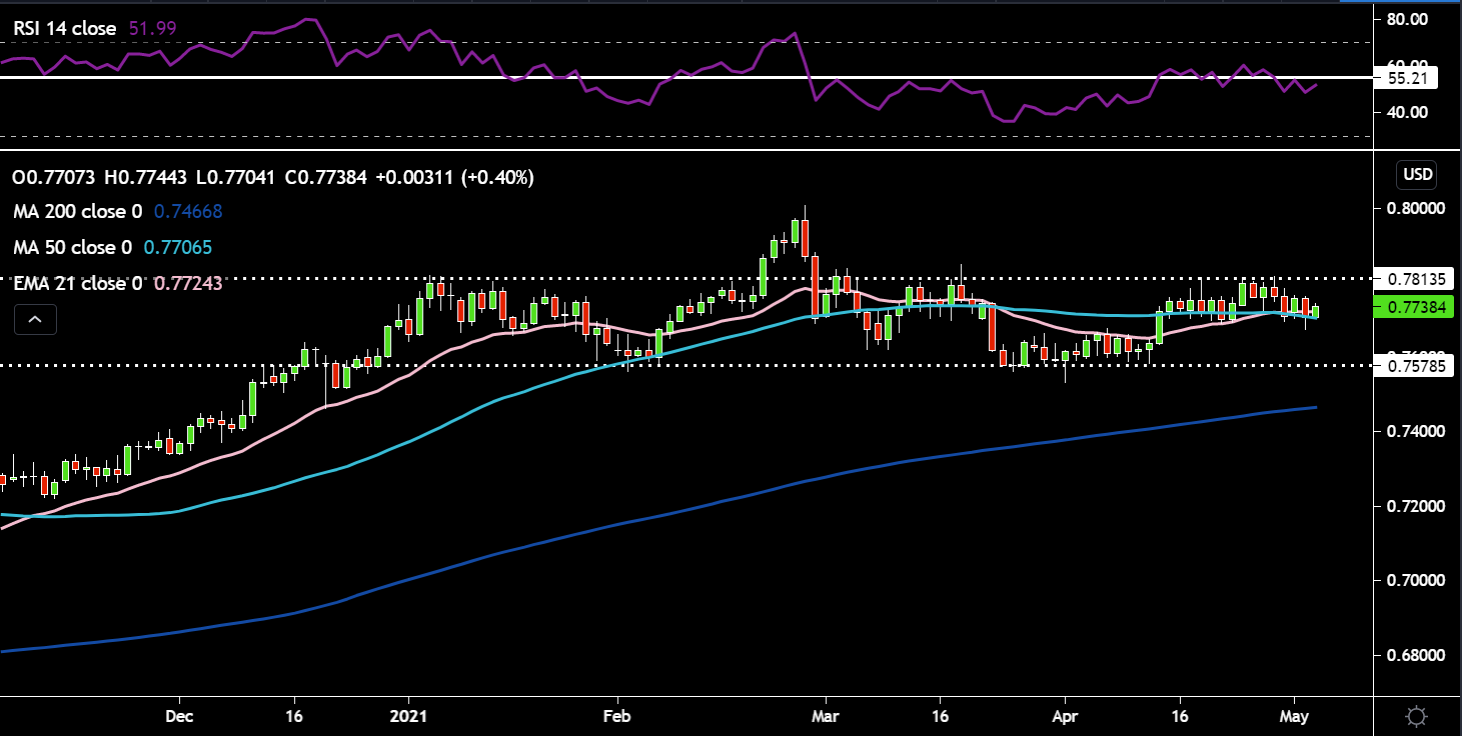
The Aussie brushed off the latest RBA meeting with the main takeaway that any policy shifts will occur in July. The Aussie had a strong April as it rallied off range support at 0.757, buttressed by a booming commodities complex, particularly copper and iron ore. Price has been moving sideways in a wide range (0.75 – 0.78) from the beginning of this year. There was a brief overshoot of the 0.78 resistance to 0.8, but price faltered from there and is now back in the range. The 21-day EMA has crossed above the 50-day SMA, however, it’s very minor so we will have to see if this can push short term momentum higher. Both moving averages, particularly the 21-day EMA have been providing dynamic support to price of late. The RSI is just below the 55 level which marked previous price rallies close to the 0.78 resistance. With dollar strength in May, maybe it’s wise to play the range – looking to enter longs and shorts at range support (0.75) and resistance (0.78) respectively, instead of looking for big breakout moves.
USDCAD:
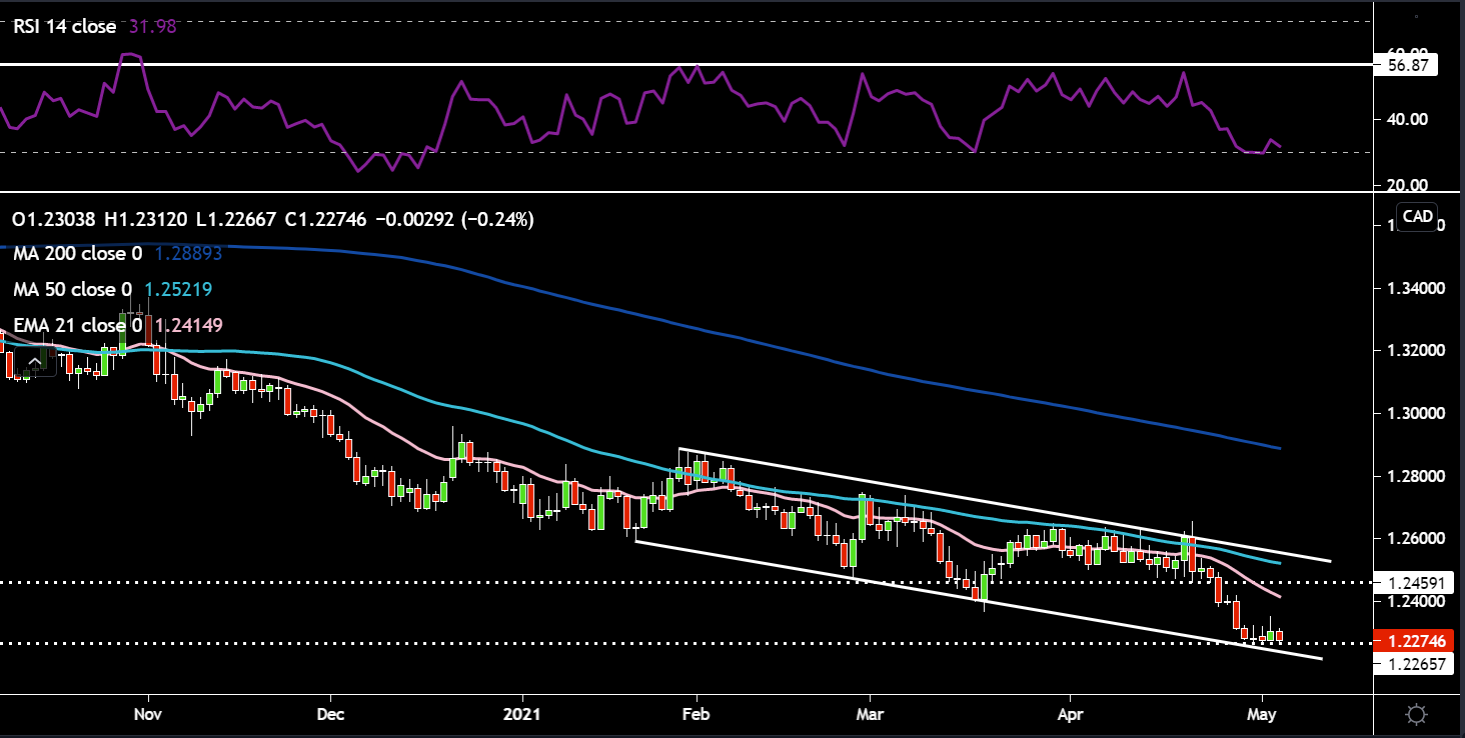
The other well-known commodity currency, the Loonie, which has been one of the nicest crosses to trade given it’s trending nature is also on my radar. However, the question remains will USDCAD hold the lower trend line of the descending channel and move upwards or slice through this line like butter? The downtrend, 50-day SMA and RSI have all provided the resistance needed to keep the USDCAD in check to the upside, allowing short sellers to pick up some nice gains. The RSI is currently hovering around oversold territory and may see a bounce higher in price action. There is also some horizontal support around 1.226 which is proving sticky for moves lower. If price were to rally off this area, the next target would be the 21-day EMA around the 1.24 area, above this the 1.245 overhead resistance comes into play.
USDJPY:
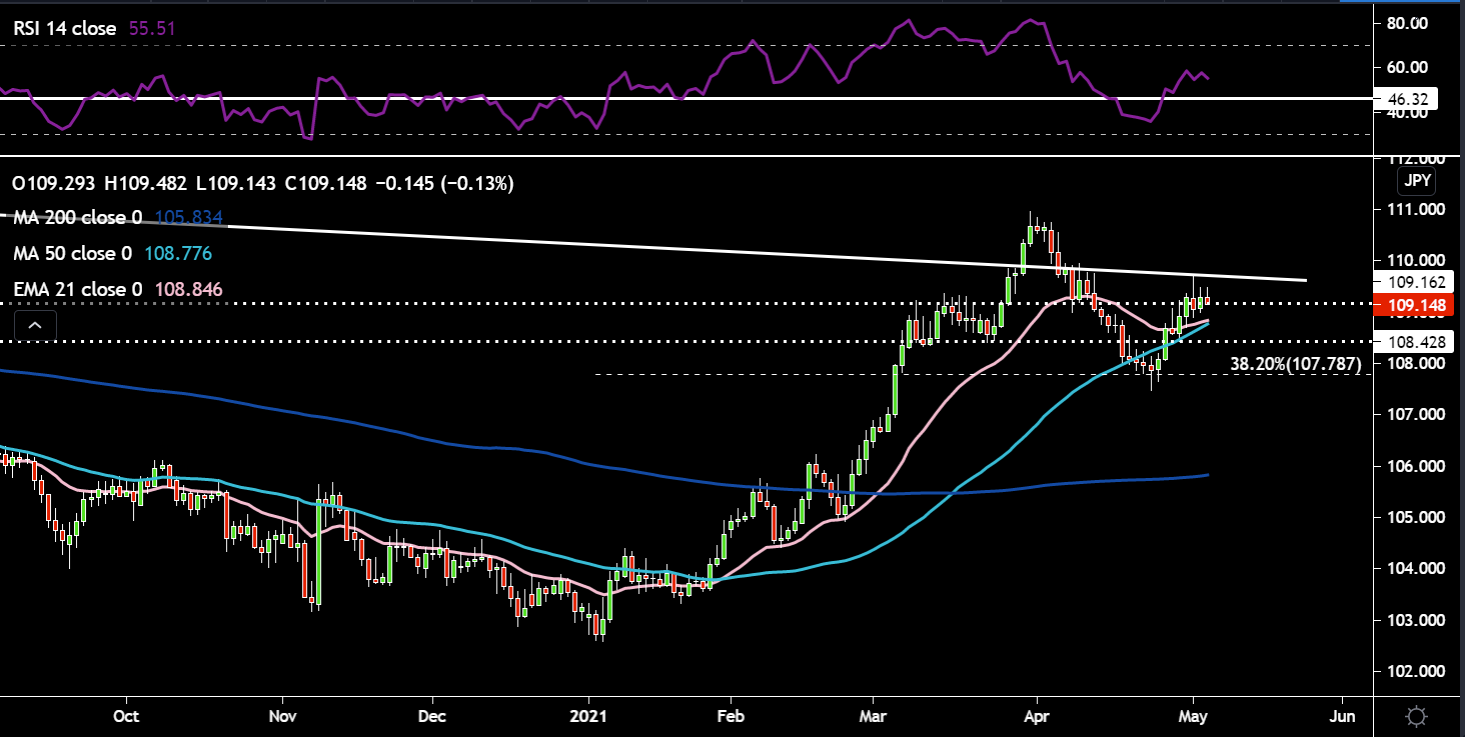
USDJPY has surged off its 38.2% Fibonacci support level, smashing through the 108.42 former range support and is now just above the range resistance of 109.16. Monday’s price candle also tagged the downtrend line in place from November 2018. The 21-day EMA is still above the 50-day SMA showing positive short term momentum signs. Both are also pointing upwards, another positive sign for USDJPY bulls. The NFP number out on Friday could see US-10 year yields rising which would help propel USDJPY higher. The RSI is above the key 46 level and has plenty room before it can be considered overbought.
USDCHF:
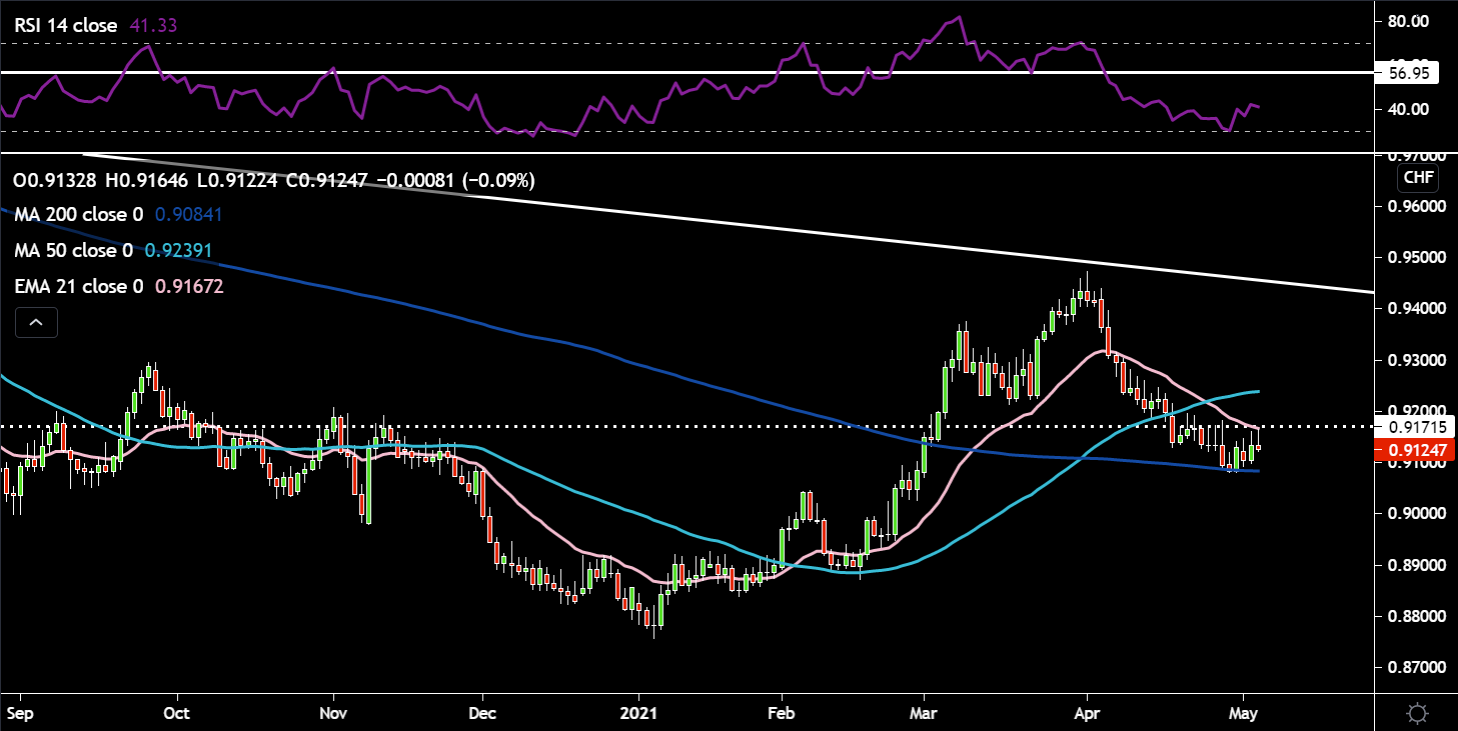
The Swissie looks under pressure as USDCHF makes a play for the overhead resistance at 0.917 and the 21-day EMA. The next target above here would be the 50-day SMA around 0.923. Price held the key support of the 200-day SMA. The RSI is in a bit of no man’s land as it hovers above oversold territory, leaving plenty room if price were to charge higher before fears of overbought kicked back in. The 21-day EMA will need to cross back above the 50-day SMA. Could a strong dollar send USDCHF back up to the downtrend line around 0.94 similar to what we saw in early April? However, there are multiple levels of resistance which will need to be negotiated before we get close to those April highs.
Related articles
Bereit zu traden?
Es ist einfach, ein Pepperstone-Konto zu eröffnen. Stellen Sie Ihren Antrag innerhalb von Minuten, auch mit einer geringen Einzahlung. Beginnen Sie Ihre Reise mit Pepperstone noch heute.
Diese Inhalte stellen keine unabhängige Finanzanalyse dar, sondern gehören zu unserer Werbemitteilung. Folglich sind die gesetzlichen und regulatorischen Bestimmungen, die sich auf unabhängige Finanzanalysen beziehen, nicht auf diese Website und unsere Kommunikation anwendbar. Diese Inhalte (unabhängig davon, ob sie Meinungen wiedergeben oder nicht) dienen nur der allgemeinen Information und berücksichtigen Ihre persönlichen Umstände oder Ziele nicht. Die Inhalte unserer Webseite und unserer Kommunikation sind nicht als Finanzberatung, Anlageberatung oder andere verlässliche Beratung gedacht und dürfen auch nicht als solche betrachtet werden. Keine auf der Website wiedergegebene Meinung stellt eine Empfehlung seitens Pepperstone oder seitens des Autors dar, nach der eine bestimmte Anlage, Transaktion oder Anlagestrategie oder ein bestimmtes Wertpapier für eine bestimmte Person geeignet wäre.
Obwohl die in dieser Werbemitteilung enthaltenen Informationen aus Quellen, welche als verlässlich betrachtet werden können, bezogen wurden, gewährleisten weder Pepperstone noch der Autor die Richtigkeit oder Vollständigkeit dieser Informationen. Alle Informationen sind nur indikativ, können ohne vorherige Mitteilung abgeändert werden und können jederzeit veraltet sein. Weder Pepperstone noch der Autor übernehmen Haftung für Verluste, welche Sie entweder direkt oder indirekt durch eine Anlageentscheidung, die Sie auf Grundlage einer auf dieser Webseite enthaltenen Informationen getroffen haben, erleiden. Diese Website kann Graphiken enthalten, die frühere Wertentwicklung eines Finanzinstruments und/oder Schätzungen und Prognosen abbilden. Informationen über die frühere Wertentwicklung eines Finanzinstruments lassen keine verlässliche Schlussfolgerung auf die zukünftige Entwicklung zu.