Was ist Forex-Trading und wie handelt man damit?
Forex-Trading ist der Handel mit Währungen, um von Wechselkursschwankungen zu profitieren. Händler kaufen oder verkaufen Währungspaare basierend auf Analysen und nutzen Plattformen für Transaktionen.

Kurzüberblick: Was ist Forex-Trading?
Forex-Trading ist der Handel mit Währungen auf einem globalen, dezentralen Markt. Trader spekulieren auf die Kursentwicklung von Währungspaaren wie EUR/USD oder GBP/USD, um aus Wechselkursschwankungen Gewinne zu erzielen. Der Markt ist unter der Woche rund um die Uhr geöffnet und reagiert auf wirtschaftliche Daten, politische Ereignisse und Marktstimmung. Da Volatilität und Liquidität je nach Handelssitzung stark schwanken, spielt der Zeitpunkt des Handels eine wichtige Rolle.
Was ist Forex-Trading?
Forex-Trading (Devisenhandel) ist der Handel mit Währungen auf einem globalen Markt, auf dem Währungspaare wie EUR/USD, GBP/USD oder USD/JPY gekauft und verkauft werden. Ziel ist es, Preisbewegungen zwischen zwei Währungen auszunutzen und daraus Gewinne zu erzielen.
Der Forex-Markt ist von Montag bis Freitag durchgehend geöffnet. Er reagiert auf:
- Konjunkturdaten
- geldpolitische Entscheidungen
- Nachrichten und geopolitische Entwicklungen
- Markttrends und Sentiment
Trader nutzen Handelsplattformen, um Währungspaare zu kaufen oder zu verkaufen und können – ähnlich wie bei Rohstoff-CFDs – sowohl auf steigende als auch auf fallende Wechselkurse setzen.
Warum Timing im Forex-Trading wichtig ist
Im Forex-Trading beeinflusst nicht nur die Strategie den Erfolg, sondern auch der Zeitpunkt des Handels. Volatilität und Liquidität unterscheiden sich je nach Tageszeit deutlich. Der richtige Einstiegs- und Ausstiegszeitpunkt kann Spreads, Geschwindigkeit von Kursbewegungen und Risiken spürbar beeinflussen.
Deshalb ist das Verständnis der globalen Handelssitzungen ein zentraler Bestandteil jeder Forex-Strategie.
Forex-Handelssitzungen und deren Bedeutung
Der Forex-Markt läuft 24 Stunden am Tag, gliedert sich aber in vier große Handelssitzungen. Diese überlappen teilweise, wodurch Aktivität und Handelsvolumen steigen.
Offizielle Forex-Sitzungszeiten (UTC)
- Sydney: 21:00 bis 06:00 (UTC+10)
- Tokio: 00:00 bis 09:00 (UTC+9)
- London: 07:00 bis 16:00 (UTC+1)
- New York: 12:00 bis 21:00 (UTC−4)
Während der Überschneidungen, insbesondere London - New York, ist die Marktaktivität am höchsten. Dort entstehen häufig starke Kursbewegungen und enge Spreads, was diese Phasen für viele Trader besonders attraktiv macht.
Die wichtigsten Handelssitzungen im Detail
Sydney
Die Sydney-Sitzung markiert den Wochenbeginn. Sie liefert erste Hinweise auf die mögliche Marktstimmung. Ihre Überschneidung mit Tokio sorgt für vorübergehend höhere Volatilität.
Tokio
Die Tokiositzung ist geprägt von höherer Liquidität in JPY-Paaren. Sie überschneidet sich mit Sydney und führt damit zu einer aktiveren Marktphase. Vor Beginn der London-Sitzung nimmt die Aktivität leicht ab.
London
Eine der wichtigsten Sitzungen. Das Handelsvolumen ist hoch und der Markt sehr aktiv. London überschneidet sich mit dem Ende der Tokio-Sitzung und dem Beginn der New-York-Sitzung. EUR-, GBP- und CHF-Paare zeigen in dieser Phase oft starke Bewegungen.
New York
New York ist die aktivste Sitzung des Tages. Sie beeinflusst Liquidität und Preisbildung weltweit. Die Überschneidung mit London erzeugt die stärkste Volatilität des Tages. US-Konjunkturdaten, zum Beispiel Arbeitsmarkt oder Inflation, lösen häufig dynamische Kursbewegungen aus.
Wie funktioniert das Forex-Trading?
Forex-Trading basiert darauf, eine Währung zu kaufen und gleichzeitig eine andere zu verkaufen. Jede Transaktion erfolgt immer paarweise, da der Wert einer Währung nur im Verhältnis zu einer anderen gemessen werden kann. Gewinne und Verluste entstehen durch Veränderungen dieses Wechselkurses.
Zentrale Elemente des Forex-Handels
Währungspaare
Der Handel erfolgt immer mit einem Währungspaar wie EUR/USD oder GBP/JPY. Die erste Währung ist die Basiswährung, die zweite die Kurs- oder Notierungswährung. Wenn ein Trader EUR/USD kauft, wird der Euro gekauft und der US-Dollar gleichzeitig verkauft.
Wechselkurse
Der Wechselkurs gibt an, wie viel der Notierungswährung benötigt wird, um eine Einheit der Basiswährung zu kaufen. Steigt der Kurs, gewinnt die Basiswährung an Wert. Sinkt er, wird sie schwächer.
Auftragsarten (Orders)
Trader nutzen Marktorders, um sofort zum aktuellen Kurs zu handeln, oder Limitorders, um Positionen zu einem bestimmten Preis zu eröffnen. Stop-Orders helfen dabei, Verluste zu begrenzen oder Gewinne automatisch zu sichern.
Ausführung über Handelsplattformen
Transaktionen werden über Handelsplattformen wie MetaTrader 4 und MetaTrader 5, cTrader oder TradingView abgewickelt. Diese Plattformen zeigen Echtzeitkurse, ermöglichen Analysen und erlauben das Platzieren und Überwachen von Positionen.
Hebel (Leverage)
Mit Hebel können Trader größere Positionen kontrollieren, als ihr Kontostand es eigentlich zulassen würde. Ein Hebel multipliziert sowohl potenzielle Gewinne als auch potenzielle Verluste. Das macht ein strukturiertes Risikomanagement unverzichtbar.
Analysen zur Entscheidungsfindung
Trader nutzen zwei Analyseformen:
- Technische Analyse: Charts, Indikatoren, Muster und Preisverhalten
- Fundamentalanalyse: Konjunkturdaten, Zinsen, politische Ereignisse und Nachrichten
Beide Ansätze unterstützen fundierte Einschätzungen über mögliche Kursbewegungen.
Was ist ein Forex-Paar?
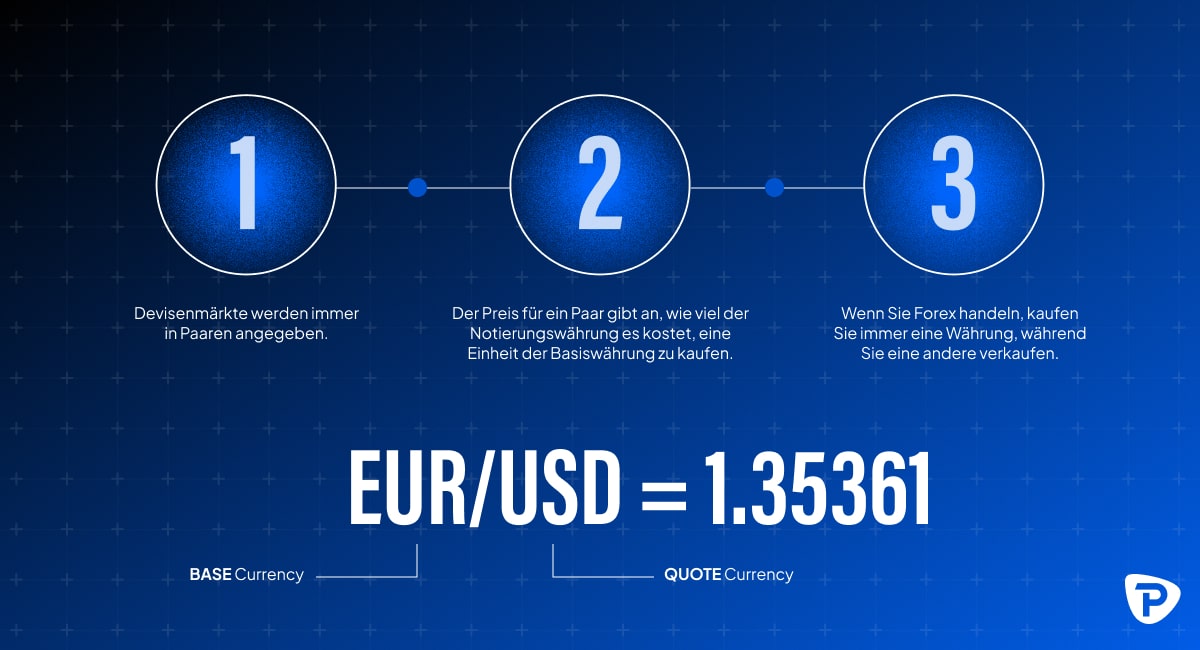
Ein Forex-Paar besteht aus zwei Währungen, die gegeneinander notiert werden. Die erste Währung ist die Basiswährung, die zweite die Notierungswährung. Der Kurs zeigt an, wie viel der Notierungswährung nötig ist, um eine Einheit der Basiswährung zu kaufen.
Beispiel: EUR/USD = 1,10855
→ Für einen Euro benötigt man 1,10855 US-Dollar.
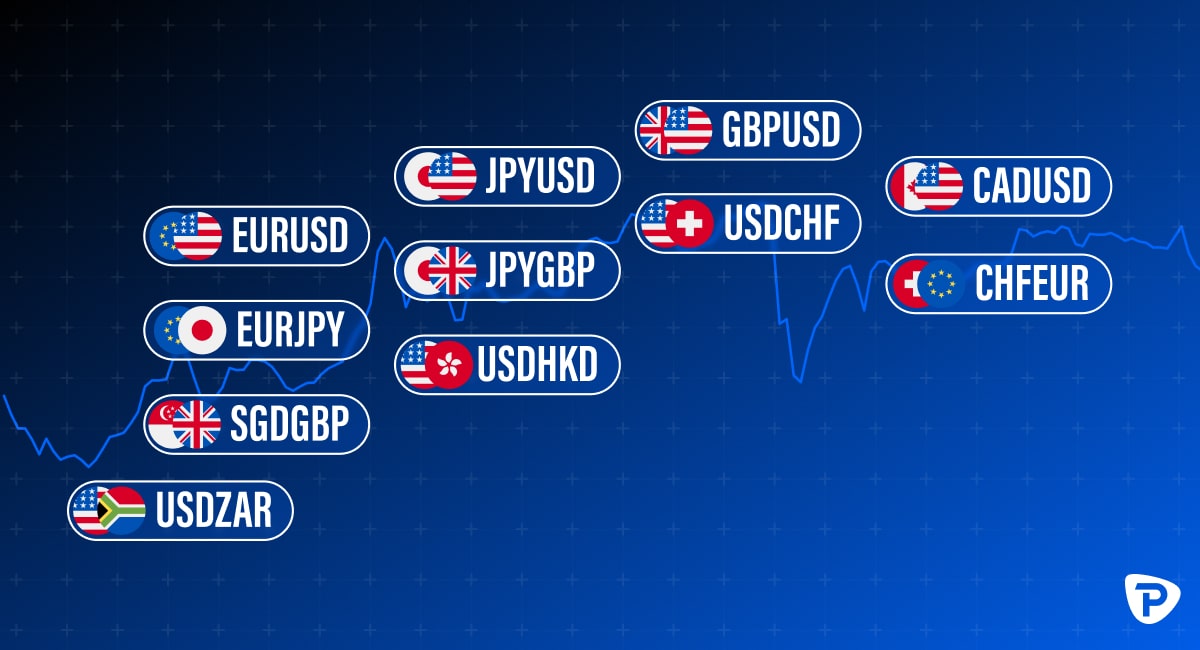
Forex-Paare lassen sich in drei Kategorien einteilen:
- Majors: Die liquidesten Paare, meist mit USD (z. B. EUR/USD, USD/JPY).
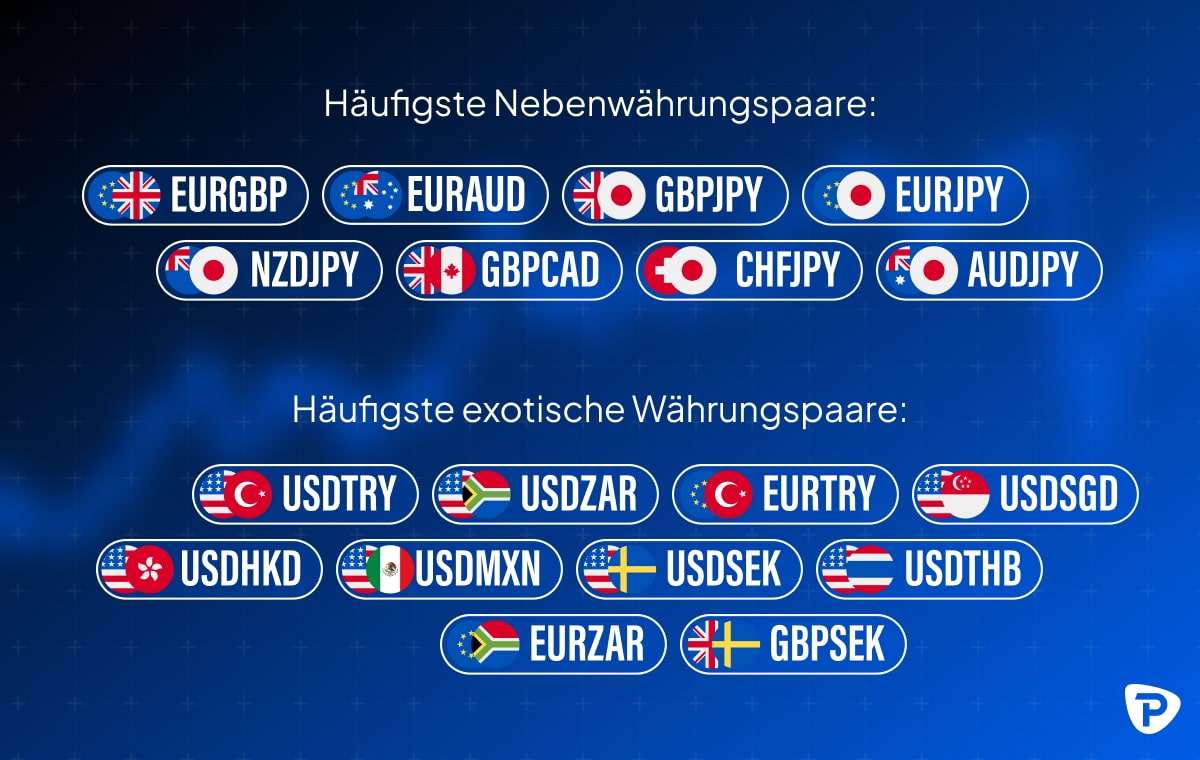
- Minors: Paare ohne US-Dollar, aber mit großen Währungen wie EUR/GBP oder GBP/JPY.
- Exotics: Kombinationen einer großen Währung mit einer Schwellenländerwährung, z. B. USD/TRY.
Majors sind besonders beliebt, da sie enge Spreads, hohe Liquidität und stabile Handelsbedingungen bieten.
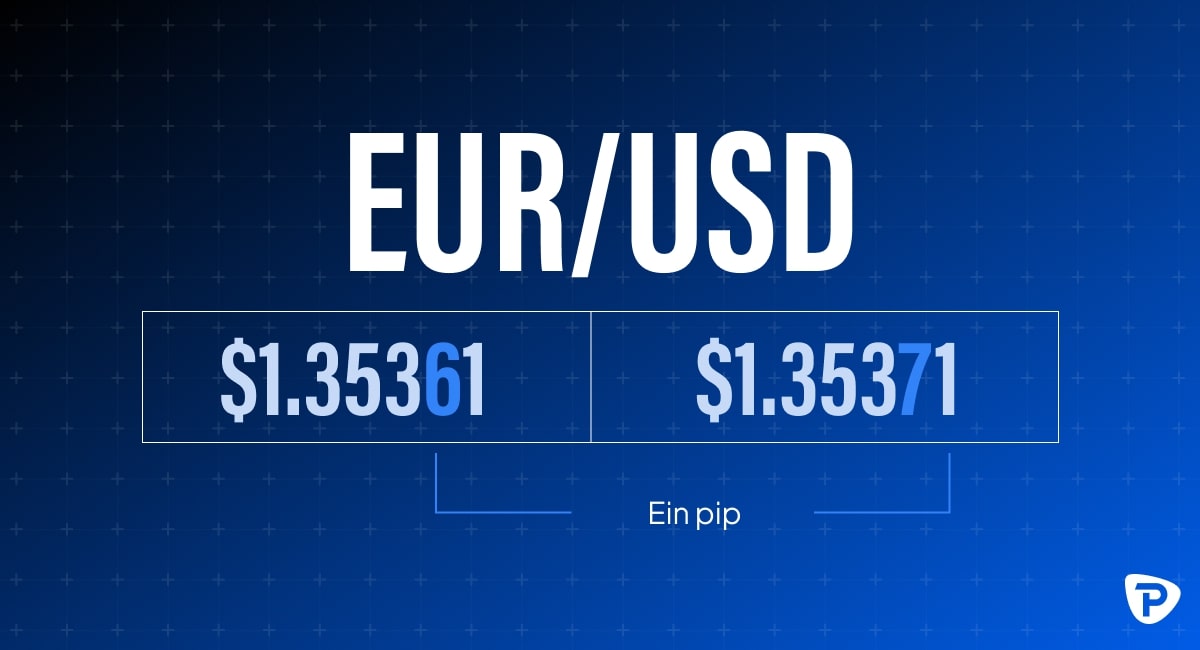
Was ist ein PIP im Forex-Trading?
Ein PIP (Percentage In Point) ist die kleinste standardisierte Preisänderung im Forex-Handel. Bei den meisten Währungspaaren entspricht ein PIP der vierten Dezimalstelle eines Kurses, also 0,0001.
Beispiel: Bewegt sich EUR/USD von 1,1050 auf 1,1051, entspricht diese Veränderung einem PIP.
PIPs erleichtern die Berechnung von Gewinnen, Verlusten und Risiko, da sie Preisbewegungen über verschiedene Währungspaare hinweg vergleichbar machen.
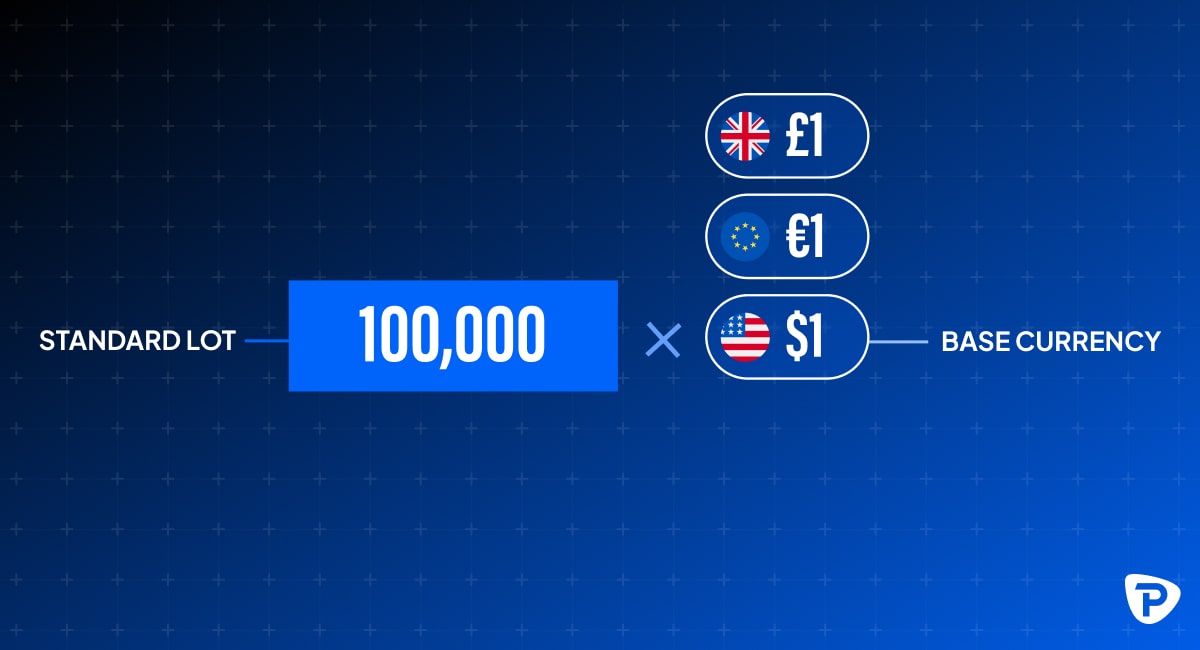
Was ist ein Lot im Forex-Trading?
Ein Lot beschreibt die Größe einer Position im Forex-Handel. Da Währungen in standardisierten Mengen gehandelt werden, helfen Lots dabei, Positionsgrößen klar zu definieren und Risiken präzise zu steuern.
Es gibt vier übliche Lot-Größen:
Standardlot
- 100.000 Einheiten der Basiswährung
- Beispiel: Bei einem EUR/USD-Kurs von 1,1076 entspricht ein Standardlot einem Gegenwert von 100.000 × 1,1076 = 110.760 USD
Mini-Lot
- 10.000 Einheiten der Basiswährung
- Gegenwert im Beispiel: 11.076 USD
Mikro-Lot
- 1.000 Einheiten der Basiswährung
- Gegenwert im Beispiel: 1.107,60 USD
Nano-Lot
- 100 Einheiten der Basiswährung
- Gegenwert im Beispiel: 110,76 USD
Nano-Lots werden oft von Einsteigern oder Tradern mit kleinen Konten genutzt, um erste Strategien mit geringerem Risiko zu testen.
Wie beeinflussen Lotgrößen den Pip-Wert?
Der Pip-Wert hängt immer von zwei Faktoren ab: der Lotgröße und dem jeweiligen Wechselkurs des Währungspaares. Je größer das Lot, desto stärker wirkt sich jede Pip-Bewegung auf Gewinn oder Verlust aus.
Bei einem Standardlot mit 100.000 Einheiten ergeben sich folgende typische Berechnungen:
Beispiele für Paare mit dem US-Dollar als Basiswährung:
- USD/JPY bei 144,90:
(0,01 / 144,90) × 100.000 = 6,90 USD pro Pip - USD/CHF bei 1,1791:
(0,0001 / 1,1791) × 100.000 = 8,48 USD pro Pip
Bei Währungspaaren, bei denen der US-Dollar nicht an erster Stelle steht, wird ein zusätzlicher Schritt benötigt. Hier wird zunächst der Pip-Wert in der Basiswährung berechnet und anschließend in US-Dollar umgerechnet.
Beispiele:
- EUR/USD bei 1,1080:
(0,0001 / 1,1080) × 100.000 = 9,03
9,03 × 1,1080 ≈ 10 USD pro Pip - GBP/USD bei 1,3170:
(0,0001 / 1,3170) × 100.000 = 7,59
7,59 × 1,3170 ≈ 10 USD pro Pip
Broker können unterschiedliche Rundungsmethoden verwenden, allerdings wird der Pip-Wert für jedes Paar immer klar angegeben. Da sich Wechselkurse laufend ändern, verändert sich auch der Pip-Wert dynamisch mit dem Markt.
Die meistgehandelten Währungspaare 2025 - Übersicht & Gründe
Top Forex-Paare im Jahr 2025
Das führende Forex-Paar weltweit ist EUR/USD (Euro/US-Dollar). Es bleibt das am stärksten gehandelte Währungspaar, da es die Währungen der größten Wirtschaftsräume der Welt kombiniert. Weitere besonders häufig gehandelte Majors sind: USD/JPY, GBP/USD, USD/CHF, AUD/USD, USD/CAD und NZD/USD. Diese sieben Paare gelten als die wichtigsten Majors.
Über 50 % bis etwa 90 % der globalen Forex-Trades beinhalten den US-Dollar (USD) — entweder als Basis- oder Notierungswährung. Das unterstreicht die Dominanz des US-Dollars im Devisenhandel.
Warum sind diese Majors so populär?
Die wichtigsten Währungspaare zeichnen sich durch hohe Liquidität und enge Spreads aus, was schnelle Transaktionen zu geringen Kosten ermöglicht. Dadurch eignen sie sich sowohl für kurzfristige Strategien wie Daytrading als auch für längerfristiges Trading. Dank des hohen Handelsvolumens großer Marktteilnehmer ist das Risiko von Slippage vergleichsweise gering, denn die Ausführungspreise sind stabiler und weniger anfällig für plötzliche Kurslücken.
Ein weiterer Vorteil ist die regelmäßige Veröffentlichung makroökonomischer Daten in großen Wirtschaftsräumen. Entscheidungen zu Zinsen, Inflationszahlen oder Konjunkturdaten wirken sich häufig direkt auf die betreffenden Währungen aus, was eine fundierte fundamentale Analyse ermöglicht. Hinzu kommt, dass Majors bei nahezu allen Forex-Brokern verfügbar sind. Sie werden mit hoher Markttiefe und stabiler Ausführung angeboten, was sie besonders zugänglich und deshalb weltweit beliebt macht.
Minderheiten (Minors) und Exoten – was steckt dahinter?
Neben den Majors existiert eine Vielzahl anderer Währungspaare:
- Minors (Kreuzwährungen ohne USD): Beispiele sind Paare wie EUR/GBP, EUR/JPY oder GBP/CHF. Manche Trader nutzen sie, um USD-Risiko zu vermeiden oder spezifische Marktbeziehungen abzubilden.
- Exoten: Diese kombinieren oft eine große Währung mit einer Schwellenländerwährung, z. B. USD/TRY, USD/SGD oder USD/MXN. Exoten sind oft weniger liquide, haben größere Spreads und zeigen höhere Volatilität.
Für wen sind welche Paare geeignet?
Für Einsteiger und aktive Trader eignen sich vor allem die Major-Währungspaare wie EUR/USD, USD/JPY oder GBP/USD. Sie bieten hohe Liquidität, niedrige Handelskosten und stabile Marktbedingungen, was den Einstieg erleichtert und saubere Ausführungen ermöglicht.
Trader mit einem spezifischen Fokus oder einer höheren Risikobereitschaft greifen hingegen häufiger zu Minor- oder Exotenpaaren. Diese können attraktive Diversifikationsmöglichkeiten und potenziell höhere Renditen bieten, gehen jedoch mit größeren Spreads und geringerer Liquidität einher, was das Risiko erhöht.
Welches Währungspaar geeignet ist, hängt auch vom eigenen Handelsstil ab. Daytrader und Scalper bevorzugen Majors, da deren enge Spreads und schnelle Reaktionen auf Marktbewegungen optimale Voraussetzungen für kurzfristige Strategien schaffen. Swing- und Position-Trader nutzen dagegen häufig Minors oder Exoten, wenn sie mittel- bis langfristige Marktmeinungen, fundamentale Entwicklungen oder regionale Ereignisse handeln möchten.
Welche Strategien gibt es für den Forex-Handel?
Forex kann auf verschiedene Weise gehandelt werden. Die Wahl der passenden Strategie hängt oft vom Erfahrungsstand, der verfügbaren Zeit und dem persönlichen Risikoprofil ab.
Kurzfristige Strategien:
Zu den bekanntesten Ansätzen gehört das Daytrading, bei dem Positionen innerhalb eines Handelstages geöffnet und geschlossen werden. Eine weitere kurzfristige Methode ist das Scalping. Hier werden viele sehr schnelle Trades ausgeführt, um kleinste Kursbewegungen auszunutzen, was allerdings mit erhöhten Transaktionskosten und einem hohen Fokus auf Ausführungsgeschwindigkeit verbunden ist.
Mittelfristige Ansätze:
Beim Swing Trading werden Positionen mehrere Tage oder Wochen gehalten, um von erwarteten Marktbewegungen oder kurzfristigen Trends zu profitieren. Trader versuchen dabei, zyklische Schwankungen innerhalb bestehender Markttrends auszunutzen.
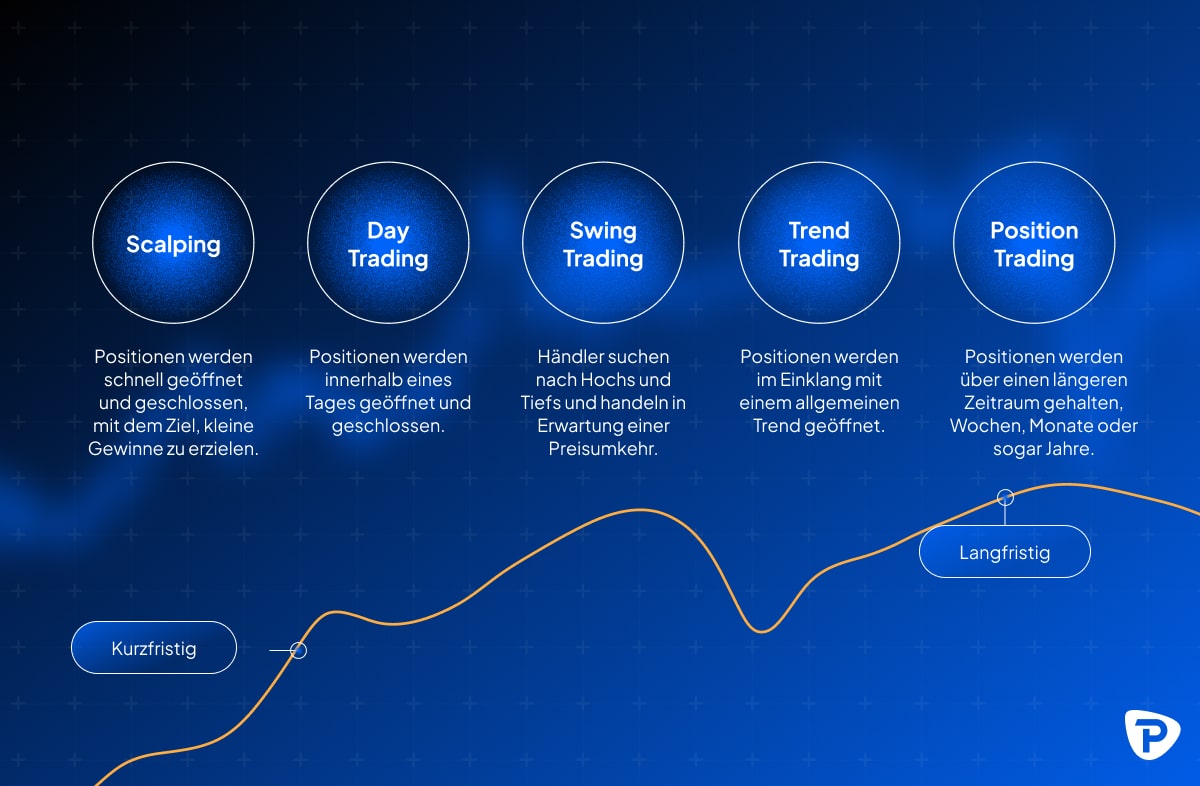
Trend- und Musterstrategien:
Trend Trader richten ihre Entscheidungen an der dominanten Marktrichtung aus und arbeiten häufig mit Indikatoren wie gleitenden Durchschnitten. Range Trader handeln innerhalb klar definierter Kursbereiche, indem sie nahe an Unterstützungsniveaus kaufen und an Widerstandszonen verkaufen. Breakout Trader konzentrieren sich auf Ausbrüche aus solchen Spannen oder Chartmustern, in der Erwartung, dass sich eine neue starke Bewegung ergibt.
Zins- und fundamentale Strategien:
Carry Trader nutzen Zinsdifferenzen zwischen zwei Währungen und halten Positionen meist über längere Zeiträume. Position Trader orientieren sich an fundamentalen Marktentwicklungen und langfristigen Trends und halten Positionen über Wochen oder Monate. News Trader handeln kurzfristige Schwankungen, die durch wirtschaftliche Veröffentlichungen und Nachrichten entstehen.
Alle Strategien können durch technische und fundamentale Analysen unterstützt werden. Charts, Indikatoren und historische Muster helfen dabei, Kursbewegungen einzuordnen und Handelsentscheidungen strukturierter zu treffen.
Vorteile des Forex-Tradings
1. Rund-um-die-Uhr-Handel
Der Devisenmarkt gehört zu den flexibelsten und liquidesten Finanzmärkten weltweit. Er ist an Werktagen rund um die Uhr geöffnet, was Tradern die Möglichkeit gibt, jederzeit auf Marktbewegungen zu reagieren. Diese kontinuierliche Verfügbarkeit ist besonders relevant, weil wichtige wirtschaftliche Ereignisse, politische Entscheidungen oder Datenveröffentlichungen zu unterschiedlichen Zeiten stattfinden und unmittelbare Auswirkungen auf Währungen haben können.
2. Hohe Liquidität
Ein wesentlicher Vorteil des Forex-Marktes ist seine hohe Liquidität. Allein die großen Währungspaare wie EUR/USD oder USD/JPY werden täglich in enormem Umfang gehandelt. Das weltweite Handelsvolumen liegt laut Bank for International Settlements bei über sieben Billionen US-Dollar pro Tag. Dadurch lassen sich Positionen in der Regel schnell und zu wettbewerbsfähigen Preisen eröffnen und schließen. Preisbewegungen sind meist stabiler, und die Gefahr großer Kurslücken ist geringer als in weniger liquiden Märkten.
3. Leverage (Hebelwirkung)
Forex-Trading ermöglicht zudem den Einsatz von Leverage. Mit Hebelwirkung lassen sich größere Positionen mit vergleichsweise geringem Einsatz steuern. Das erhöht die Kapitaleffizienz und eröffnet zusätzliche Handelsmöglichkeiten. Gleichzeitig erfordert Leverage jedoch ein verantwortungsbewusstes Risikomanagement, da sowohl Gewinne als auch Verluste verstärkt werden können.
4. Große Auswahl an Währungspaaren
Trader profitieren außerdem von einer breiten Auswahl an handelbaren Währungspaaren. Majors wie EUR/USD oder GBP/USD bieten besonders gute Handelsbedingungen, während Minor- und exotische Paare zusätzliche Diversifikationsmöglichkeiten bieten und regionale Marktentwicklungen widerspiegeln.
5. Niedrige Transaktionskosten & einfache Zugänglichkeit
Zu den weiteren Vorteilen gehören niedrige Handelskosten. Da viele Transaktionen über die Spreads abgewickelt werden, fallen häufig keine zusätzlichen Kommissionen an. Der Zugang ist ebenfalls unkompliziert, da moderne Handelsplattformen wie TradingView, MetaTrader oder cTrader benutzerfreundliche Oberflächen und Werkzeuge für Analyse und Risikomanagement bereitstellen.
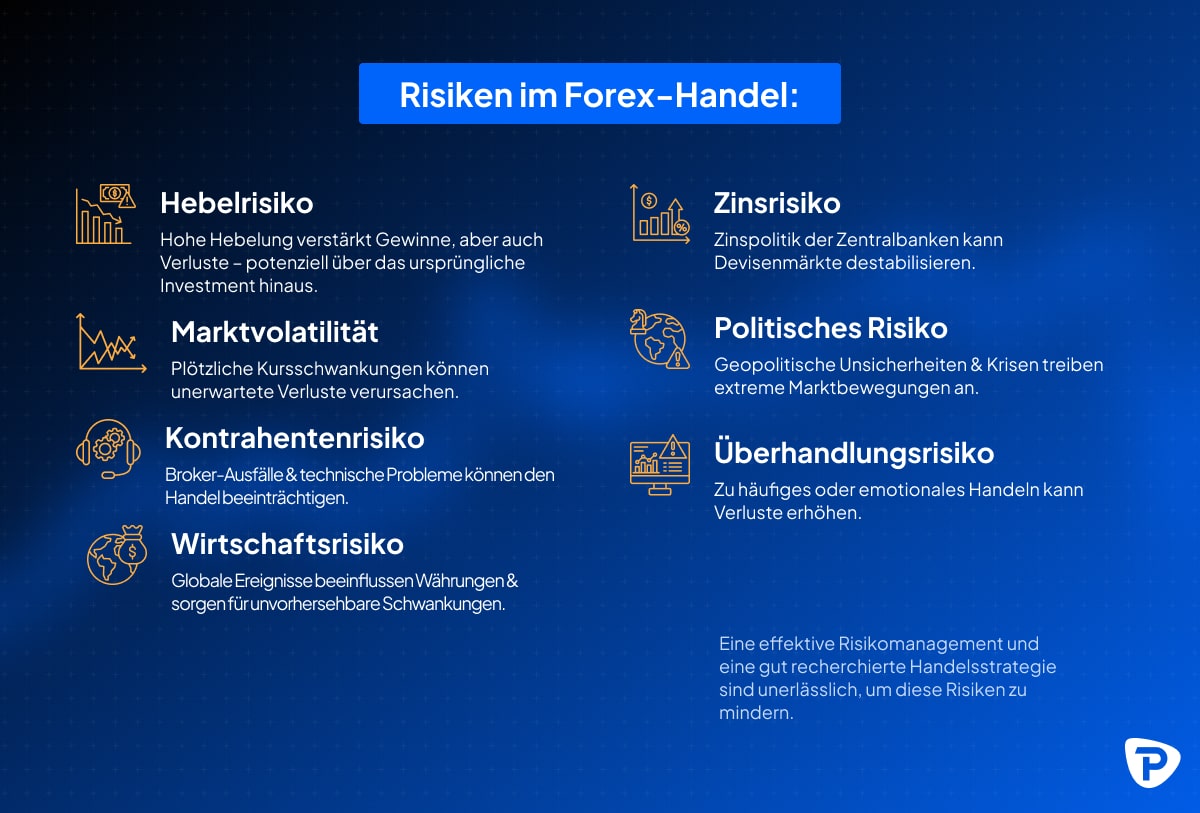
Risiken des Forex-Tradings
Forex-Trading kann profitabel sein, bringt aber verschiedene Risiken mit sich, die Trader kennen und kontrollieren müssen.
1. Hebelrisiko
Besonders relevant ist das Hebelrisiko. Durch den Einsatz von Leverage kann bereits eine kleine Marktbewegung große Auswirkungen auf das Ergebnis einer Position haben. Ohne klar definierte Stop-Loss-Strategie kann der Verlust das eingesetzte Kapital übersteigen.
2. Marktvolatilität
Der Devisenmarkt ist zudem anfällig für plötzliche Volatilität. Wichtige Wirtschaftsdaten, unerwartete politische Ereignisse oder Marktstimmungen können innerhalb von Sekunden starke Kursbewegungen auslösen. In solchen Phasen ist Vorsicht geboten, denn schnelle Marktbewegungen können Fehlentscheidungen begünstigen oder bestehende Positionen unerwartet beeinflussen.
3. Kontrahenten- oder Infrastrukturrisiko
Ein weiteres Risiko entsteht durch die Abhängigkeit von Handelsinfrastrukturen. Wenn Märkte außergewöhnlich volatil sind, kann es bei Brokern zu technischen Verzögerungen, Ausführungsschwierigkeiten oder eingeschränkter Liquidität kommen. Diese Faktoren können sich auf die Ausführungspreise auswirken.
4. Wirtschaftsrisiko
Währungen reagieren stark auf globale Wirtschaftsereignisse, die teilweise schwer vorhersehbar sind. Dazu gehören Zinsentscheidungen, Inflationsdaten oder geopolitische Entwicklungen. Änderungen in der Geldpolitik großer Zentralbanken können direkte und starke Effekte auf Wechselkurse und Marktstabilität haben.
Auch das politische Risiko spielt eine Rolle. Ereignisse wie Wahlen, Konflikte oder regulatorische Maßnahmen können die Märkte abrupt bewegen und zu ungeplanten Verlusten führen.
5. Verhaltens- und Überhandlungsrisiko
Ein häufig unterschätztes Risiko betrifft das eigene Verhalten. Übermäßiges Handeln oder das Treffen emotionaler Entscheidungen können zu Verlustserien führen. Ein klarer Handelsplan und ein strukturiertes Risikomanagement sind daher unerlässlich, um diese Risiken zu reduzieren.
Ein fundiertes Risikomanagement, eine klare Strategie und der bewusste Umgang mit Hebelwirkung sind entscheidend, um nachhaltig im Forex-Trading erfolgreich zu handeln.
Was bewegt den Forex-Markt?
Der Forex-Markt reagiert auf eine Reihe zentraler makroökonomischer, politischer und marktspezifischer Faktoren. Diese Einflüsse bestimmen Angebot und Nachfrage einer Währung und damit ihre Preisentwicklung.
Wirtschaftsindikatoren
Makrodaten wie das Bruttoinlandsprodukt, Beschäftigungszahlen, Inflationsraten, Einkaufsmanagerindizes und Produktionsdaten beeinflussen Währungen direkt. Eine starke konjunkturelle Entwicklung führt häufig zu Kapitalzuflüssen und stärkt die Währung. Schwache Daten führen dagegen oft zu Abwertungsdruck.
Zentralbankpolitik und Zinssätze
Die Entscheidungen von Zentralbanken zählen zu den stärksten Preistreibern im Währungsmarkt. Änderungen der Leitzinsen, geldpolitische Kommunikation, Anleihekäufe oder quantitative Lockerungsprogramme können den Wert einer Währung erheblich beeinflussen. Höhere Zinsen ziehen ausländisches Kapital an und unterstützen die Währung. Niedrigere Zinsen können den Wert schwächen.
Geopolitische Ereignisse
Politische Stabilität, Wahlen, Konflikte oder wirtschaftspolitische Entscheidungen können starke, oft abrupte Marktbewegungen auslösen. Ein Beispiel ist der Brexit. Die Entscheidung des Vereinigten Königreichs, die Europäische Union zu verlassen, führte über Jahre hinweg zu hoher Volatilität im britischen Pfund, da politische Verhandlungen und Unsicherheiten laufend die Erwartungen der Marktteilnehmer veränderten.
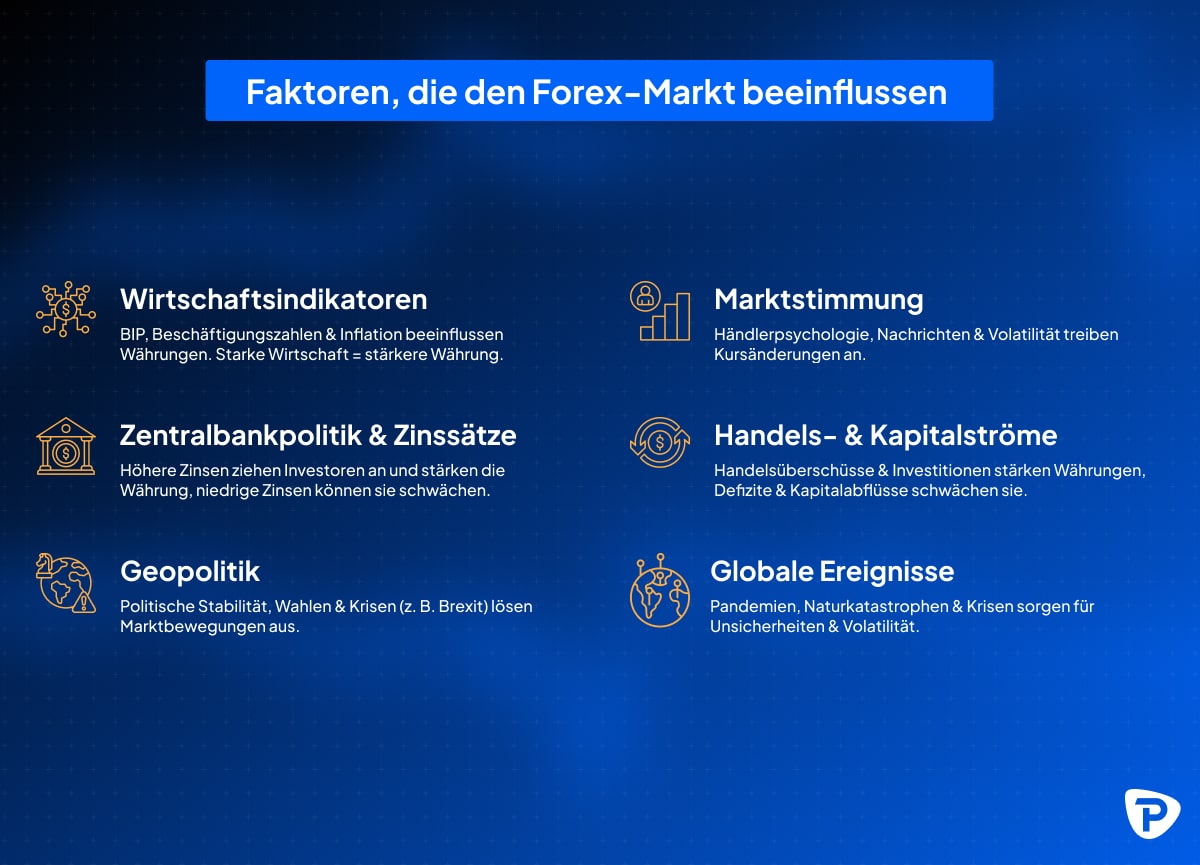
Marktstimmung
Emotionale Faktoren, Risikoappetit oder Risikoaversion beeinflussen viele kurzfristige Bewegungen. Bei starker Risikoaversion fließt Kapital häufig in sichere Währungen wie den US-Dollar oder den japanischen Yen. Positive Marktstimmung stärkt dagegen risikoreichere Währungen oder Carry-Trade-Paare.
Handels- und Kapitalströme
Handelsbilanzen, Direktinvestitionen und Kapitalzuflüsse aus dem Ausland wirken langfristig auf Währungswerte. Ein Handelsüberschuss erhöht die Nachfrage nach der Währung eines Landes und unterstützt ihren Kurs. Ein Defizit kann Druck auslösen. Hohe Direktinvestitionen stärken ebenfalls oft den Wechselkurs, während Kapitalabflüsse eine Abwertung fördern.
Globale Ereignisse
Naturkatastrophen, Pandemien und internationale Schocks beeinflussen Liquidität und Risikobereitschaft. Während der Covid-19-Pandemie kam es zu außergewöhnlicher Volatilität. Sicher wahrgenommene Währungen wie US-Dollar und Yen wurden kurzfristig stärker, während andere aufgrund von Unsicherheiten und wirtschaftlichen Einbrüchen unter Druck standen. Die geldpolitischen Maßnahmen der Zentralbanken prägten anschließend einen großen Teil der Währungsbewegungen.
Was sind die grundlegenden Forex-Signale?
Forex-Signale sind Hinweise oder Indikatoren, die dabei helfen, mögliche Handelschancen zu erkennen. Eine Grundlage bilden gleitende Durchschnitte, die Kursdaten glätten und zeigen, ob ein Markt eher steigt oder fällt. Werden kürzere und längere Durchschnitte miteinander verglichen, können Trendwechsel sichtbar werden.
RSI und MACD
Der Relative Strength Index (RSI) misst die Stärke von Kursbewegungen und zeigt an, ob ein Markt überkauft oder überverkauft sein könnte. Der MACD kombiniert Trendanalyse und Momentum, indem er die Beziehung zweier gleitender Durchschnitte beobachtet und mögliche Trendwechsel sichtbar macht.
Bollinger Bänder
Bollinger Bänder geben Auskunft über die Marktvolatilität. Breite Bänder deuten auf starke Schwankungen hin, während schmale Bänder auf ruhige Marktphasen schließen lassen. Berührt der Kurs die äußeren Bänder, kann das ein Hinweis auf Übertreibungen oder bevorstehende Trendbewegungen sein.
Trendlinien und Unterstützungs- und Widerstandsniveaus
Trendlinien unterstützen die Analyse, indem sie wiederkehrende Hoch- oder Tiefpunkte verbinden und damit die Richtung eines Trends hervorheben. Unterstützungs- und Widerstandsniveaus markieren Preisbereiche, an denen ein Markt historisch nicht weiter gefallen oder gestiegen ist. Diese Zonen werden genutzt, um potenzielle Wendepunkte zu identifizieren.
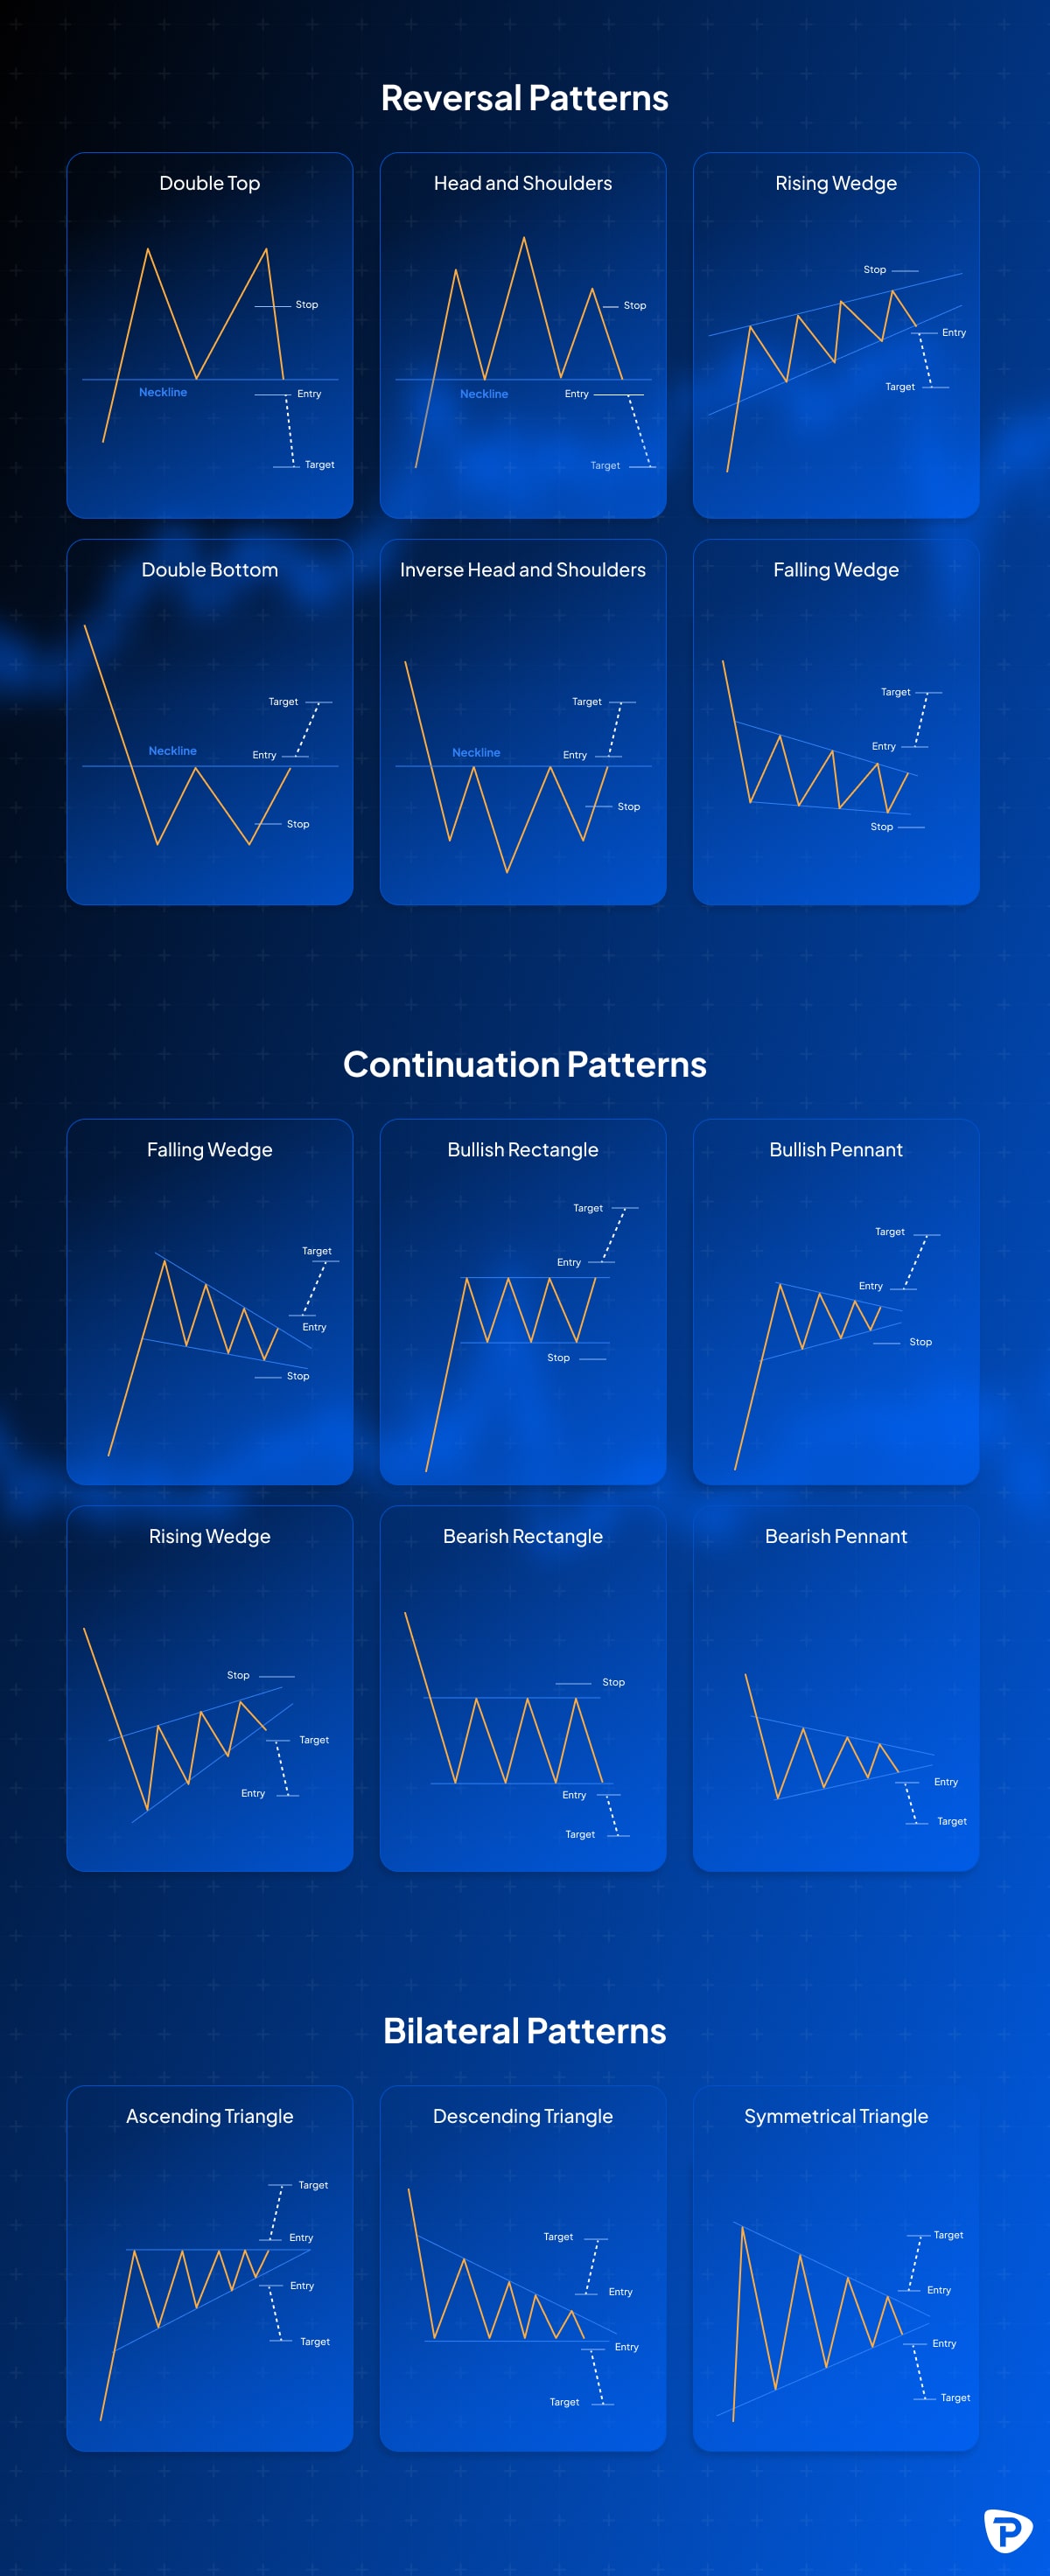
Chartmuster
Chartmuster wie Kopf und Schultern, Dreiecke oder Doppelböden können Hinweise auf Fortsetzungen oder Umkehrungen geben. Solche Muster helfen dabei, Kursverläufe besser einzuordnen und mögliche Einstiegs- oder Ausstiegsbereiche zu erkennen.
Wie fange ich mit dem Forex-Trading an?
Ein strukturierter Einstieg in den Forex-Handel hilft, Risiken zu kontrollieren und Handelsentscheidungen fundiert zu treffen.
1.Grundlagen verstehen
Der Einstieg beginnt mit der Vermittlung von Wissen. Dazu gehören die Funktionsweise des Forex-Marktes, die wichtigsten Begriffe, Analyseformen und Handelsstrategien.
2.Einen geeigneten Broker wählen
Ein zuverlässiger, regulierter Broker, wie Pepperstone, ist entscheidend. Wichtige Kriterien sind Spreads, Ausführungsgeschwindigkeit, Plattformangebot, Regulierung und Bewertungen durch unabhängige Quellen.
3.Handelskonto eröffnen
Nach der Auswahl wird ein Konto eröffnet. Händler wählen den Kontotyp, der zu ihrem Handelsstil, ihrem Kapital und ihrer Erfahrung passt. Am besten beginnen Sie mit einem Demokonto und üben verschiedene Forex-Trading-Strategien ohne Risiko mit virtuellem Geld.
4.Einzahlung vornehmen
Eine angemessene Einzahlung ist notwendig, um Positionen zu eröffnen. Sie sollte dem persönlichen Risikoprofil entsprechen.
5.Handelsplattform herunterladen
Plattformen wie MetaTrader 4, MetaTrader 5, cTrader oder TradingView bieten Charting-Werkzeuge, Orderfunktionen und Marktdaten für die Analyse und Ausführung.
6.Einen Handelsplan entwickeln
Ein Handelsplan sollte klare Regeln enthalten. Dazu gehören:
- bevorzugte Währungspaare
- Einstiegs- und Ausstiegskriterien
- Risiko- und Money-Management
- Zeitrahmen und Analyseansatz
Ein solcher Plan unterstützt Disziplin und reduziert emotionale Entscheidungen.
7.Positionen überwachen und anpassen
Aktives Monitoring von Trades, Nachrichten und Marktbedingungen ist wichtig. Marktveränderungen können Anpassungen der Strategie notwendig machen.
Forex-Trading FAQs
Was sind Basis- und Notierungswährungen?
In jedem Forex-Paar gibt es zwei Währungen mit klar definierten Rollen. Die Basiswährung ist die erste aufgeführte Währung. Sie ist die Währung, die im Handel gekauft oder verkauft wird. Die Notierungswährung ist die zweite Währung. Sie zeigt an, wie viel von ihr benötigt wird, um eine Einheit der Basiswährung zu kaufen.
Beispiele:
- EUR/USD: Euro ist die Basiswährung, US-Dollar die Notierungswährung. Notiert das Paar bei 1,1100, entspricht das einem Gegenwert von 1 Euro = 1,11 US-Dollar.
- USD/JPY: US-Dollar ist die Basiswährung, japanischer Yen die Notierungswährung. Ein Kurs von 144,00 bedeutet: 1 US-Dollar = 144 Yen.
Das Verständnis dieser Struktur ist entscheidend, da jede Kursbewegung Gewinne oder Verluste immer in Bezug auf die Notierungswährung widerspiegelt.
Wird Forex-Trading rund um die Uhr betrieben?
Der Forex-Markt ist an fünf Tagen pro Woche durchgehend geöffnet. Der Handel beginnt am Montagmorgen mit der Öffnung der Finanzmärkte in Sydney und läuft ohne Unterbrechung über Tokio, London und New York bis Freitagabend. Durch diese Abfolge globaler Handelsplätze entsteht ein kontinuierlicher Markt, der Tradern flexible Handelszeiten und Reaktionsmöglichkeiten über verschiedene Zeitzonen hinweg bietet.
Welche sind die meistgehandelten Währungspaare?
Die meistgehandelten Währungspaare sind die sogenannten Majors. Sie bestehen immer aus dem US-Dollar und einer weiteren großen Wirtschaftswährung. Zu den weltweit am häufigsten gehandelten Paaren gehören EUR/USD, USD/JPY, GBP/USD, AUD/USD, USD/CAD, USD/CHF und NZD/USD. Diese Paare dominieren das globale Handelsvolumen, weil sie besonders liquide sind, enge Spreads bieten und stark von makroökonomischen Daten der größten Wirtschaftsräume bewegt werden.
Was macht ein Forex-Broker?
Ein Forex-Broker stellt den Zugang zum Devisenmarkt bereit und ermöglicht die Ausführung von Kauf- und Verkaufsaufträgen. Zu seinen Aufgaben gehört die Bereitstellung einer Handelsplattform, über die Marktpreise, Charts und technische Werkzeuge zugänglich sind. Zudem stellt er Hebelwirkung bereit, die es ermöglicht, mit einem geringeren Kapitaleinsatz größere Positionen zu kontrollieren.
Ein Broker verdient in der Regel über Spreads oder Provisionen und sorgt gleichzeitig für die Kontoverwaltung, einschließlich Einzahlungen, Auszahlungen und technischer Einstellungen. Zusätzlich werden Marktdaten, Analysewerkzeuge und Schulungsmaterialien bereitgestellt, damit Trader Märkte besser einschätzen und Handelsentscheidungen fundiert vorbereiten können. Ein kompetenter Kundensupport unterstützt bei Fragen zur Plattform oder bei operativen Herausforderungen im Handel.
Wie viel verdient ein Forex-Trader?
Es gibt keine verlässliche allgemeingültige Zahl dazu, wie viel ein Forex-Trader verdient. Die Ergebnisse hängen stark vom Kapital, der Handelsstrategie, der Erfahrung, der Disziplin und der Risikosteuerung ab. Viele Trader erzielen in den ersten Jahren keine stabilen Gewinne. Der Forex-Markt bietet Chancen, aber auch hohe Risiken, sodass sowohl Gewinne als auch Verluste möglich sind. Offizielle Durchschnittswerte werden nicht veröffentlicht und können deshalb nicht angegeben werden.
Wie verdienen Forex-Händler Geld?
Forex-Händler erzielen Gewinne, indem sie Kursbewegungen zwischen zwei Währungen ausnutzen. Die häufigste Methode besteht darin, ein Währungspaar zu niedrigen Kursen zu kaufen und später zu höheren Kursen zu verkaufen. Wenn der Kurs wie erwartet steigt, entsteht ein Gewinn aus der Differenz zwischen Kauf- und Verkaufspreis. Entwickelt sich der Markt jedoch in die entgegengesetzte Richtung, kann die Position einen Verlust verursachen.
Auch Short-Positionen sind möglich. Dabei wird ein Währungspaar zu einem hohen Kurs verkauft und später zu einem niedrigeren Kurs zurückgekauft. Sinkt der Kurs wie erwartet, entsteht ein Gewinn. Steigt der Kurs hingegen an, kann der Rückkauf der Währung zu erheblichen Verlusten führen.
Hebelwirkung
Ein weiterer Gewinnfaktor ist die Hebelwirkung. Leverage ermöglicht es, mit wenig Kapital große Positionen zu kontrollieren. Das kann Gewinne verstärken, erhöht aber auch das Risiko eines schnellen Kapitalverlusts und kann bei starken Marktbewegungen zu Margin Calls führen.
Carry Trading
Beim Carry Trading nutzen Händler die Zinsdifferenz zwischen zwei Währungen. Wer eine Währung mit hohem Zinssatz kauft und eine mit niedrigem Zinssatz verkauft, profitiert von der laufenden Zinsdifferenz. Ändern sich jedoch Zinsen oder der Wechselkurs abrupt, kann die Strategie Verluste verursachen.
Arbitrage
Arbitrage spielt ebenfalls eine Rolle. Dabei werden Preisunterschiede desselben Währungspaares auf verschiedenen Märkten ausgenutzt. Da diese Unterschiede oft nur sehr kurz bestehen, können Transaktionskosten oder Ausführungsverzögerungen mögliche Gewinne reduzieren.
Swing Trading
Swing- und Trendtrader orientieren sich an der Marktstruktur und handeln in Richtung bestehender Trends oder möglicher Trendwechsel. Auch hier entstehen Gewinne, wenn der Markt sich wie erwartet entwickelt. Kehrt sich ein Trend jedoch plötzlich um, kann dies zu unerwarteten Verlusten führen.
Ist Forex-Trading für Anfänger geeignet?
Forex-Trading ist grundsätzlich auch für Anfänger zugänglich, da der Markt hohe Liquidität bietet und viele Broker Demokonten sowie Bildungsressourcen bereitstellen. Dennoch ist der Handel komplex und risikoreich. Besonders die Hebelwirkung kann zu schnellen Verlusten führen. Anfänger sollten deshalb mit kleinen Positionsgrößen beginnen, ein Demokonto nutzen und sich zunächst intensiv mit Risikomanagement, Marktmechanismen und grundlegender Analyse beschäftigen.
Ist Forex legal in Deutschland?
Ja, Forex-Trading ist in Deutschland legal. Anbieter, die ihre Dienstleistungen für deutsche Kunden erbringen, müssen von einer zugelassenen Aufsichtsbehörde reguliert sein, zum Beispiel von der BaFin oder einer anerkannten europäischen Behörde im Rahmen von MiFID II. Auch die Verwendung von Hebelprodukten wie CFDs ist erlaubt, jedoch gelten in der EU verbindliche Hebelbeschränkungen für Privatkunden.
Wie viel Geld brauche ich, um mit dem Forex-Handel zu beginnen?
Der benötigte Betrag hängt vom Broker, den Marginanforderungen und der eigenen Risikobereitschaft ab. Viele Broker erlauben bereits den Handel mit kleinen Konten, oft ab 100 Euro oder weniger. Sinnvoll ist jedoch ein Kapitalbetrag, der realistische Positionsgrößen und ein gesundes Risikomanagement ermöglicht. Wie viel das konkret ist, hängt davon ab, wie groß einzelne Positionen sein sollen und wie viel Risiko pro Trade akzeptiert wird. Es gibt keinen verpflichtenden Mindestbetrag, der für alle Trader gilt.
Kann ich mir Forex selbst beibringen?
Ja, viele Trader bringen sich Forex-Trading selbst bei. Es gibt umfangreiche Bildungsangebote wie Online-Kurse, Webinare, Marktanalysen, Videos, Bücher und Demokonten. Entscheidend ist, strukturiert zu lernen und Theorie mit praktischer Übung zu kombinieren. Risikomanagement und ein klarer Handelsplan sind zentral. Auch wenn Selbststudium möglich ist, ist es wichtig, realistisch zu bleiben und zu wissen, dass der Lernprozess Zeit und konsequente Übung erfordert.
Wichtige Forex-Terminologie
Die wichtigsten Begriffe für den Einstieg in den Forex-Handel sind:
- Position: Ein geöffneter Handel im Markt.
- Hebelwirkung (Leverage): Einsatz geliehener Mittel zur Kontrolle größerer Positionen.
- Margin: Kapital, das erforderlich ist, um eine gehebelte Position zu eröffnen und zu halten.
- Pip: Kleinste standardisierte Kursbewegung eines Währungspaares.
- Wechselkurs: Preis einer Währung gemessen an einer anderen.
- Basiswährung: Erste Währung im Paar, die gekauft oder verkauft wird.
- Notierungswährung: Zweite Währung im Paar, die den Preis der Basiswährung festlegt.
- Bid (Geldkurs): Preis, zu dem eine Währung verkauft werden kann.
- Ask (Briefkurs): Preis, zu dem eine Währung gekauft werden kann.
- Spread: Unterschied zwischen Bid und Ask.
- Majors: Die am häufigsten gehandelten Währungspaare, immer mit USD.
- Minors und Exotics: Paare ohne USD oder Paare mit einer Währung aus einer kleineren oder aufstrebenden Volkswirtschaft.
- Stop-Limit-Order: Order, die bei Erreichen eines bestimmten Preises aktiv wird, jedoch nur innerhalb eines Limits ausgeführt wird.
- Stop-Loss-Order: Order zur Begrenzung möglicher Verluste bei Erreichen eines festgelegten Preises.
Diese Information wurde von Pepperstone GmbH bereitgestellt. CFD sind komplexe Instrumente und beinhalten wegen der Hebelwirkung ein hohes Risiko, schnell Geld zu verlieren. 73,9 % der Kleinanlegerkonten verlieren Geld beim CFD-Handel mit diesem Anbieter. Sie sollten überlegen, ob Sie verstehen, wie CFD funktionieren und ob Sie es sich leisten können, das hohe Risiko einzugehen, Ihr Geld zu verlieren. Diese Inhalte stellen keine unabhängige Finanzanalyse dar, sondern gehören zu unserer Werbemitteilung. Folglich sind die gesetzlichen und regulatorischen Bestimmungen, die sich auf unabhängige Finanzanalysen beziehen, nicht auf diese Website und unsere Kommunikation anwendbar. Diese Inhalte (unabhängig davon, ob sie Meinungen wiedergeben oder nicht) dienen nur der allgemeinen Information und berücksichtigen Ihre persönlichen Umstände oder Ziele nicht. Obwohl die in dieser Werbemitteilung enthaltenen Informationen aus Quellen, welche als verlässlich betrachtet werden können, bezogen wurden, gewährleisten weder Pepperstone noch der Autor die Richtigkeit oder Vollständigkeit dieser Informationen. Alle Informationen sind nur indikativ, können ohne vorherige Mitteilung abgeändert werden und können jederzeit veraltet sein. Weder Pepperstone noch der Autor übernehmen Haftung für Verluste. Informationen über die frühere Wertentwicklung eines Finanzinstruments lassen keine verlässliche Schlussfolgerung auf die zukünftige Entwicklung zu. Die Rendite kann infolge von Währungsschwankungen steigen oder fallen kann.