CFD sind komplexe Instrumente und beinhalten wegen der Hebelwirkung ein hohes Risiko, schnell Geld zu verlieren.72.6% der Kleinanlegerkonten verlieren Geld beim CFD-Handel mit diesem Anbieter. Sie sollten überlegen, ob Sie verstehen, wie CFD funktionieren und ob Sie es sich leisten können, das hohe Risiko einzugehen, Ihr Geld zu verlieren.

XAUUSD – it’s the flow show!
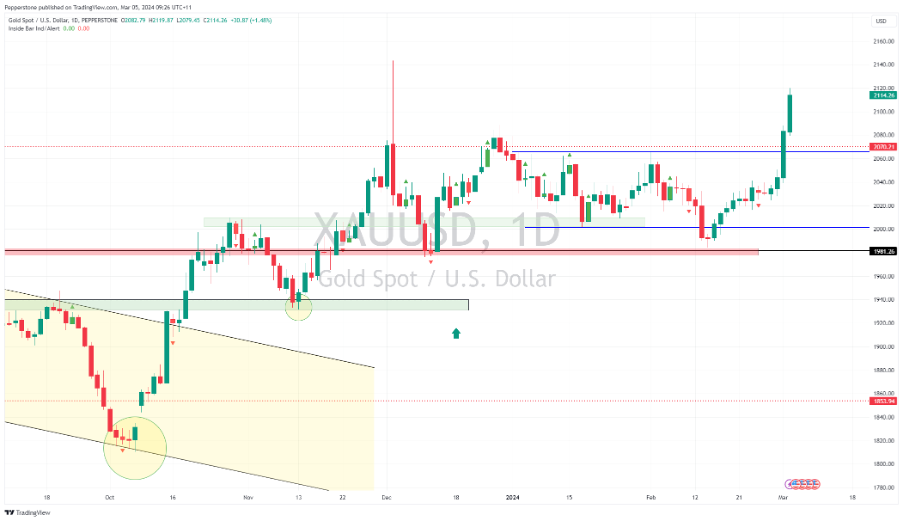
It’s one of those days where price has moved hard, and many try to put a fundamental reasoning behind the move – I’m not sure we can this time. On the day we’ve seen US Treasury yields rise across the curve, and while we saw a 20bp drop intraday in the DXY that certainly kept the wind to gold’s sails, nothing specifically justified a 1.5% rally in the yellow metal. Looking at the intraday tape of the gold futures we see the volumes ramped up on the break of Friday’s high of $2097.1. It seems that momentum players increased long exposures on the break. In the options market, traders have been big buyers of upside calls in the GLD ETF, at a time when we’ve started to see inflows into the ETF itself. The gold miners ETF (GDX) closed +4.3% on 48m shares traded. While the recent rally has been supported by US real rates, today’s move was seeming purely flows-based. Strength begets strength, as they say.
Upside resistance sits at $2139 – the long-term trend resistance – for the scalpers, this is a level to possibly lean against. By way of event risk, today’s US ISM services (02:00 AEDT) poses a risk to gold exposures, and with the consensus seeing the index at 53.0 (from 53.4), gold shorts will want to see an upside surprise that potentially causes bond yields and the USD to rise.
XAGUSD – base jumping
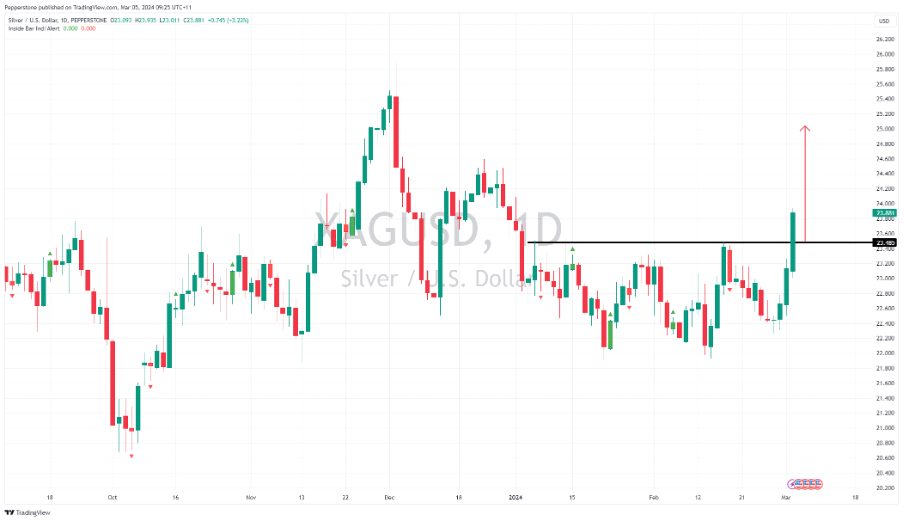
Given the rally in gold, it's no surprise that silver has rallied hard on similar dynamics. Having forged a range of $23.50 to $22.00, we’ve seen the price smash the topside of that range, which is also the double-bottom neckline – suggesting a technical target of $25. It's hard to chase at these levels, but too powerful to short. The net effect is that pullbacks should be shallow and should offer the potential opportunity to initiate new longs.
US2000 index – breakout or fade?
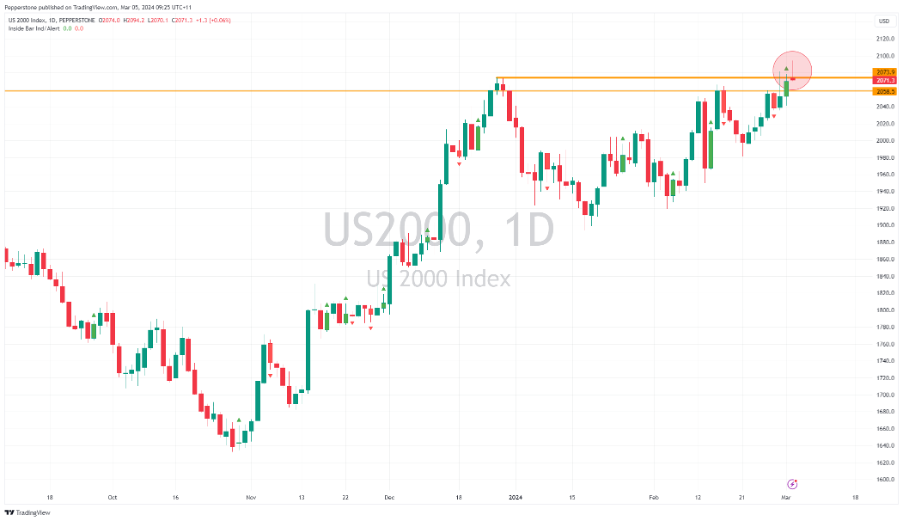
While all the attention has rightfully been on the NAS100, with Nvidia firing up once again, and the NAS100 holding the 18k level, we’ve also seen attention in the US2000 with the small cap index testing the range highs it held since May 2022. While many will be looking to act should we see a breakout and potential trending price action, many others will be looking to fade the move into these key highs. Those looking at short positions may also have noticed the inverted hammer candle on the daily, which could indicate a potential reversal. Subsequently, traders will be watching to see if price can take out the Monday’s lows of 2070.1 to confirm the bullish momentum has shifted.
Bitcoin – New highs a matter of when
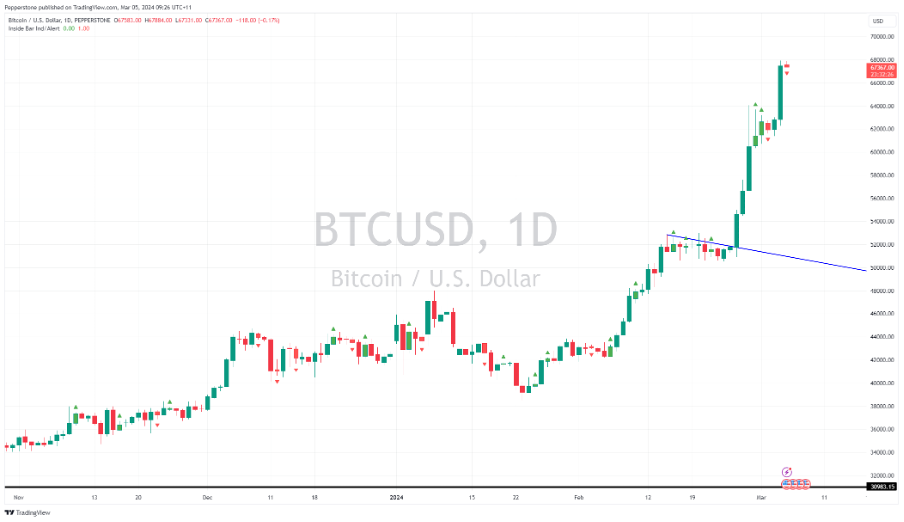
While we’ve seen some larger percentage daily changes in DOGE, Bitcoin has attracted good interest again on the long side. Intraday we’ve seen a solid tape with any pullback pounced on. Once again momentum-focused flows have pushed price into $68k with our all-time high price of $68,986 firmly in sight. Looking at the options market – as a gauge of sentiment – Coinglass data shows 15k contracts of calls at the 65k strike - so as price traded through the fixed strike, options dealers (who sold the calls) would have been hedging their exposure by buying the underlying Bitcoin, which in turn drives the price higher. Like gold, it’s been the flow show driving price action, with momentum-focused players influencing. It feels like the $68,986 all-time high will be a magnet, and it is a matter of time before we see headlines on new highs in Bitcoin.
GBPCHF – can it kick?
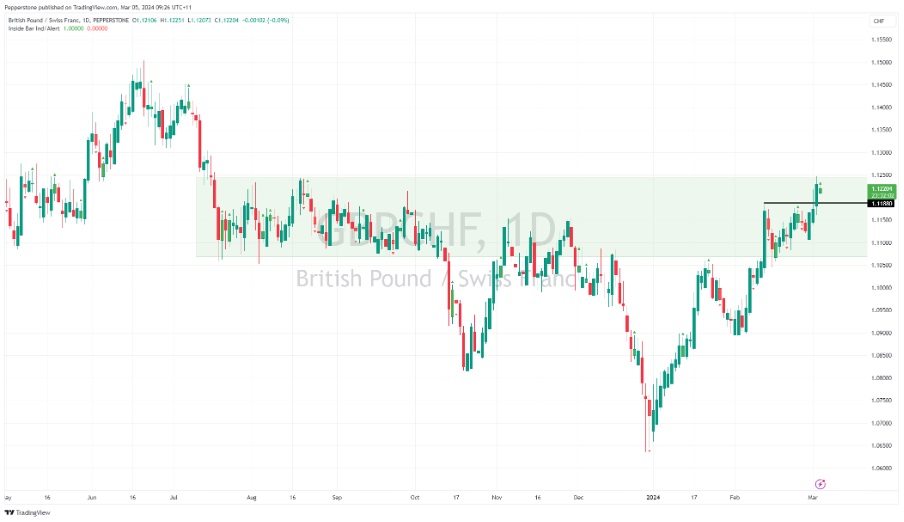
While CFD traders rarely get interested in a government budget, there is some conjecture on whether tomorrow's UK budget moves the dial on the GBP. It certainly feels a low probability that we get any knee-jerk reaction in price, especially with many of the policies speculated and reported on in the media. On the CHF side, yesterday’s Swiss CPI came in slightly above consensus at 1.2% and we’ve seen a small move in Swiss rates, with the implied probability of a 25bp cut in the upcoming SNB meeting (21 March) becoming a coin toss at 46% implied. Interestingly though we haven’t seen much in the way of buying in the CHF, and GBPCHF has been strong with a clear breakout above the 13 Jan highs. Price has pulled into the former range where it spent a large amount of time between July and September. A break of 1.1250 therefore should encourage further long positioning.
Related articles


Diese Inhalte stellen keine unabhängige Finanzanalyse dar, sondern gehören zu unserer Werbemitteilung. Folglich sind die gesetzlichen und regulatorischen Bestimmungen, die sich auf unabhängige Finanzanalysen beziehen, nicht auf diese Website und unsere Kommunikation anwendbar. Diese Inhalte (unabhängig davon, ob sie Meinungen wiedergeben oder nicht) dienen nur der allgemeinen Information und berücksichtigen Ihre persönlichen Umstände oder Ziele nicht. Die Inhalte unserer Webseite und unserer Kommunikation sind nicht als Finanzberatung, Anlageberatung oder andere verlässliche Beratung gedacht und dürfen auch nicht als solche betrachtet werden. Keine auf der Website wiedergegebene Meinung stellt eine Empfehlung seitens Pepperstone oder seitens des Autors dar, nach der eine bestimmte Anlage, Transaktion oder Anlagestrategie oder ein bestimmtes Wertpapier für eine bestimmte Person geeignet wäre.
Obwohl die in dieser Werbemitteilung enthaltenen Informationen aus Quellen, welche als verlässlich betrachtet werden können, bezogen wurden, gewährleisten weder Pepperstone noch der Autor die Richtigkeit oder Vollständigkeit dieser Informationen. Alle Informationen sind nur indikativ, können ohne vorherige Mitteilung abgeändert werden und können jederzeit veraltet sein. Weder Pepperstone noch der Autor übernehmen Haftung für Verluste, welche Sie entweder direkt oder indirekt durch eine Anlageentscheidung, die Sie auf Grundlage einer auf dieser Webseite enthaltenen Informationen getroffen haben, erleiden. Diese Website kann Graphiken enthalten, die frühere Wertentwicklung eines Finanzinstruments und/oder Schätzungen und Prognosen abbilden. Informationen über die frühere Wertentwicklung eines Finanzinstruments lassen keine verlässliche Schlussfolgerung auf die zukünftige Entwicklung zu.