CFD sind komplexe Instrumente und beinhalten wegen der Hebelwirkung ein hohes Risiko, schnell Geld zu verlieren.72.6% der Kleinanlegerkonten verlieren Geld beim CFD-Handel mit diesem Anbieter. Sie sollten überlegen, ob Sie verstehen, wie CFD funktionieren und ob Sie es sich leisten können, das hohe Risiko einzugehen, Ihr Geld zu verlieren.

EURUSD – a grind in 1.0900
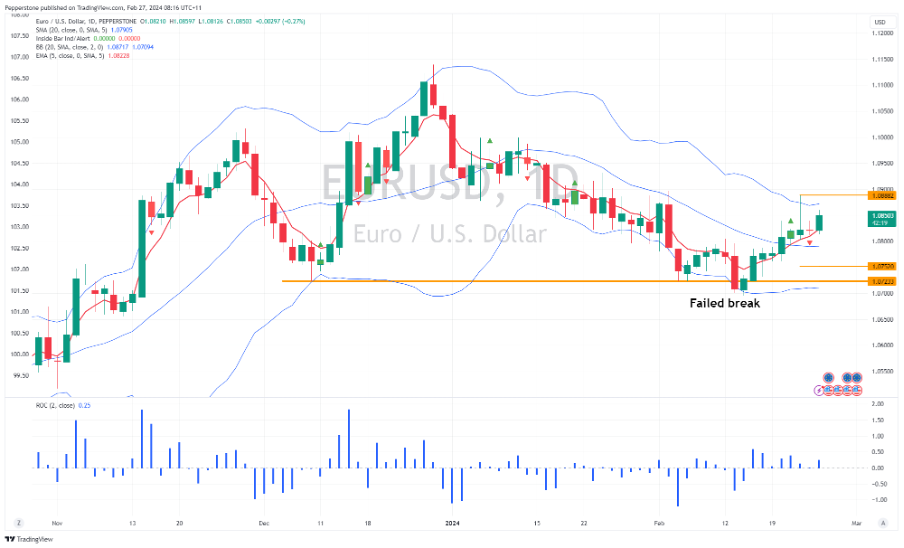
While a sell-off in US Treasuries (the US 10yr Treasury is currently +4bp at 4.28%) has offered support to the USD, we’ve also seen increased selling in German and EU govt bonds - the net result has been EURUSD tracking closely to the German-US bond yield differential. Let’s call this a relative value trade in play, but while low volatility is front and centre across FX markets, the buyers are driving price higher, and we see a series of higher highs and lows from the 14 Feb lows. Given the 20-day MA tracks sideways, I would look for the top Bollinger Band and 22 Feb spike high of 1.0882 to cap the upside and provide a level for mean reversion-focused traders to eye shorts positions.
AUDNZD – a tactical opportunity in play
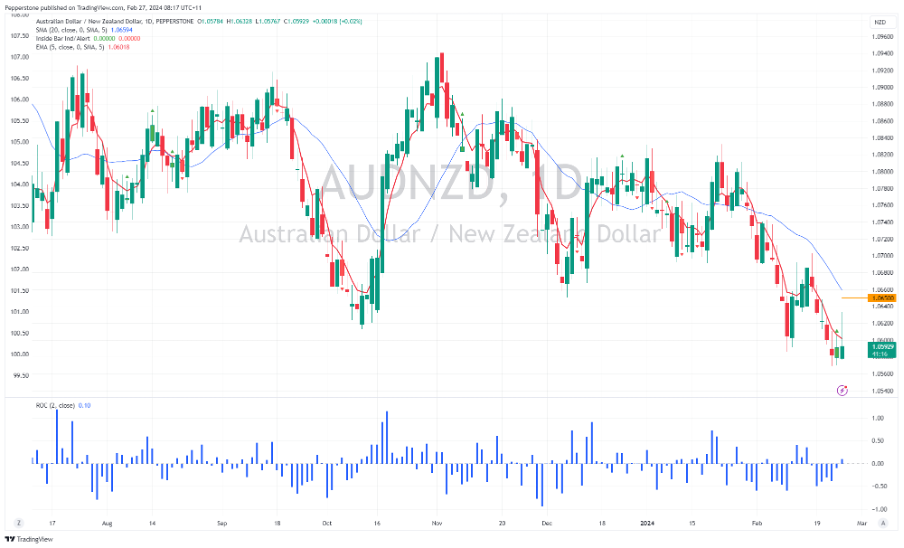
Short AUDNZD has become a strong consensus position within the leverage FX community, with the cross-rate at the lowest levels since May 2023. In fact, long NZD positions are well-owned across the G10 FX complex. There are two near-term event risks which could impact both currencies, with Aus monthly CPI (due today at 11:30 AEDT) and the RBNZ meeting (due Wed at 12:00 AEDT) in play.
Aussie CPI could cause a small move in the AUD, obviously dependent on the outcome of the data (the market looks for headline CPI to come in at 3.6% vs 3.4% previously). It’s the RBNZ meeting which interests more though, as this could cause a solid move in the NZD across the board. NZ swaps price around 20% chance of a 25bp hike, with 20/22 economists calling for the cash rate to remain at 5.5%. Given rich NZD positioning and the current rates pricing, if we see the RBNZ leave the cash rate on hold it may cause immediate NZD selling, although the commentary will likely lean hawkish (let's call it a hawkish hold) which could feasibly see pullbacks in the NZD well supported. Naturally, a 25bp hike would promote a solid rally although this outcome is given a low probability. I am seldom one to advocate trading a central bank meeting in isolation, but I see the risk skewed for a higher AUDNZD on the statement. That said, the effects could be short-lived and I therefore hold a preference to fade any initial strength and will look to leave tactical short AUDNZD limits into 1.0650.
MXNJPY – A classic low volatility beneficiary
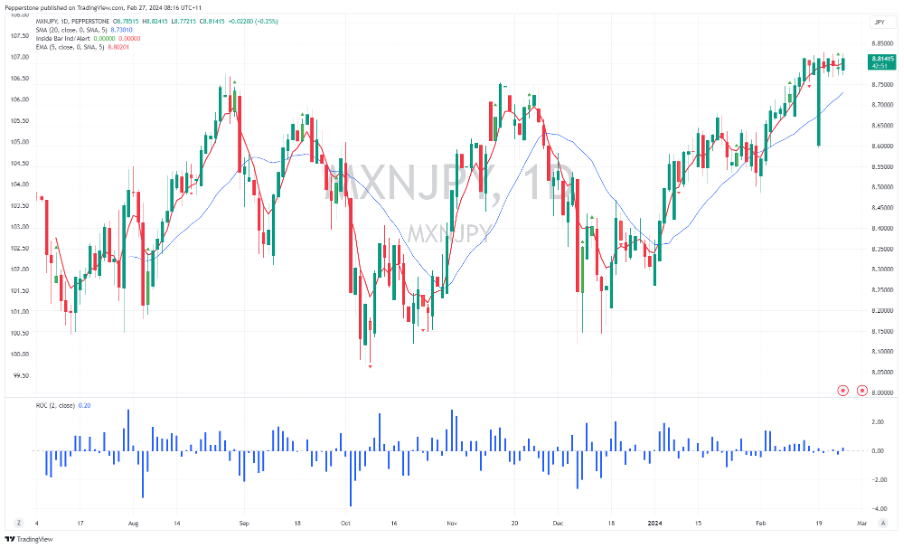
Trading breakouts can be a fine art, one where we can take the trade but be prepared to cover longs quickly, knowing that failed breaks can often be powerful reversal signals in themselves. MXNJPY comes up on the radar as a tactical play given the incredibly low realised and implied volatility in FX markets, which typically sees hedge funds rush to deploy carry (income) strategies – buying the higher-yielding MXN and funding it with short JPY positions. We can see on the higher timeframes that MXNJPY has been testing a breakout point of 8.8300 for a number of days and typically the longer the consolidation plays out the more powerful the move is likely to be. Consider that in play today we get Japan National CPI (due 10:30 AEDT) and weaker numbers could see modest JPY weakness. There is also data from Mexico this week (trade balance, quarterly inflation report, unemployment rate), which matters given that Banxico’s recent minutes suggested they are open to a cut in the March meeting – a factor curbing the emphasis to push price through 8.8300. With carry outperforming in a low vol FX world set alerts for a potential breakout.
SpotCrude – delicately poised to breakout
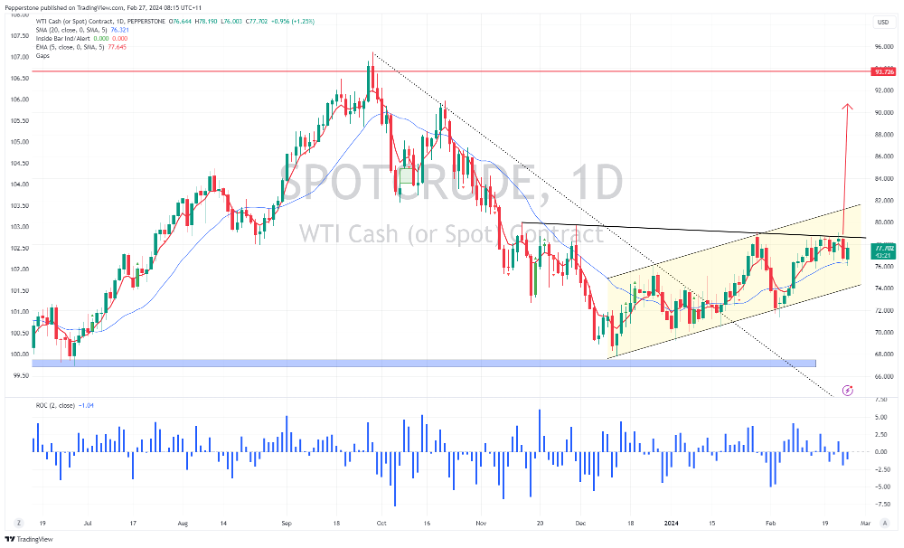
On the daily timeframe, we see price working in a bullish channel and currently sitting mid-range. We also see downtrend resistance drawn from the 14 November highs and the neckline of the inverse Head and shoulders curbing the upside – a closing break here takes the price into channel highs of $81.10 and potentially even targeting $90 over time. Should the break eventuate, there will likely be increased discussion as to what levels crude become more problematic for risk given the impact it has on headline inflation. I would argue that level is closer to $90, but it would also need to play out when the February US CPI data is released (12 March), and conditionally on seeing another hot core print above 0.35%+ MoM.
Tesla – ready to fill the gap
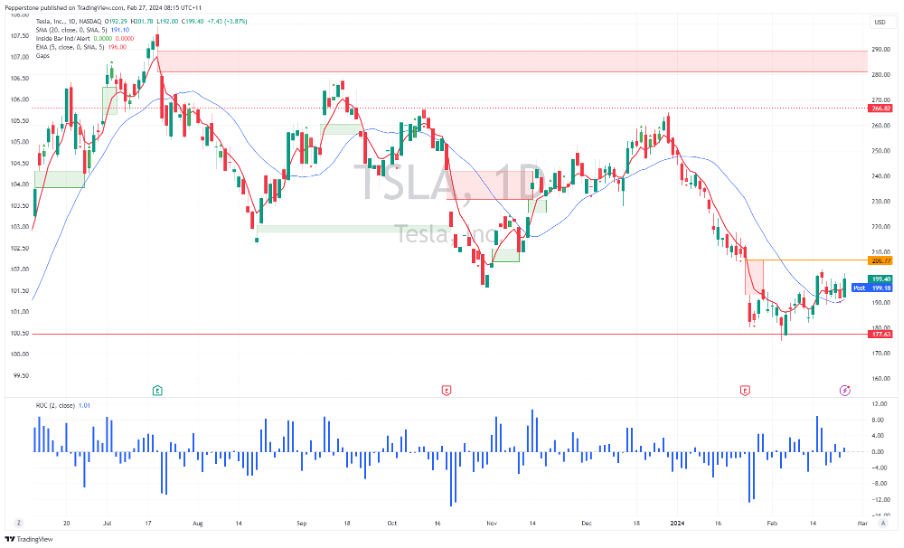
While all the attention has been on Nvidia and Super Micro Computers – both in terms of cash equity and options volumes – Tesla is going about its business and putting in a solid base after the 33% drawdown through Dec to Feb. Options traders are increasing exposures towards bullish upside calls, which are typically a good gauge of sentiment and a potential ensuing momentum move. The bulls will be focusing on $206.77 (the 24 Jan low), which if tested would see price fill the gap – in turn, gaining attention from scalpers looking to lean short into the level. Gaps are there to be filled, but it's how price reacts after filled that can be very powerful.
Related articles


Diese Inhalte stellen keine unabhängige Finanzanalyse dar, sondern gehören zu unserer Werbemitteilung. Folglich sind die gesetzlichen und regulatorischen Bestimmungen, die sich auf unabhängige Finanzanalysen beziehen, nicht auf diese Website und unsere Kommunikation anwendbar. Diese Inhalte (unabhängig davon, ob sie Meinungen wiedergeben oder nicht) dienen nur der allgemeinen Information und berücksichtigen Ihre persönlichen Umstände oder Ziele nicht. Die Inhalte unserer Webseite und unserer Kommunikation sind nicht als Finanzberatung, Anlageberatung oder andere verlässliche Beratung gedacht und dürfen auch nicht als solche betrachtet werden. Keine auf der Website wiedergegebene Meinung stellt eine Empfehlung seitens Pepperstone oder seitens des Autors dar, nach der eine bestimmte Anlage, Transaktion oder Anlagestrategie oder ein bestimmtes Wertpapier für eine bestimmte Person geeignet wäre.
Obwohl die in dieser Werbemitteilung enthaltenen Informationen aus Quellen, welche als verlässlich betrachtet werden können, bezogen wurden, gewährleisten weder Pepperstone noch der Autor die Richtigkeit oder Vollständigkeit dieser Informationen. Alle Informationen sind nur indikativ, können ohne vorherige Mitteilung abgeändert werden und können jederzeit veraltet sein. Weder Pepperstone noch der Autor übernehmen Haftung für Verluste, welche Sie entweder direkt oder indirekt durch eine Anlageentscheidung, die Sie auf Grundlage einer auf dieser Webseite enthaltenen Informationen getroffen haben, erleiden. Diese Website kann Graphiken enthalten, die frühere Wertentwicklung eines Finanzinstruments und/oder Schätzungen und Prognosen abbilden. Informationen über die frühere Wertentwicklung eines Finanzinstruments lassen keine verlässliche Schlussfolgerung auf die zukünftige Entwicklung zu.