Some basic information about VAS ASX
The VAS ASX ETF stands for Vanguard Australian Shares Index Exchange Traded Fund. It looks to track the performance of the S&P/ASX300 Index.
It provides a low-cost entry, offering exposure to Australian companies and property trusts.
Vanguard suggests it is suitable for long-term buy and hold investors looking for capital growth with some tax efficient benefits.
Launched in 2009, VAS ASX had a stellar performance from the 2020 lows of 56.28 to the high of 97.92 in March 2022. A rally of +74%.
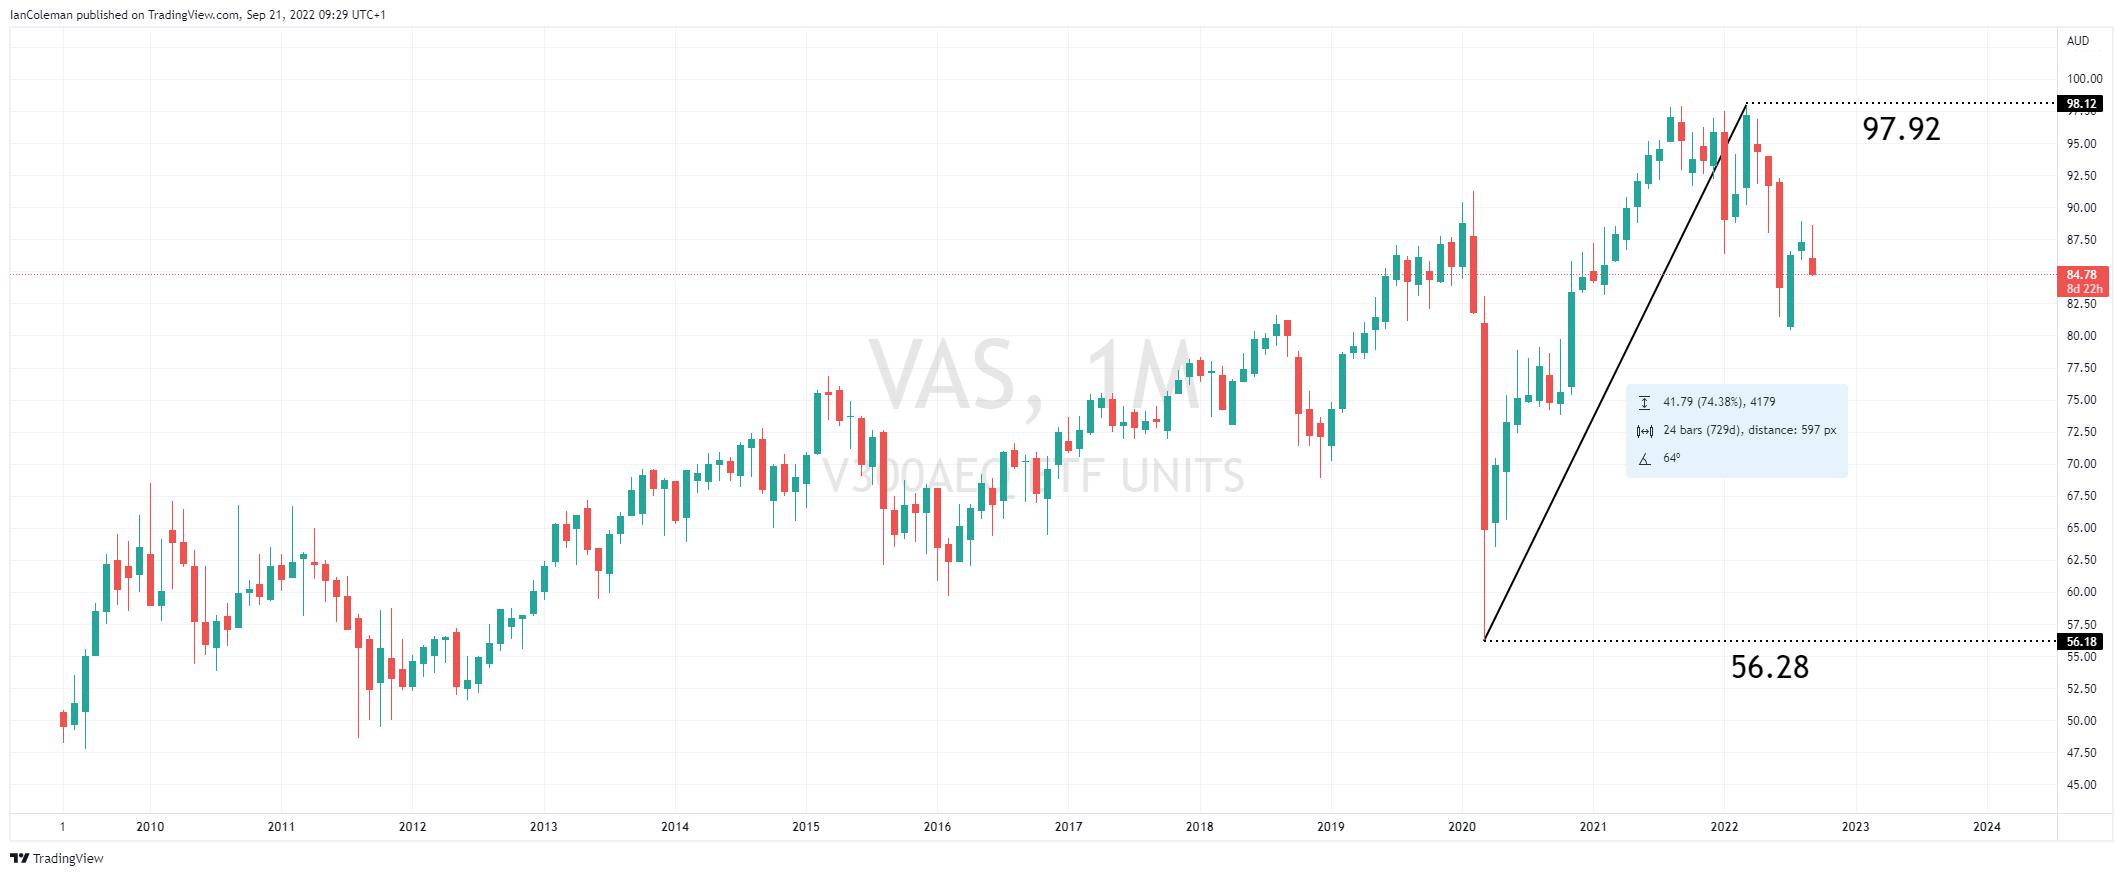
Figure 1 Trading View VAS ASX 2020 rally
A look from a technical perspective
A look at the weekly chart from a technical perspective and the fund posted a double top formation. This was confirmed on a break of the swing low 86.35, the 24th of January base. The measured move target for the double top pattern is located at 74.35.
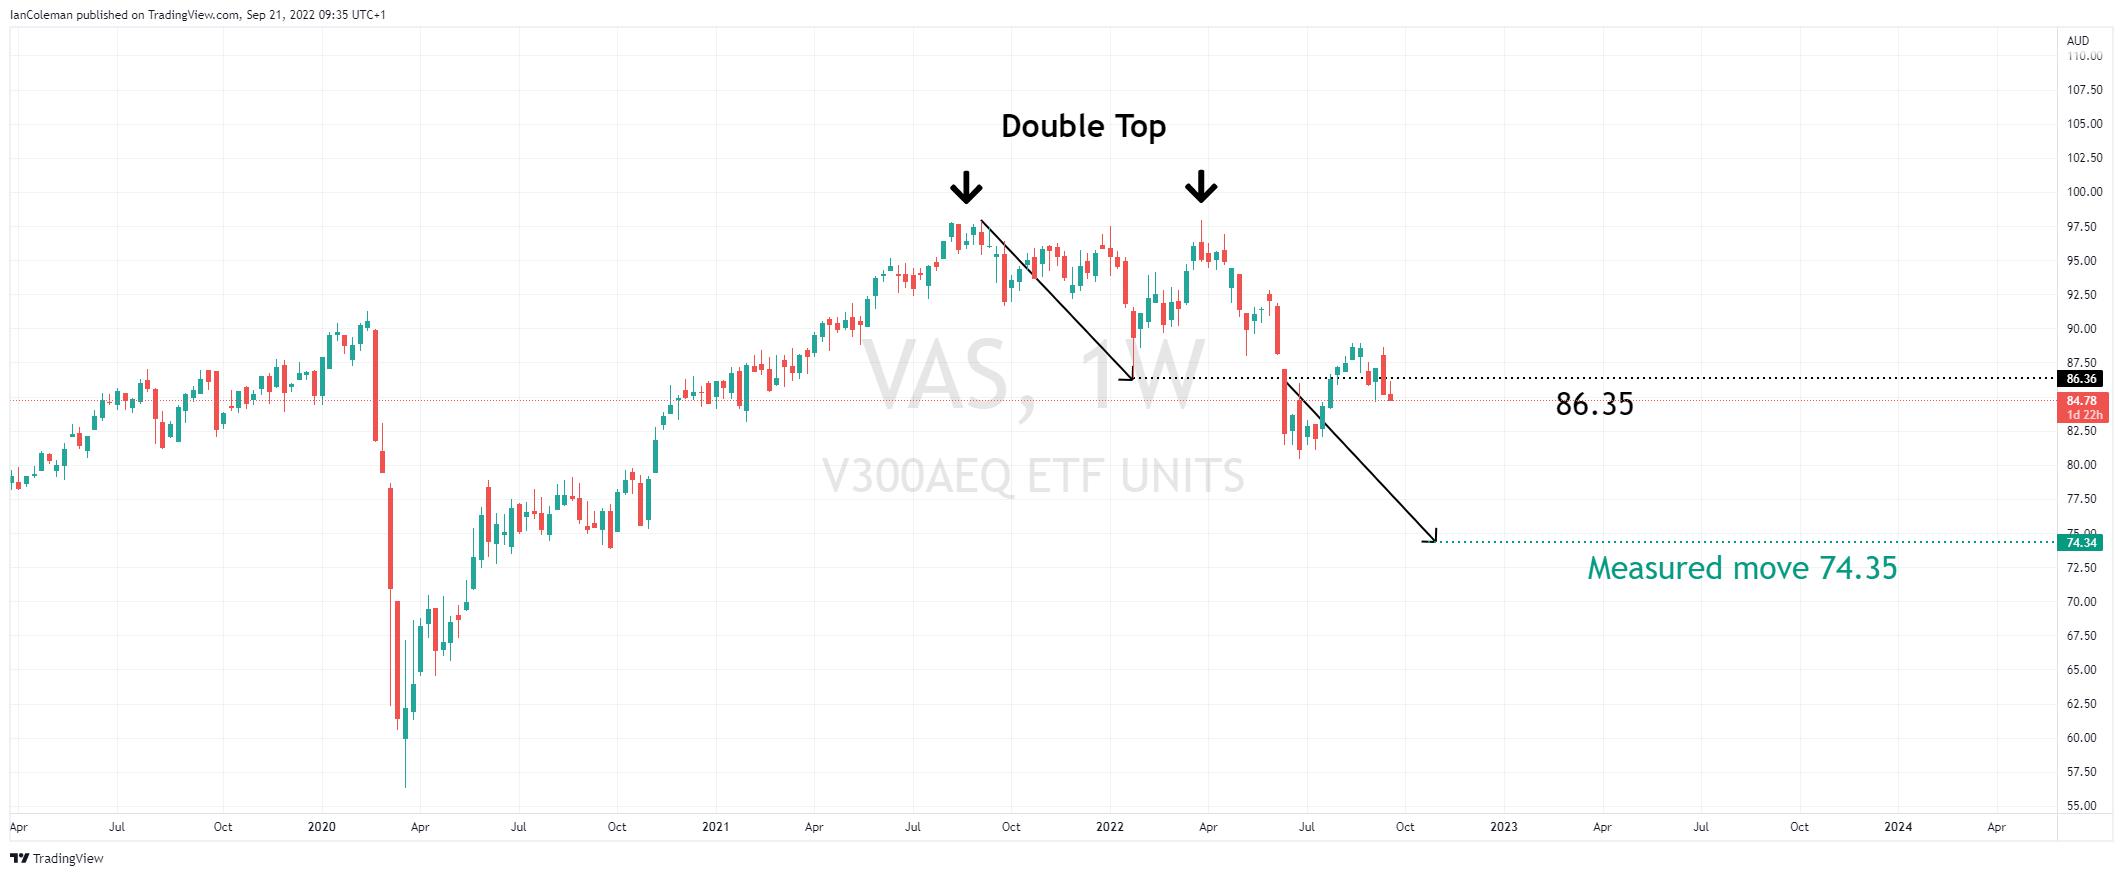
Figure 2 Trading View weekly VAS ASX double top
The move lower in mixed and volatile which is common in corrective formations.
If we project our Fibonacci extension tool from the measured move target of 74.35, we get a confluence area at 60.99 and 59.78. This then potentially forms a bullish cypher pattern known as a Bat formation.
With last week’s strong selling producing a bearish Engulfing Candle (negative for sentiment) and with this week’s immediate rally being sold into, there is no clear indication of a change in the downward bias.
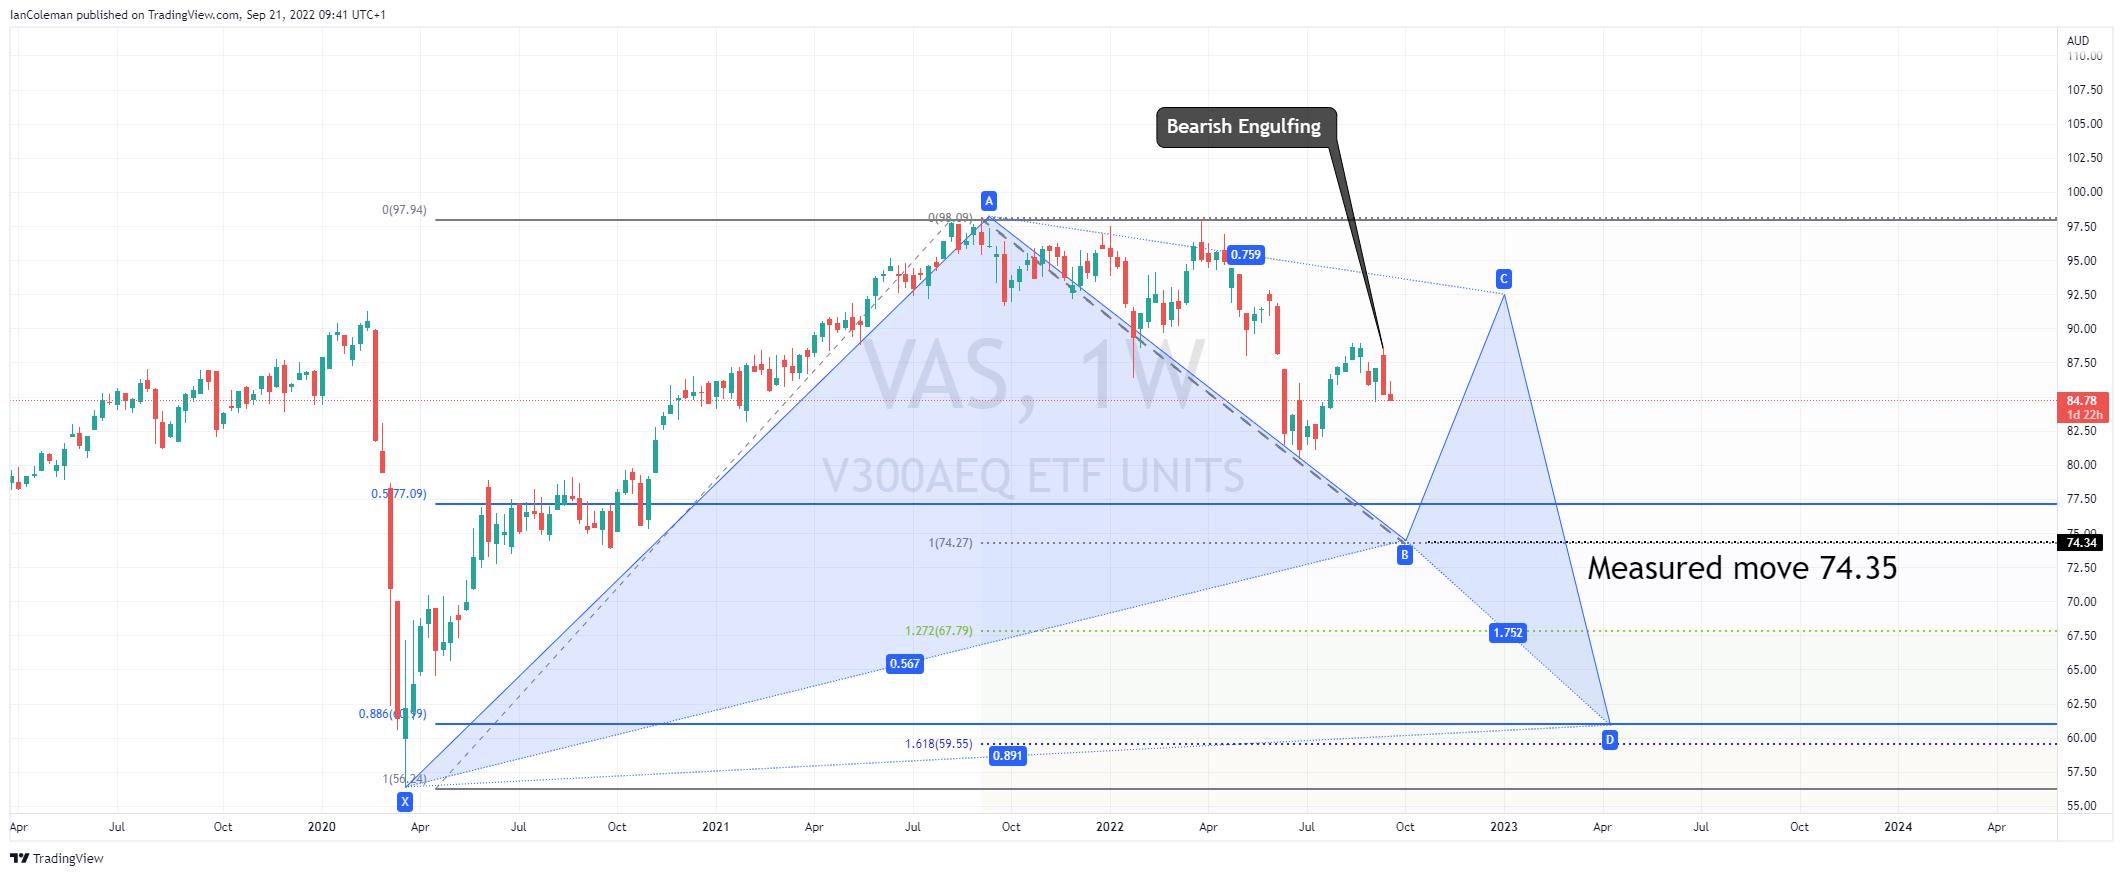
Figure 3 Trading View VAS ASX bearish engulfing
If we overlay the VAS ASX with the ASX200 we can clearly see a mirrored performance. With global inflation fears indices are moving lower and there is no clear indication of a change of direction…yet.
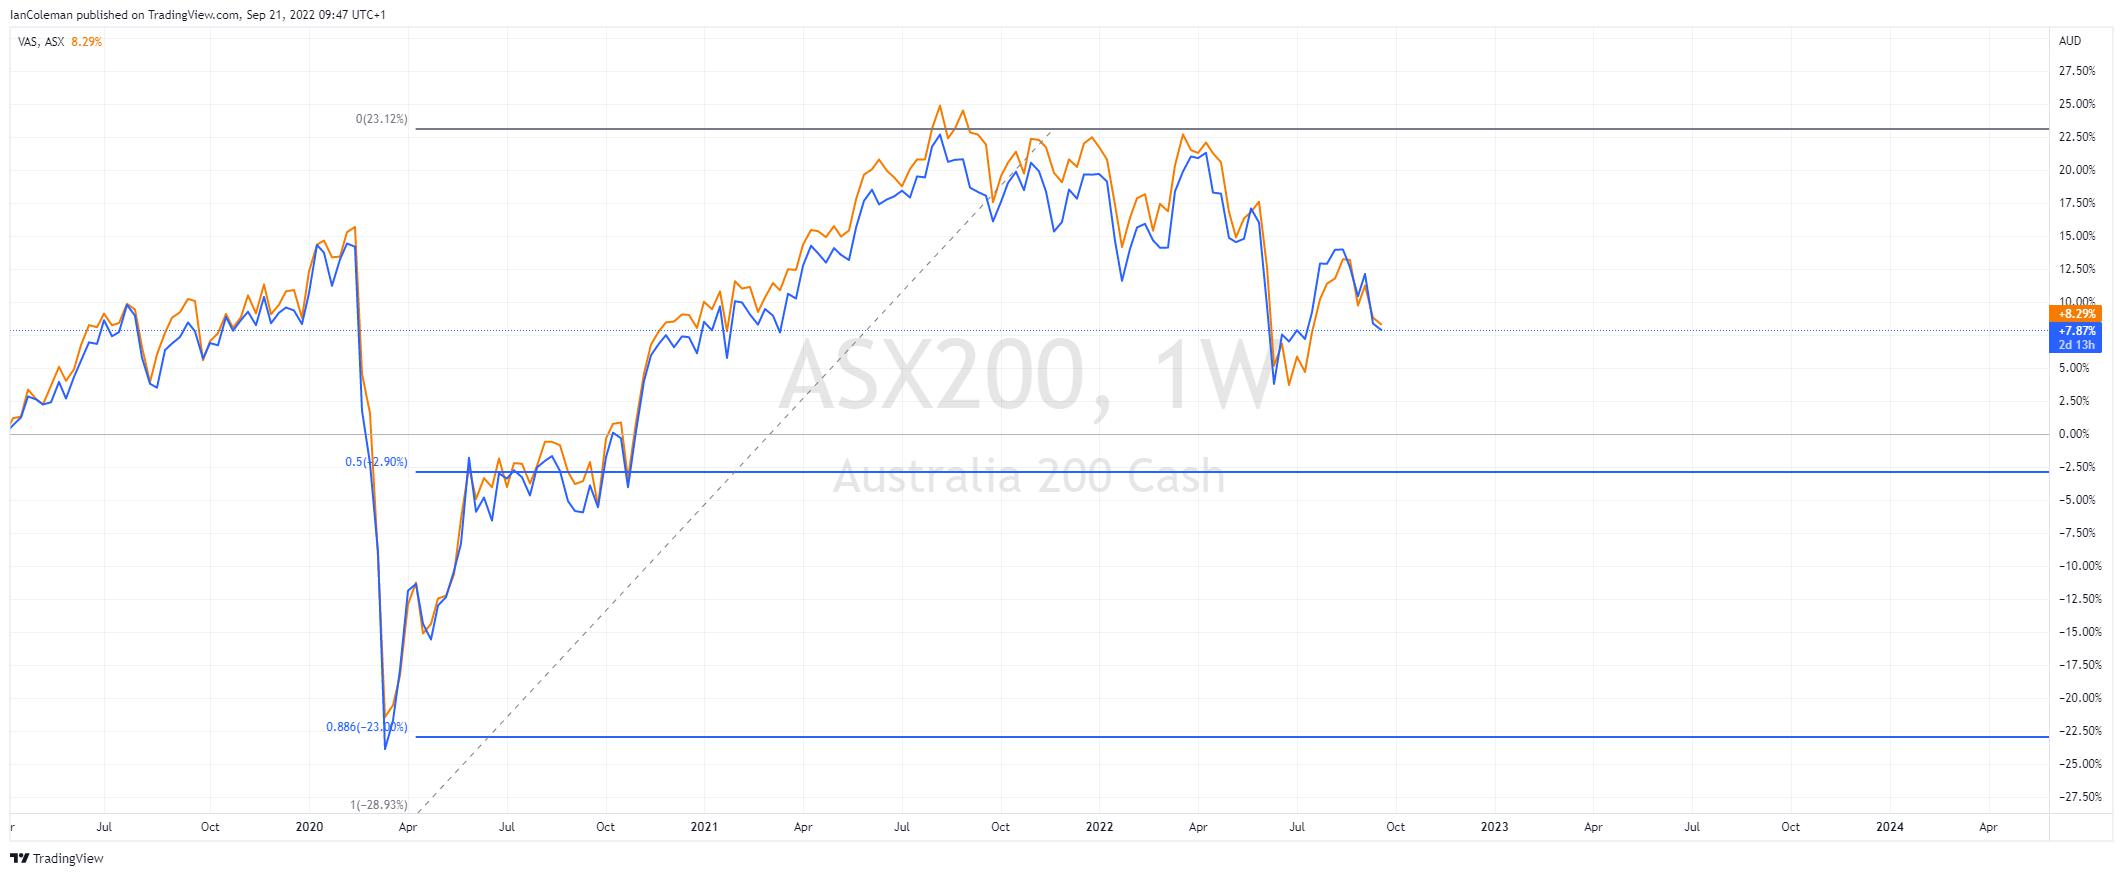
Figure 4 Trading View VAS ASX ASX200 overlay
It might be worth waiting on the side-lines until we reach the technical support level of 74.35 coupled with news that inflation is getting under control.
If you want to learn more about trading ETFs through Pepperstone, click here.
Related articles

Pepperstone不保证这里提供的材料准确、最新或完整,因此不应依赖这些信息。这些信息,无论来自第三方与否,不应被视为推荐;或者买卖的要约;或者购买或出售任何证券、金融产品或工具的邀约;或者参与任何特定的交易策略。它不考虑读者的财务状况或投资目标。我们建议阅读此内容的任何读者寻求自己的建议。未经Pepperstone批准,不得转载或重新分发这些信息。