
Before digging into that latter point, it’s worth digging into the drivers of the move. Yet again, it is the classic inverse correlation with real yields that seems to be propelling the yellow metal higher, with gold’s march north of $2,100/oz coinciding with 2-year real yields slipping to their lowest level in almost a year.
_go_2024-03-04_18-11-56.jpg)
The logic here is relatively simple. Gold, naturally, is an asset with no yield – and, as an aside, no intrinsic value. Hence as yields decline, particularly at the front-end of the curve, which is typically much more sensitive to shifts in the near-term monetary policy outlook, the relative attraction of gold tends to increase, as the opportunity cost of holding a zero-yielding asset falls. In other words, when the return available elsewhere falls, holding the yellow metal becomes relatively more attractive.
In terms of real yields, the recent decline appears driven by two factors. Factors which, at face value at least, are somewhat at odds with each other.
Firstly, front-end Treasuries have rallied of late, with last week marking the biggest one-week decline in the nominal 2-year yield since early-January, as market participants continue to price the Fed beginning the eagerly-anticipated easing cycle in June, while also proving reluctant to move beyond pricing an outlook more hawkish than the 75bp of cuts in 2024 that the FOMC’s most recent dot plot implies.
Meanwhile, inflation breakevens have moved notably higher, with the 2-year breakeven trading north of 2.8%, to its highest since last March. This is a result of market participants seemingly becoming increasingly jittery over the prospects of relatively sticky inflation, in light of hotter than expected February CPI and PPI figures, along with the continued persistence of services inflation, amid the uber-tight labour market.

Momentum, in the short-term at least, appears to favour the gold bugs for now, particularly with spot having pierced the $2,100/oz mark, and with the balance of risks favouring further Treasury upside – or, at the very least, trading within a range – likely until the next US CPI print on 12th March. Some lingering haven demand sprinkled on top of the aforementioned mix will likely also help things along.
Nevertheless, the gold rally has not only been seen vs. the USD, which has remained underpinned against G10 peers by virtue of the ongoing ‘US exceptionalism’ narrative that has driven the FX market for much of the year thus far. In fact, the relatively firm nature of the greenback recently makes gold’s gains rather more impressive.
When priced in EUR, for instance, the yellow metal also trades at a fresh record.
_2024-03-04_18-14-25.jpg)
The same is true if one prices gold in AUD.
_2024-03-04_18-14-48.jpg)
And, in JPY, with the JPY continuing to struggle as the end of the BoJ’s NIRP era remains elusive.
_2024-03-04_18-15-17.jpg)
Finally, in the CNH as well, even though the currency – by extension – remains tightly managed by domestic authorities.
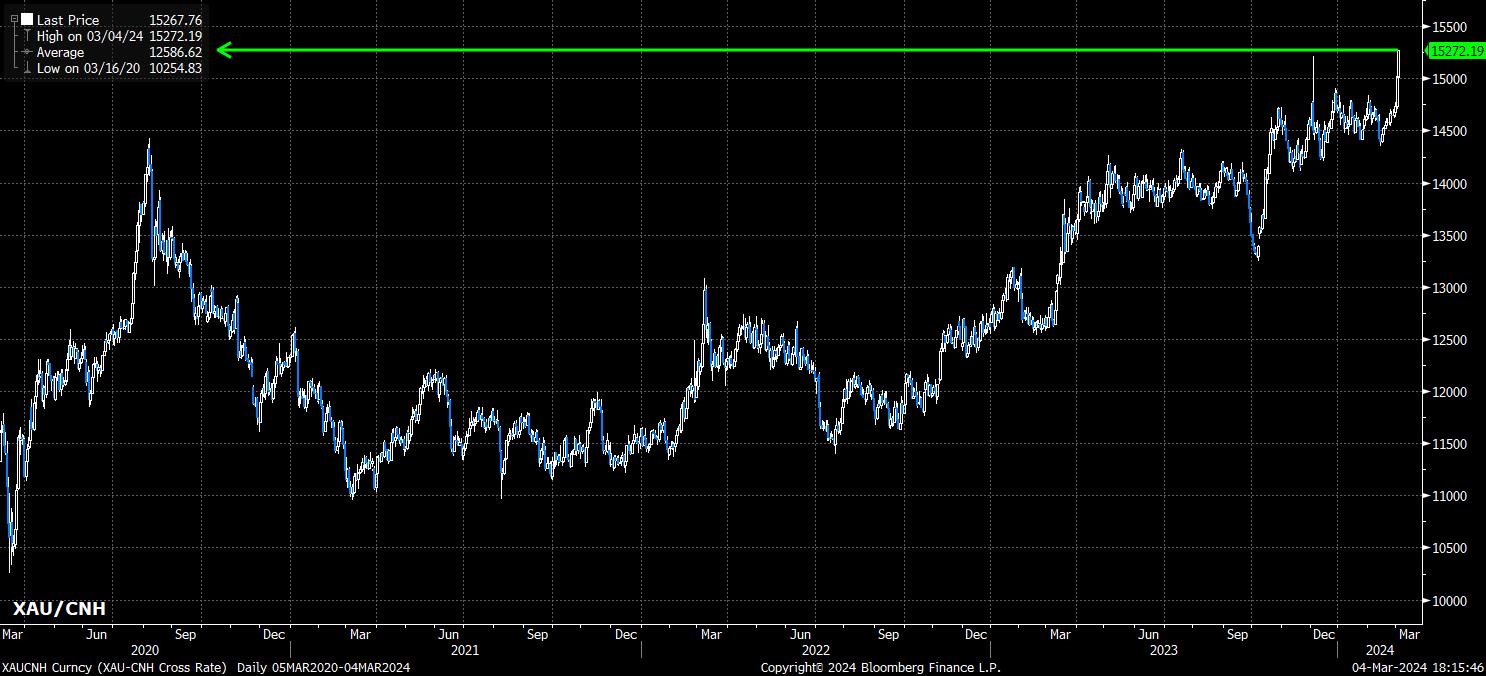
It’s clear, then, that the recent demand for the yellow metal is not simply an FX story, reinforcing the aforementioned narrative around falling real yields, and lingering haven demand, being the primary catalysts for the latest leg higher in the yellow metal. Hence, the path of least resistance likely continues to lead higher for now – with the natural risk that some longstanding bulls may take profit now the psychological $2,100/oz threshold has been breached – with the February CPI report, then March FOMC decision the two major bearish risks.
Related articles


Pepperstone不保证这里提供的材料准确、最新或完整,因此不应依赖这些信息。这些信息,无论来自第三方与否,不应被视为推荐;或者买卖的要约;或者购买或出售任何证券、金融产品或工具的邀约;或者参与任何特定的交易策略。它不考虑读者的财务状况或投资目标。我们建议阅读此内容的任何读者寻求自己的建议。未经Pepperstone批准,不得转载或重新分发这些信息。