- English
- 简体中文
- 繁体中文
- ไทย
- Tiếng Việt
- Español
- Português
- لغة عربية
.jpg?height=93&quality=100)
DXY:
It was a perfect storm for the dollar yesterday as it aggressively retraced back its earlier losses. We had beats on job data and Q4 GDP figures revised higher, keeping the US economic outperformance narrative alive. Real yields and nominal yields went bananas, both on shorter and longer tenures. What was interesting was how the 2-year spiked to the upside despite the Fed’s policy of AIT keeping short term rates anchored. The last driver would be the risk-off bid the dollar tends to attract as equity markets sell-off and sell-off they did. The Nasdaq was down 3.56% and the S&P wasn’t far behind at 2.45%. Futures this morning are pointing to a mildly weaker open too. Later today at 1.30pm GMT we’ll get the Core PCE Price Index data print with expectations of 1.2% YoY and 0.2% MoM. This will either detract or add to the strong inflation outlook the market has been expecting of late.
The technical picture is interesting. Dollar bulls will have sighed with relief as the price candle managed to close above the crucial 90 horizontal support, which coincided with the late January lows. The tail of the candle also stayed just above the previously broken downtrend line in place since March. Additionally, the shorter term 21-day EMA didn’t cross below the 50-day SMA. Price is currently above both moving averages. The RSI breached the 45.7 support, but has now moved decisively back above to print a 51.5 reading. Next price target above would be the 90.7-91 region. Crucial for dollar bulls that there are no closes below 90.
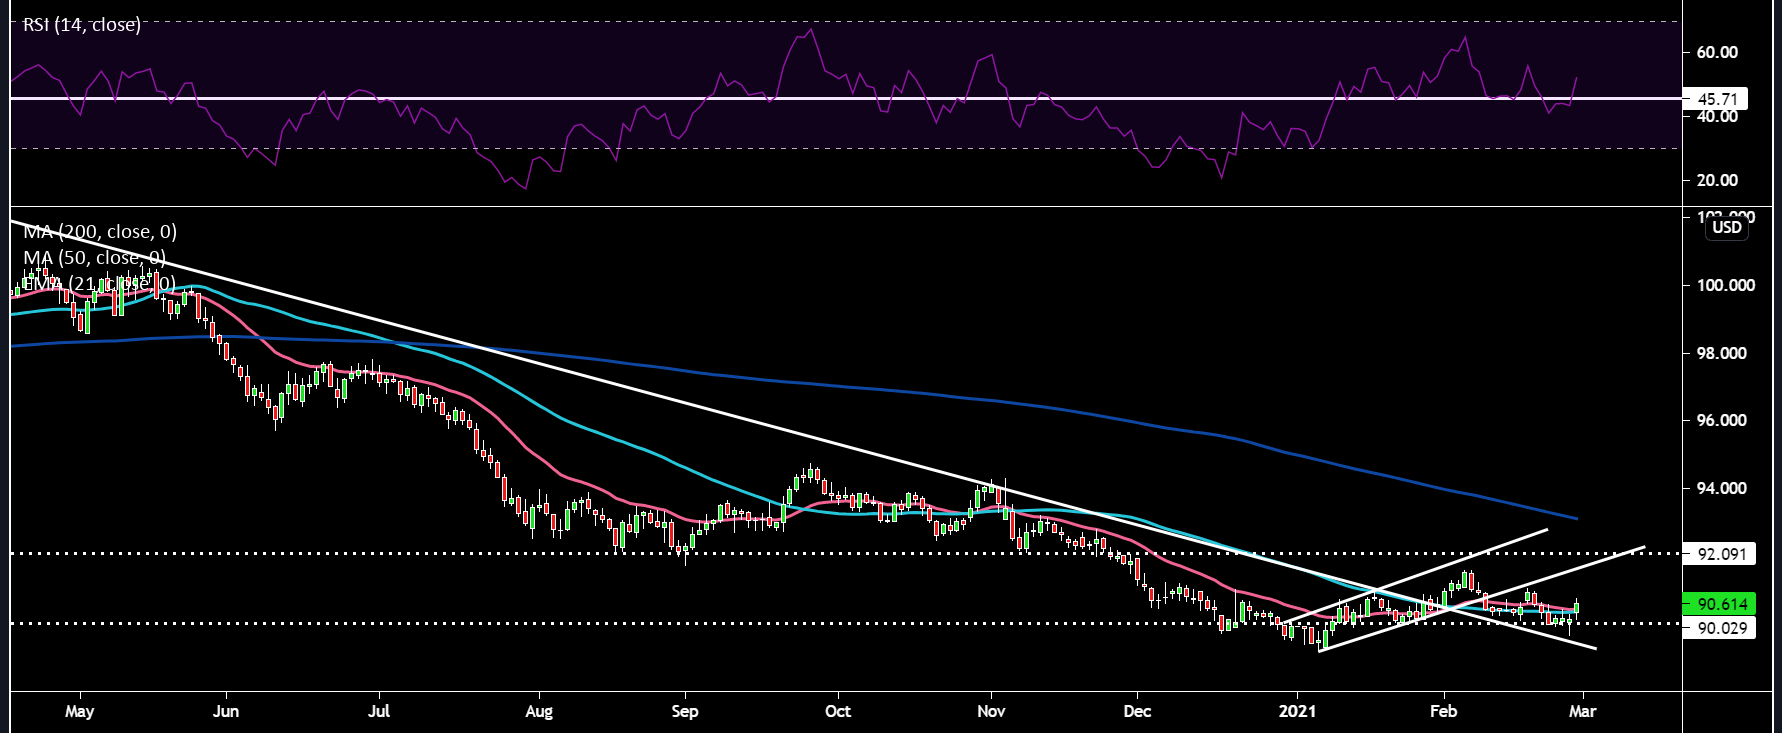
Pink Line: 21-day EMA, Light Blue: 50-day SMA, Dark Blue: 200-day SMA (same for all other charts)
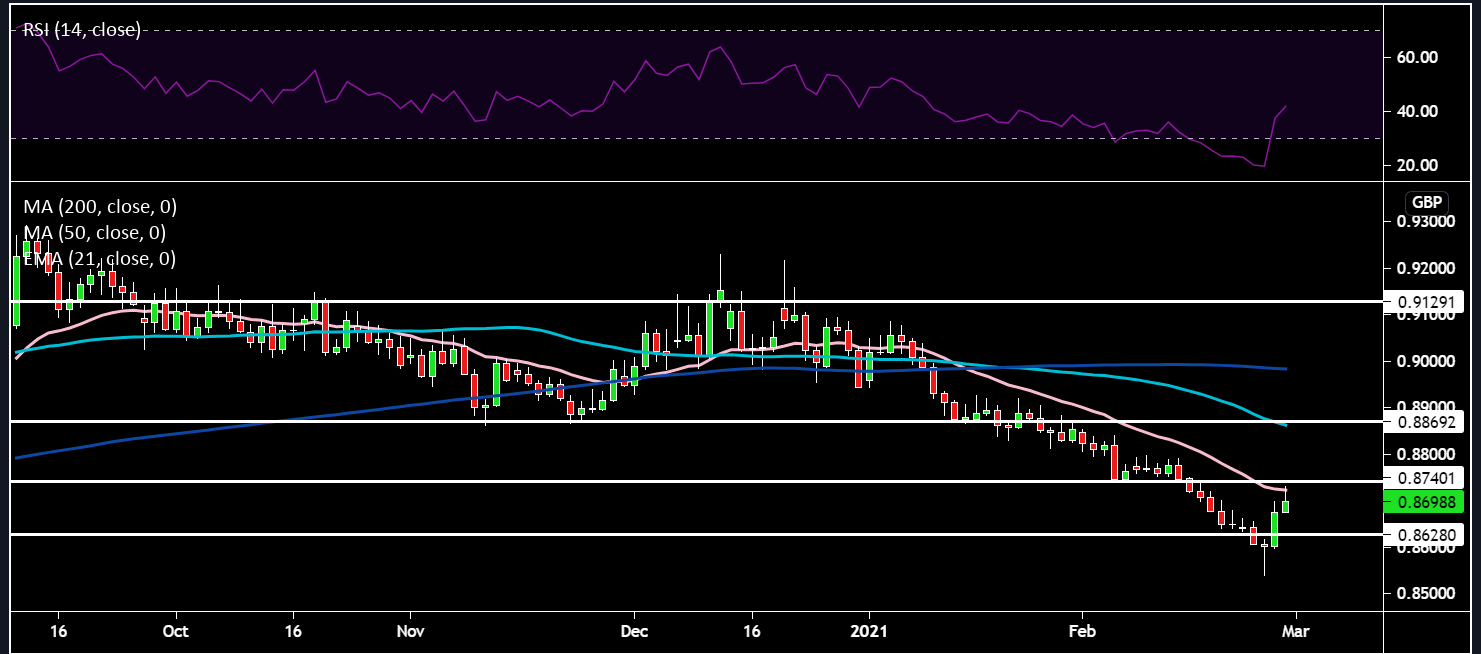
EURGBP:
EURGBP found some respite over the last two days and has put in some large price moves. This is more technical than fundamental in my opinion. Although, I like the pound's prospects over the longer term, momentum indicators for the pound against the euro were beginning to look stretched. Hence this flush upwards we are seeing seems more transitory as opposed to a complete trend change. GBP tends to suffer during risk aversion, the narrative on a superior vaccine rollout still remains in place, particularly so against the EU. However, the market will want to see results now, it’s no good having this vaccine advantage and botching the reopening. European Commission President Von Der Leyen, recently remarked that by the end of summer 70% of the adult population in the EU will have been offered a vaccination – whether that timeline is met is a whole different kettle of fish. There was also some carry trades unwound during yesterday’s risk rout that would have benefited the euro given its funding currency nature. You just have to take a look at some of the high yielding currencies like the zar and peso to see the violent price move. Lastly, the ECB won’t be enjoying this fast rise in yields and we’ve already heard commentary from ECB member Schnabel this morning who stated there is still room to cut rates and support may be needed if yields hurt growth. The periphery countries’ bonds rose quite a bit yesterday and will compound some fears in the ECB.
To the technicals - price ran down into the low 0.85s and then quickly reversed with an oversold bounce moving price to the 0.87 area. The 21-day EMA continues to act as a dynamic resistance for EURGBP shorts. Price has met resistance at the 21-day EMA and the horizontal line around 0.874. Still feel this cross is a good candidate for shorting rallies in the near term.
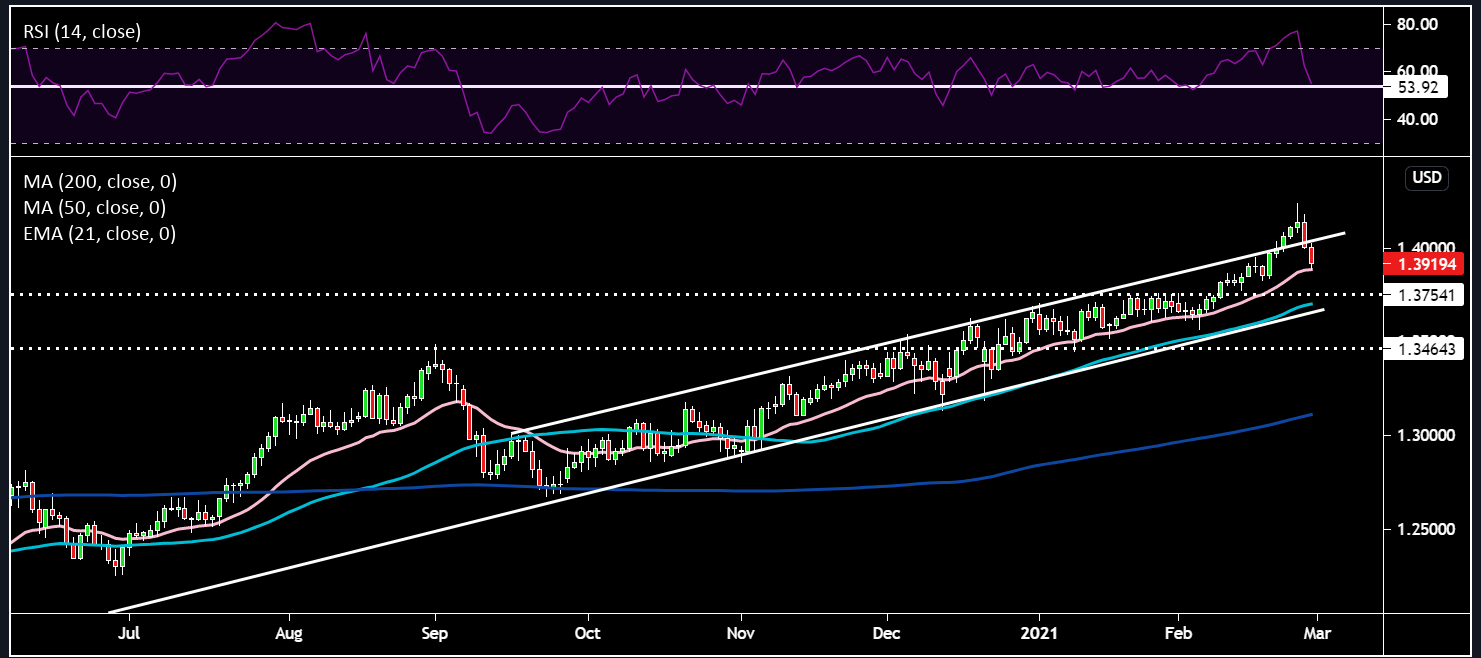
GBPUSD:
Cable suffered some high altitude sickness as it breached the 1.42 level. The move, although based on good fundamentals was a bit too swift and sellers decided to have a little nibble. The pound has a high beta to risk and closely correlates with US equity markets, which as we know took a dive yesterday. There was also a slight slowdown in the vaccination rate over mild supply bottlenecks, which I believe will be temporary. The big event for sterling, will be next Wednesday’s Budget, where whispers are starting to build that Chancellor Sunak may announce a large increase in the corporate tax rate from its current level of 19% in order to fund his spending bill, with estimates of it being around £100 billion. We’ll also hear more about the furlough scheme to keep the labour market propped up. A French Minister remarked yesterday that partial equivalence may be granted on financial services, however, issues in Northern Ireland remain prickly. The pound found a strong bid this morning as BoE Chief Economist Andy Haldane stated - there is a greater risk at present of central bank complacency allowing the inflationary (big) cat out of the bag and that this may require monetary policymakers to act more assertively than is currently priced into financial markets.
For the cable bulls, 1.39 needs to be held, which roughly coincides with the 21-day EMA. Below that I’d look at the 1.375 level, just above the 50-day SMA. The RSI is sitting at crucial support around 53.9. Still believe cable is a good candidate to implement a buy the dips approach.
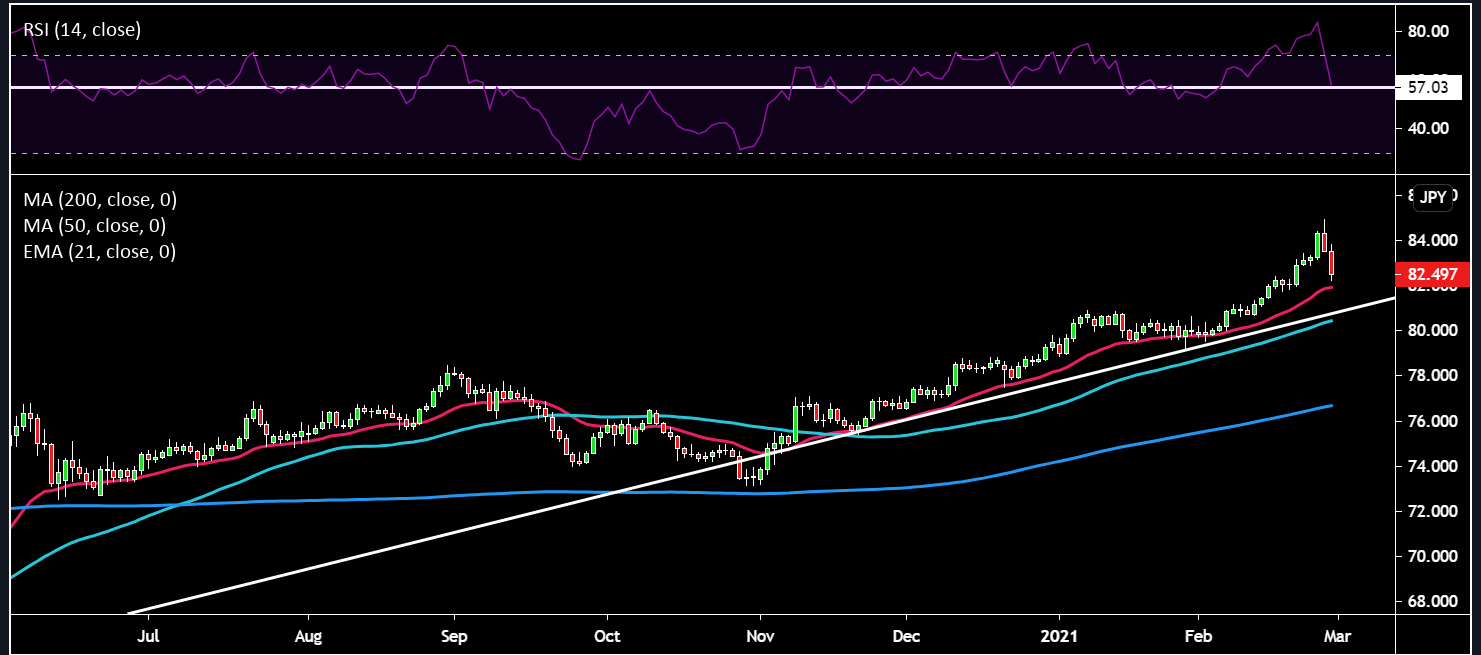
AUDJPY:
The classic risk-off, risk-on cross. The Aussie has been flying of late, as risk sentiment has remained buoyant over the past few weeks. Additionally, the very fast rise in the price of copper has proved a tailwind for AUD. AUDJPY was looking quite toppish as it was and the risk aversion which ensconced the market was the trigger. For this cross to continue its ascent, the RSI needs to hold the 57 support and the 21-day EMA around the 82 level. More substantial selling could see us test the white uptrend line from the March lows around 81.
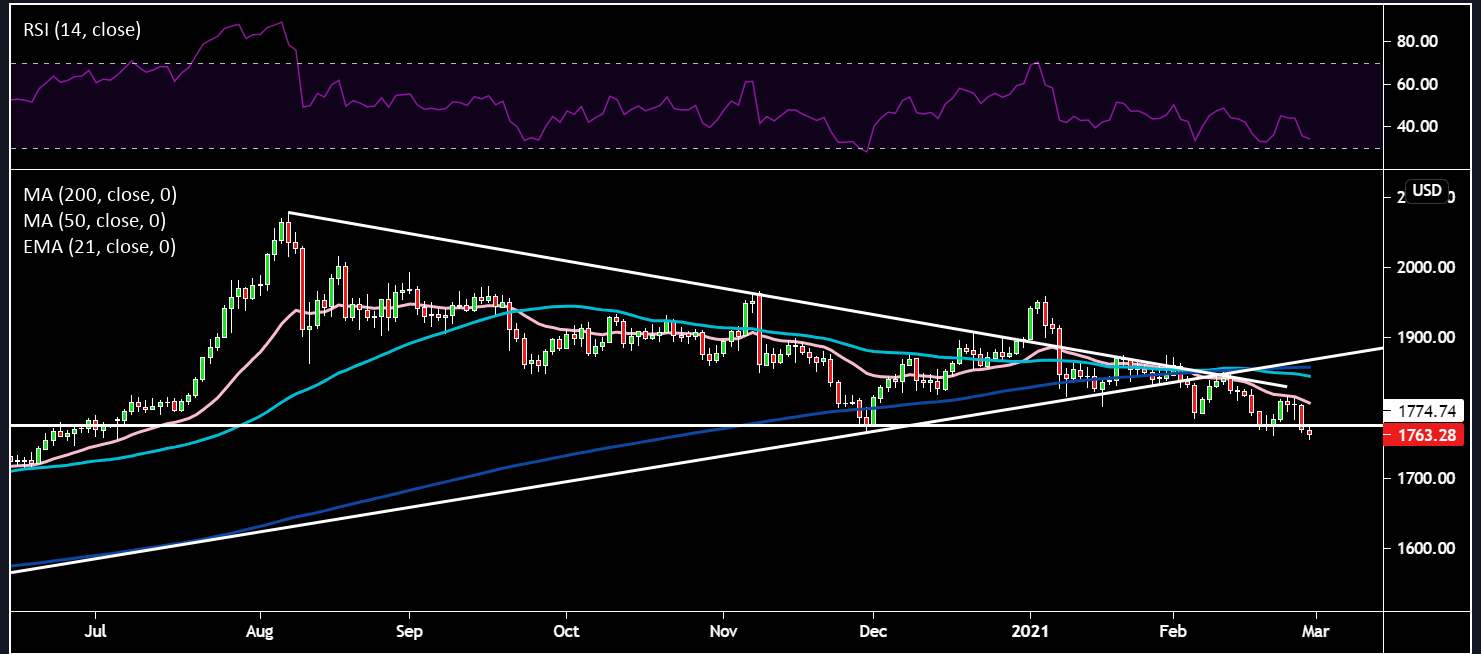
Gold:
Gold has really soured over the last two weeks. Bitcoin is definitely benefiting at the expense of gold as now institutional players also begin to move in. Higher real yields do nothing for an asset like gold given its zero yield characteristics. Copper seems to be leading the charge as traders choice as an inflation hedge and robust economics. On the technical front gold needs to hold the $1750 level, if that gets breached then gold will tumble further. It looks to be breaking below that large flat sided descending triangle which formed from July’s highs. The moving averages have all rolled over too.
Yields:
Yields snapped higher yesterday and hogged the news flow for the day. They drove multiple different asset classes. Let’s dissect what happened. There’s lots of potential interesting reasons as to why we saw what unfolded yesterday. Lots of important FOMC members have been sanguine about yields increasing – the Fed’s Bostic said this yesterday: not worried about the move in yields and that the Fed doesn’t need to respond at this point. Well the market took this and ran with it in order to test the Fed’s pain threshold. We had two weak 5 and 7 year bond auctions (low bid to cover ratios and large tails) over the last two days which definitely heaped pressure onto the belly of the yield curve. Due to a collapse in indirect demand (foreign), dealers were left holding the lion’s share of the auction. As shorter maturity bonds sold off the yield curve flattened and caught the bear steepener crowd off-guard. This move around the belly of the curve in addition to Eurodollar futures points towards markets bringing forward their rate hike expectations. CTAs (Commodity Trading Advisors) would have further amplified the sell-off given their momentum style trading. Another more esoteric factor could have been convexity hedging taking place by mortgage backed securities investors as yields blew out. In essence when rates increase, refinancing of houses slows down, which then reduces prepayments on mortgage bonds lengthening the duration of the bond. To bring this back to equilibrium in order to be hedged they have to sell duration (bonds) which would have exacerbated the sell-off further. Spikes like that tend to also trigger stop losses which leads to forced selling. So as you can see it was a bit of everything yesterday working against yields.
The 1.5% level remains an important line in the sand. The copper gold ratio continues to call for higher yields.
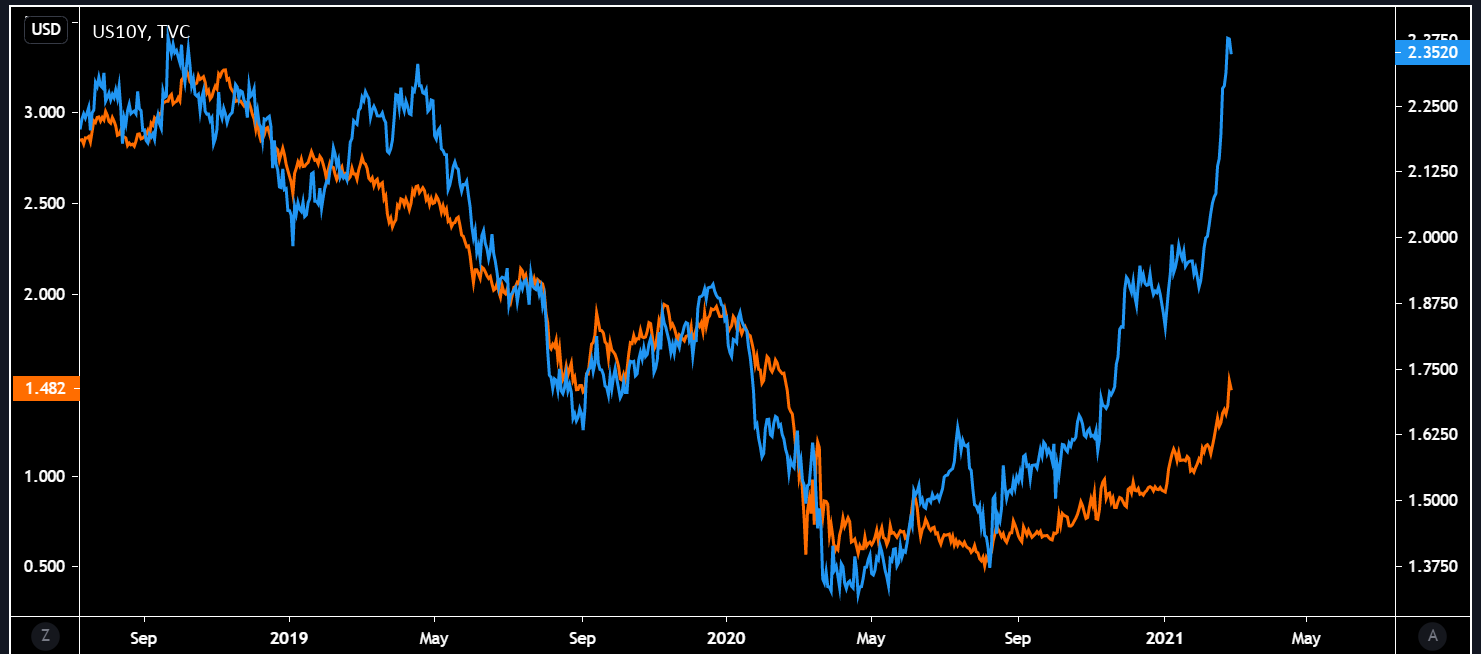
Dividend yield vs US 10-year yield:
US 10-year yield edged over the S&P 500 dividend yield last night. This morning it’s moved slightly below, but is still now in the area of being seen as an alternative. The TINA (there is no alternative) crowd will be watching this closely. Many investors such as pension funds will now start to look at bonds again as source of income, potentially dragging on flows into equity. Pension funds like less risk and that is what the US 10-year provides as its essentially seen as a risk-free asset, “always” returning your initial investment back.
Source: Bloomberg
Related articles


Ready to trade?
It's quick and easy to get started. Apply in minutes with our simple application process.
The material provided here has not been prepared in accordance with legal requirements designed to promote the independence of investment research and as such is considered to be a marketing communication. Whilst it is not subject to any prohibition on dealing ahead of the dissemination of investment research we will not seek to take any advantage before providing it to our clients.
Pepperstone doesn’t represent that the material provided here is accurate, current or complete, and therefore shouldn’t be relied upon as such. The information, whether from a third party or not, isn’t to be considered as a recommendation; or an offer to buy or sell; or the solicitation of an offer to buy or sell any security, financial product or instrument; or to participate in any particular trading strategy. It does not take into account readers’ financial situation or investment objectives. We advise any readers of this content to seek their own advice. Without the approval of Pepperstone, reproduction or redistribution of this information isn’t permitted.