Los CFDs son instrumentos complejos y conllevan un alto riesgo de perder dinero rápidamente debido al apalancamiento. El 80% de las cuentas de inversores minoristas pierden dinero al operar CFDs con este proveedor. Debes considerar si comprendes cómo funcionan los CFDs y si puedes permitirte asumir el alto riesgo de perder tu dinero.
- Español
- English
- 简体中文
- 繁体中文
- Tiếng Việt
- ไทย
- Português
- لغة عربية

USDJPY – was it intervention or not?
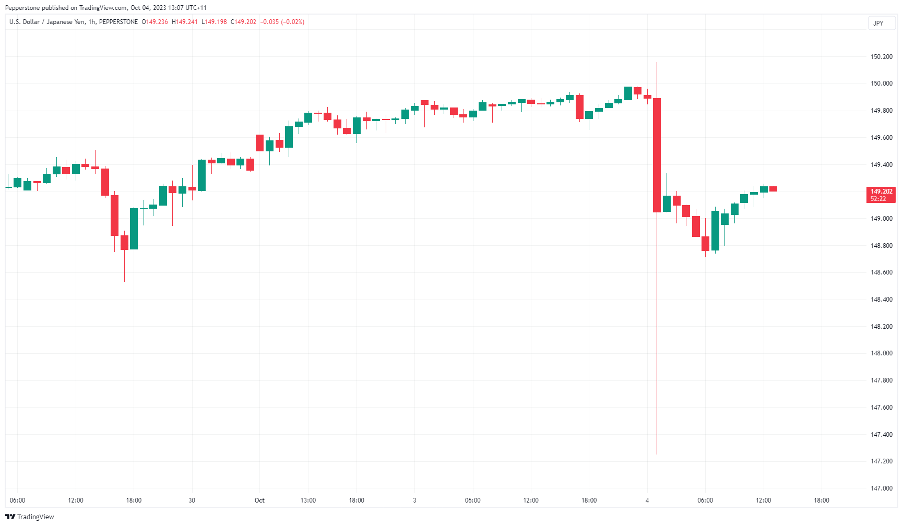
There was always a threat of JPY intervention from the Japanese Ministry of Finance (MOF), with many seeing ¥150 in USDJPY as the danger zone. Post the US JOLTS report, and the ensuing move higher, we subsequently saw a rapid decline into 147.25 and a 290-pip range on the day. The MOF has refrained from commenting on whether this was genuine intervention, but the fact we’re firmly back above ¥149 suggests some scepticism they did act. What we know is the move and the intentional lack of clarity on the situation throws notice to JPY shorts on moves above ¥150. That said, a strong US ISM services and nonfarm payrolls this week could see a sharp break of ¥150, offering a heightened expectation of full intervention. A fate that would most likely cause a 500-pip rip to the downside - a risk to manage.
AUDUSD – breaking down
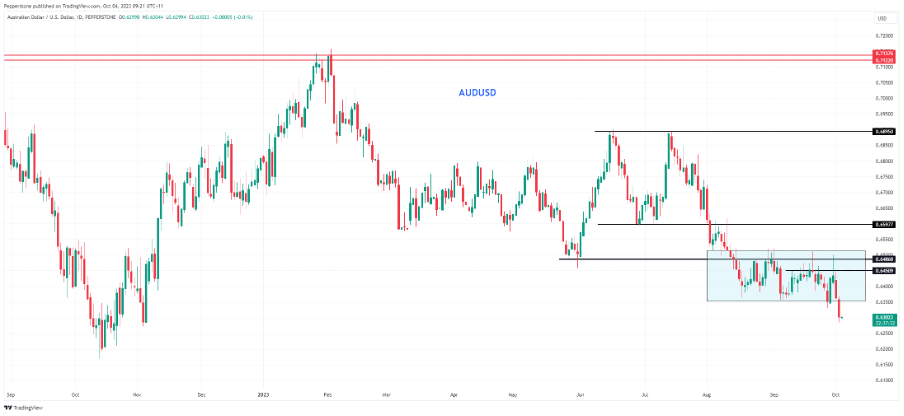
Tuesday’s RBA meeting didn’t really offer us anything new, and we await the Q3 CPI print (25 Oct) to dictate if the bank hike in either November or December (or not at all). The bigger driver of AUDUSD though is broad market sentiment, with the AUD a clear risk proxy, and largely influenced by flows in the US500 and the HK50 index which breaking to new YTD lows. Clients are fading the range break though, where we see 73% of open positions are long. In my thinking, to see the pair reverse and re-test the former range lows we’ll need to see a turn lower in US Treasury yields and a more constructive tape in Asia equity for a re-test of the breakout zone.
XAUUSD – finding few friends with the USD in beast mode
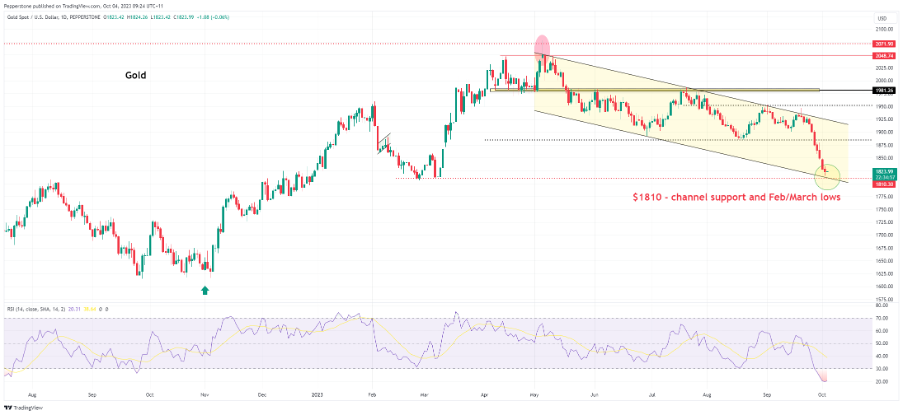
Gold has found few friends of late as both US nominal and real Treasury yields rocket higher, and the USD has been on a one-way bull trend. If funds want to play defence in the portfolio, they increase their USD exposures, given the strong inverse correlation vs. the S&P500 and NAS100. Funds can also get a 5.58% yield holding risk-free US 6-month T-Bills and when gold has no yield this is an opportunity cost. Technically, we see strong support at the channel base, and the Feb/March lows, and combined with the RSI at an extreme 19, there is some scope to bounce, or at least consolidate here. However, that will again require buyers in US Treasuries, which could compel traders to take profits on USD longs. Catalysts this week for traders to navigate and could affect price action in XAUUSD - ADP payrolls, ISM services and nonfarm payrolls.
KRE ETF (S&P US regional bank ETF) – are banking risks resurfacing?

While the Fed’s Bank Term Funding Program (BTFP) has been a key factor in supporting bank equity, the rapid rise in US Treasury bond yields is a concern, and so is the exposure to Commercial Real Estate (CRE). We can see CRE benchmarks rolling over of late and heading lower and this is keeping investors from buying into regionals. One for the radar, but if we see the price continue in the current trajectory then it could see signs of greater risk aversion kicking into markets. Staying in the ETF scene, I am also watching the HYG ETF (iShares High Yield Corp ETF) given we see that falling sharply but seeing some extremely oversold reads.
Short US2000 / long NAS100 – a tactical and momentum pairs trade
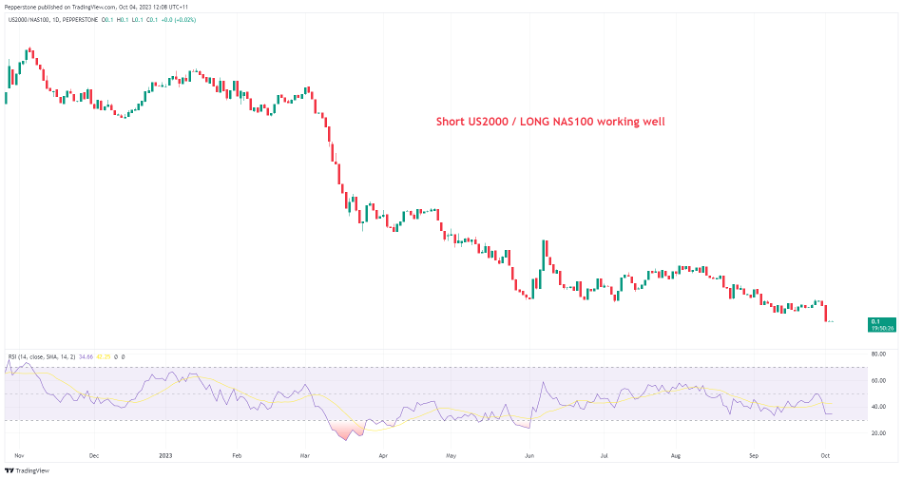
As we head into the US corporate earnings season (starting 13 October) we can see a big trend in mega caps vs. small caps. Looking at the ratio analysis (short US2000/long NAS100) we see a continued performance of the NAS100. In part, the weakness in regional and mid-size US banks is weighing on the US2000. We also recently saw Nvidia being added to the Goldman Sachs conviction buy list. Hard to see this reversing significantly in the near term and I would remain positioned for this ratio to head lower.
Related articles
Pepperstone no representa que el material proporcionado aquí sea exacto, actual o completo y por lo tanto no debe ser considerado como tal. La información aquí proporcionada, ya sea por un tercero o no, no debe interpretarse como una recomendación, una oferta de compra o venta, la solicitud de una oferta de compra o venta de cualquier valor, producto o instrumento financiero o la recomendación de participar en una estrategia de trading en particular. Recomendamos que todos los lectores de este contenido se informen de forma independiente. La reproducción o redistribución de esta información no está permitida sin la aprobación de Pepperstone.