- English
Why buying strength in US equities tends to be the right trade

The US2000 (Russell 2k) is outperforming other US markets, perhaps thanks to a solid upside move in US bond yields. Tech too is looking good, although the intra-day tape has been pretty whippy.
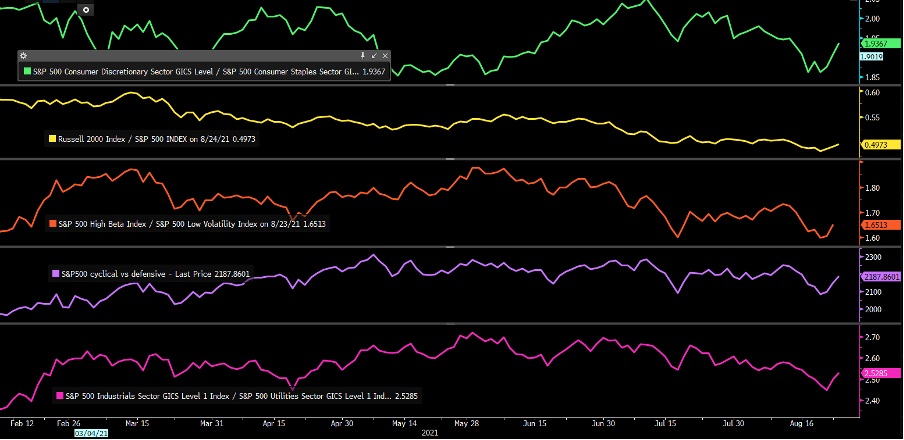
By way of sentiment, there's a million ways to look at this – price action is always the best guide and you don’t need to be institutional to read the tape. We can also look at how the factors or styles play out and you can see here a number of relative factors that I look at to guide – last week we were seeing a rotation into defensives, and low volatility names, but as we’ve seen in seen the last two days this has switched to a more positive vibe.

(Source: Bloomberg)
I also look at the volatility markets – either in the absolute level of the VIX index, the steepness of the VIX futures curve, or the skew – or the premium of S&P 500 1-month put implied volatility to call volatility, and how rich that is to a period. As it stands S&P 500 1-month put vol trades a 7 vol premium to calls, which is in line with the 12-month average.
For index traders it is tough as the constant rotation within the sectors means we tend to see reduced volatility and range contraction, and that is before the effects of traders selling volatility and market makers/dealers hedging their gamma exposure – when the market is short vol, dealers are long gamma, and they tend to hedge by selling S&P500 futures, which makes markets mean revert.
The opposite is true of meme names which are flying today, with Gamestop +27%, AMC +20.3% and Blackberry 9.5%. If we look at the most traded options in GME its all call buyers – again, if the dealers are selling calls, they are short gamma and must hedge – this means they buy the underlying and it perpetuates the move in GME’s share price higher – and who thought retail weren’t sophisticated!
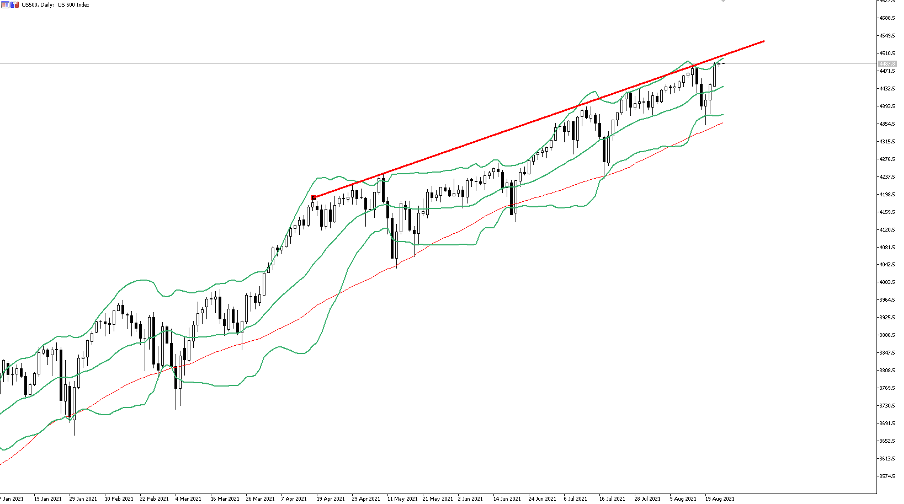
The interesting aspect when I look at the US500 is we can see that generally, buyers have stepped in when we’ve reached the lower Bollinger band, as well as the 50-day MA. When this changes then I suspect the calls for a 5% to 10% pullback will be deafening.

We have upside trend resistance drawn from the April highs, while the upper BB has also been a good guide on daily limits. This should limit the movement in the near term and increases the prospect of a grind than an explosive move up, although Jackson Hole has the potential to change sentiment where I suspect the risks are skewed to the downside to an extent.
What is also interesting is to see how the market performs when we close above the 30-day high. Using the logic of buying the S&P 500 futures on the following open after a daily close above the prior 30-day high and exiting on the close on that same day. Since January 2020 there have been 48 occurrences, and we see a strike rate of 63%. Granted the average loss is 0.7x greater than the average win, but this test has no stop loss built-in and is purely defined by calendar basis.
The point being is that selling strength on a daily timeframe has been a poor trade. In fact, even if we go back to 2010 and capture different cycles the strike rate is 56%.
It throws weight to my belief that in single name equities and equity indices buying strong and selling weak tends to be a great starting point and you can trade the opportunity with Pepperstone.
Related articles
Ready to trade?
It's quick and easy to get started. Apply in minutes with our simple application process.
The material provided here has not been prepared in accordance with legal requirements designed to promote the independence of investment research and as such is considered to be a marketing communication. Whilst it is not subject to any prohibition on dealing ahead of the dissemination of investment research we will not seek to take any advantage before providing it to our clients.
Pepperstone doesn’t represent that the material provided here is accurate, current or complete, and therefore shouldn’t be relied upon as such. The information, whether from a third party or not, isn’t to be considered as a recommendation; or an offer to buy or sell; or the solicitation of an offer to buy or sell any security, financial product or instrument; or to participate in any particular trading strategy. It does not take into account readers’ financial situation or investment objectives. We advise any readers of this content to seek their own advice. Without the approval of Pepperstone, reproduction or redistribution of this information isn’t permitted.

