- English
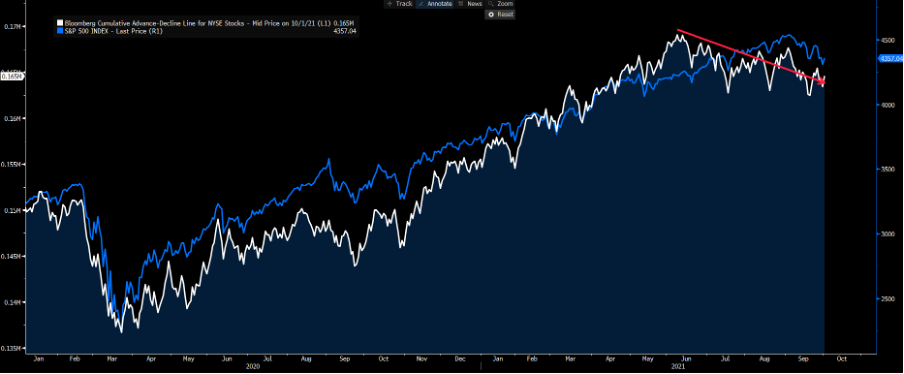
Certainly, equities have been thrown about but ultimately sit in a neutral set-up with the S&P 500 back to its 100-day MA and eyeing the 50-day MA in earnest. A close above the 23 Sept high of 4465 would really get the bulls started and with the market so well hedged through volatility structures (we look at skew), it’s not hard to see why the pullbacks have been limited – in fact, last Tuesdays 2.04% drop was only the fourth 2%+ daily drop in 2021.
White – advance-decline line, blue – S&P 500

(Source: Bloomberg - Past performance is not indicative of future performance)
While the bulls want to see some technical work to believe we can see new all-time highs into Q3 earnings (JPM start the ball rolling on the 13 October) - All the leading market internals look compelling, with small-caps outperforming large-caps, high beta working vs low vol beneficiaries and cyclicals have started to outperform defensives. Ideally, I’d like to see better breadth and the advance-decline working more positively to make me turn more bullish – it's about climbing the wall of worry.
The USD got a lot of focus last week in its march to 94.50 in the DXY, USDJPY into 112 and EURUSD into 1.1609, but the market has taken some off the table on Friday. FX volatility rose a touch last week, but gave some back on Friday, alongside the reduction in implied vol in rates and bond markets – if US treasuries find further buyers this week into Friday’s US non-farm payrolls, the USD may go on sale this week.
I feel the risk is that US 10s can push lower from 1.46% to 1.40% and this may give some life to tech and growth assets – I’d looking for a turnaround into 1.35%/1.40% and a point where the USD bull run could resume.
Key event risks and in order of importance for this week:
- US non-farm payrolls (Friday 23:30 AEDT)
- OPEC meeting (Today)
- Political headlines around the debt ceiling negotiations
- Evergrande’s debt repayment – news on a $260m note due to mature yesterday
- RBA and RBNZ meeting (Tuesday and Wednesday respectively)
- US ISM services (Wednesday - 01:00 AEDT)
- Central bank speeches from Fed member Bullard (Tuesday 01:00 AEDT) and BoE member Ramsden (today 23:00 AEDT)
US NFP is a highlight
The median consensus from economists is for 470k jobs to have been created, with the economists’ estimates ranging from 750k to 200k. The unemployment rate is eyed at 5.1% (down from 5.2%), while wages are expected to run hotter to 4.6% YoY – after last month’s shocker, predicting this data point is tough and where the market could be positioned. The question is whether there is a number that alters the Fed’s view on tapering its bond purchases in November and what a really weak or hot number means amid the backdrop of rising stagflation fears?
By way of movement, the market expects a 1.4% move (higher or lower) in the S&P 500 on payrolls day, which is easily above the typical moves we’ve seen since late November of 0.4% - interestingly, the S&P 500 has rallied in 10 of the past 11 payrolls. There is no clear form for the USD or gold.
Inflation is still the talk of the town
The inflationary aspects of the market are getting airtime, which is fair, it’s one of the bigger risks to markets. With so much focus on coal and nat gas (NG) prices it pays to keep NG on the radar – the two variables are linked, along with aluminium – NG gave some back on Friday, but is it really ready to collapse? The risks seem skewed to the downside, but the trend-followers are still in this one and seems unlikely the trigger has been seen the rule to start reducing exposures just yet – A break of the 200-day MA may get the sellers out and may start to positively impact the EUR.
Why? Because the meteoric rise in EU nat gas and electricity prices have partly contributed to the sizeable lift in EU inflation expectations to the highest since 2015. This has weighed on the EUR, as EU real rates have lagged other G10 FX nations and incentivised capital flows to the US and other justification. If gas prices head south, it could see EU real rates moving higher on a relative basis.
Watch crude exposures
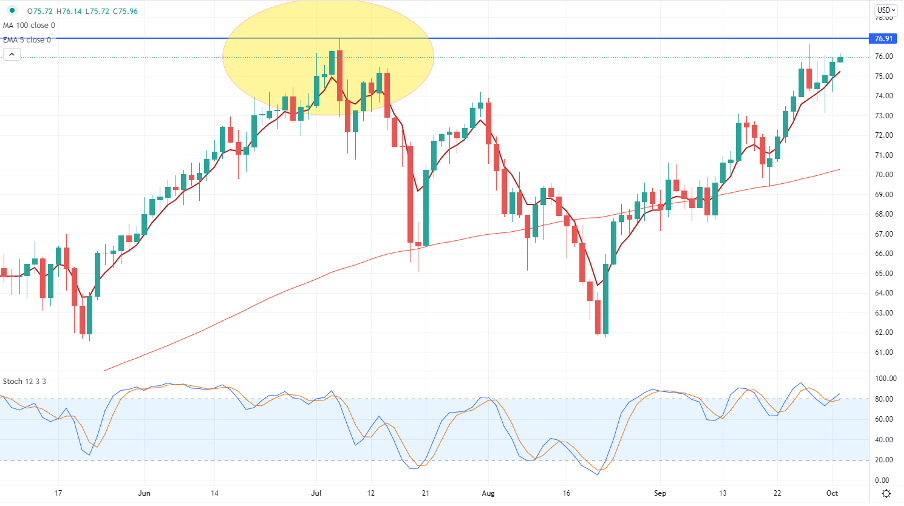
Crude must be on the radar with price moving towards $76.00 and the double top of $76.95. Brent crude is looking to hold above $80, and this is where traders should be looking if making a play on OPEC. What is the play? Well, after OPEC+ recently announced plans to lift output by 400k b/d per month some may be calling for OPEC to raise output even further from today – should they leave output unchanged then it could push price above these key levels – in turn, this would be good for the XLE ETF and petro-currencies.
WTI crude daily

(Source: Tradingview - Past performance is not indicative of future performance)
Obviously, the risk is if long crude and OPEC do lift output it would be a surprise and cause prices to fall sharply.
The RBA meeting should be a low vol event, but the RBNZ could open up some movement – it’s no surprise the NZD implied vol is higher relatively. The market places a 75% chance of a hike on Wednesday, while 17/18 economists surveyed by Bloomberg see the cash rate lifted by 25bp. Given that pricing, it seems there's scope for a short spike higher in the NZD if they hike, but the focus turns to the idea of a further four hikes priced in the coming two years – will the statement live up to that pricing?
I updated my debt ceiling piece on Friday. It’s interesting to look at the US Treasury bill market, notably in the maturities covering the period of anxiety. On Friday, the UST Bill 28/10/21 closed up 3bp, but traded a monster range of 13.75bp to 3.75bp. Is this the sign of things to come? I guess the first place to look for stress is the T-bill market and if yields spike then it could spill over into higher equity, gold and FX volatility too.
The drama is about to heat up, but with the DEMs able to pass or suspend the debt ceiling through Reconciliation one has to believe a default is a very low probability. Still, as I say in the article it doesn’t mean Congress doesn’t take this to the wire and markets wear an additional risk premium. Any commentary around this could be important and a potential opportunity to trade the event with Pepperstone.
Related articles
Ready to trade?
It's quick and easy to get started. Apply in minutes with our simple application process.
The material provided here has not been prepared in accordance with legal requirements designed to promote the independence of investment research and as such is considered to be a marketing communication. Whilst it is not subject to any prohibition on dealing ahead of the dissemination of investment research we will not seek to take any advantage before providing it to our clients.
Pepperstone doesn’t represent that the material provided here is accurate, current or complete, and therefore shouldn’t be relied upon as such. The information, whether from a third party or not, isn’t to be considered as a recommendation; or an offer to buy or sell; or the solicitation of an offer to buy or sell any security, financial product or instrument; or to participate in any particular trading strategy. It does not take into account readers’ financial situation or investment objectives. We advise any readers of this content to seek their own advice. Without the approval of Pepperstone, reproduction or redistribution of this information isn’t permitted.


