- 简体中文
- English
- 繁体中文
- Español
- Tiếng Việt
- ไทย
- Português
- لغة عربية
分析

For equities, this is apparently a relatively easy question to answer – higher. All three major US benchmarks – the S&P 500, Nasdaq 100, and Dow Industrials – closed at a record high on Friday, with the post-payrolls dip being aggressively bought, and a post-earnings rally in tech behemoths Amazon and Meta helping to support sentiment.
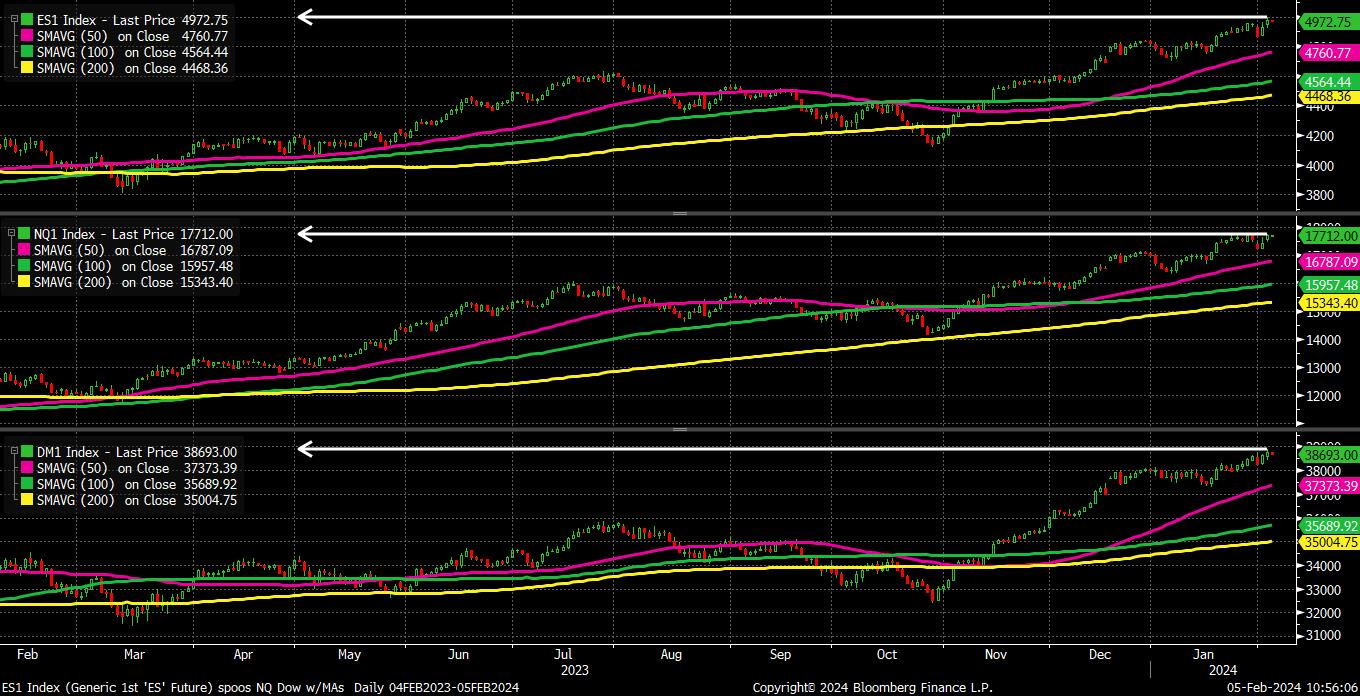
As often stated, there are few more bullish signs for a market than printing fresh record highs. While some may point to poor breadth, with only two S&P sectors – technology and industrials – having hit all-time highs along with the index, the speed and aggressiveness with which bulls bought the dip last Friday speaks volumes. For the first time in a while, the post-NFP reaction in risk assets suggests that we may be moving to a ‘good news is good news’ environment, where strong economic prints are treated as a positive for equities, rather than a headwind owing to hawkish policy implications.
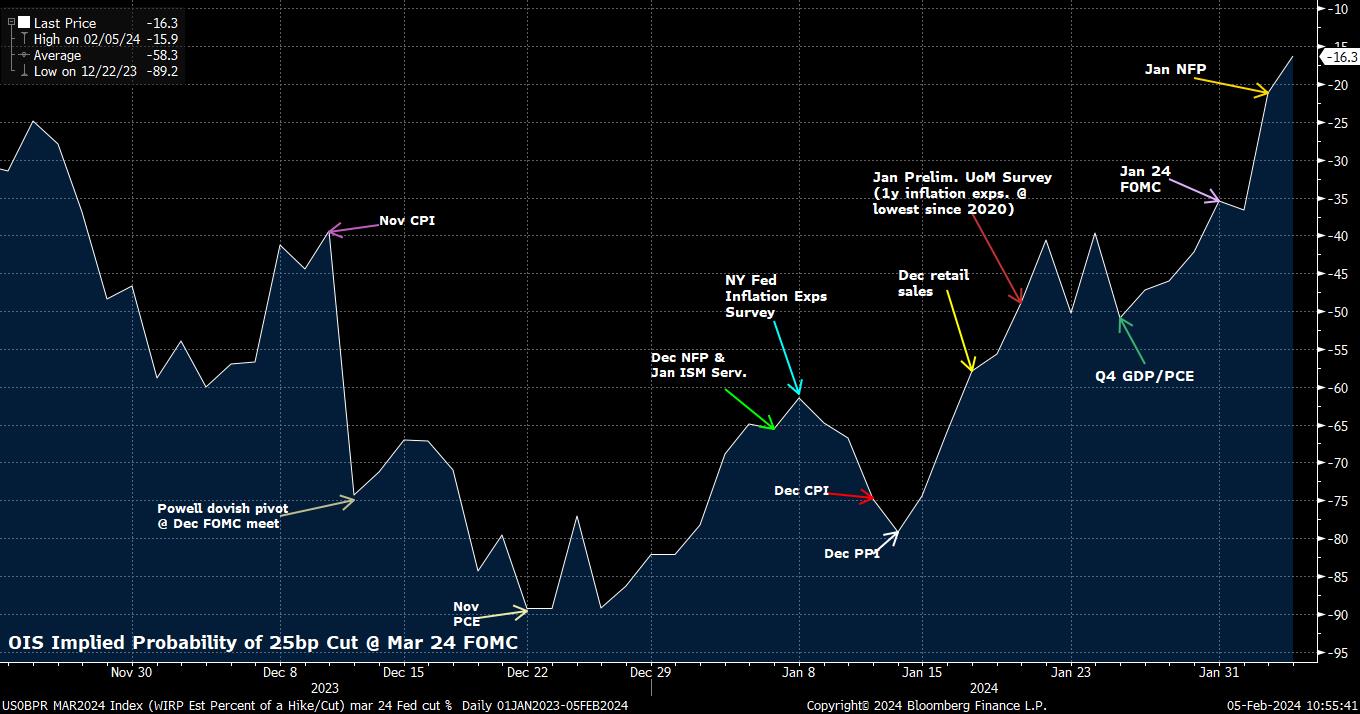
On that note, markets have now all-but-certainly waved goodbye to the chances of a 25bp Fed cut in March; the combination of Powell’s ‘not the base case’ pushback at Wednesday’s press conference, and the blowout jobs report, put paid to the doves’ hopes there.
While stocks have managed to shrug off this hawkish repricing, it has had a notable impact in the G10 FX space. The greenback kicks off the week at fresh YTD highs, per the DXY, with the index trading north of the 104 figure, and within touching distance of its 100-day moving average.
Having now notched 5 consecutive weekly gains, the longest such run since Q3 23, there is little to suggest that the greenback won’t notch a sixth, particularly as the ‘goldilocks’ macro narrative persists, and a ‘soft landing’ for the US economy becomes increasingly assured. A relatively crude overlay with the front-end and belly of the Treasury curve also shows little sign of the buck’s gains having become over-extended thus far.
_d_2024-02-05_10-54-26.jpg)
Of course, this bout of US economic optimism comes at a time when other DMs continue to face headwinds.
The final January PMI surveys pointed to a continued contraction in the eurozone – which faces intensifying downside growth/upside inflation risks from ongoing geopolitical tensions – while the China outlook remains dour, particularly after a rather vague weekend commitment from regulators to ‘stabilise’ markets lacked any detail whatsoever, and with investors continuing to await a ‘shock and awe’ fiscal stimulus package which seems unlikely to be forthcoming for now.
This is, unsurprisingly, also pressuring the AUD and the NZD, which continue to display a high-beta to developments in the world’s second largest economy. Frankly, a brief cross-check of the macro environment suggests little of any attractiveness besides the USD; perhaps, maybe, the JPY if one sees the BoJ standing as a hawkish outlier among G10 central banks, and expects Treasuries to rally over the medium-term.
While the fundamental outlook continues to point to further USD upside, particularly if the residual 4bp of easing priced for the March FOMC is priced out, the technical outlook is singing from a similar hymn sheet. Most G10 FX peers have, or are very close to, slipping beneath their respective 200-day moving averages, a classic and key gauge of longer-run momentum in the foreign exchange space.
_2024-02-05_10-53-58.jpg)
In a quiet week, like the one we have coming up, there will likely be little to derail the prevailing trend. In fact, further breaks of those fabled yellow lines on the above chart are likely to entice more trend-following dollar bulls to enter the fray, further extending recent moves.
Related articles
Pepperstone不保证这里提供的材料准确、最新或完整,因此不应依赖这些信息。这些信息,无论来自第三方与否,不应被视为推荐;或者买卖的要约;或者购买或出售任何证券、金融产品或工具的邀约;或者参与任何特定的交易策略。它不考虑读者的财务状况或投资目标。我们建议阅读此内容的任何读者寻求自己的建议。未经Pepperstone批准,不得转载或重新分发这些信息。