- 简体中文
- English
- 繁体中文
- Español
- Tiếng Việt
- ไทย
- Português
- لغة عربية
分析

原油现货 – 更高的水平开始影响风险
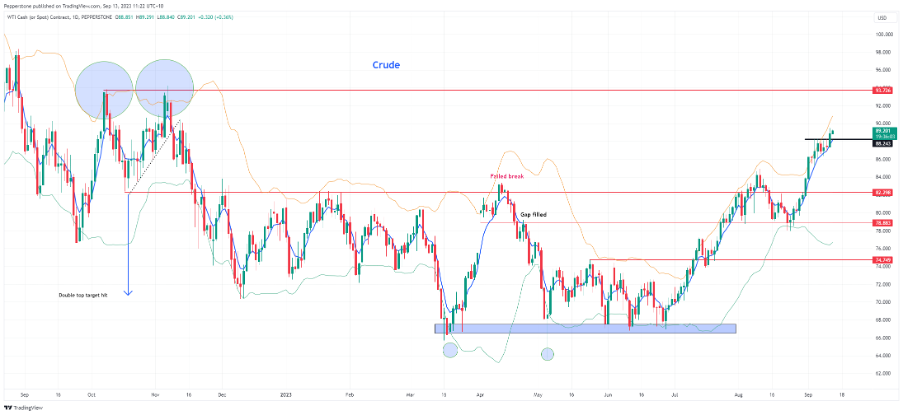
原油价格在这次的上涨势头中达到了更高水平。这一次上涨得益于OPEC发布的强劲预测,预计第四季度原油供应将出现330万桶/天的赤字。国际能源署(IEA)将在接下来的会议中提供更新,可以预期他们的预测将发生变化,因为他们之前曾预计赤字为23万桶/日。$90是多头头寸的明显整数目标,接下来是2022年10月的高点$93.52。尽管客户更倾向于卖出,目前已有61%的仓位是空仓,但原油的超买程度可能会引发进一步的均值回归。此后更高的水平可能会引发市场的担忧,因为我们看到通胀预期再次上升。
做多标普能源 / 做空(标普零售)(ETF - XLE / XRT)
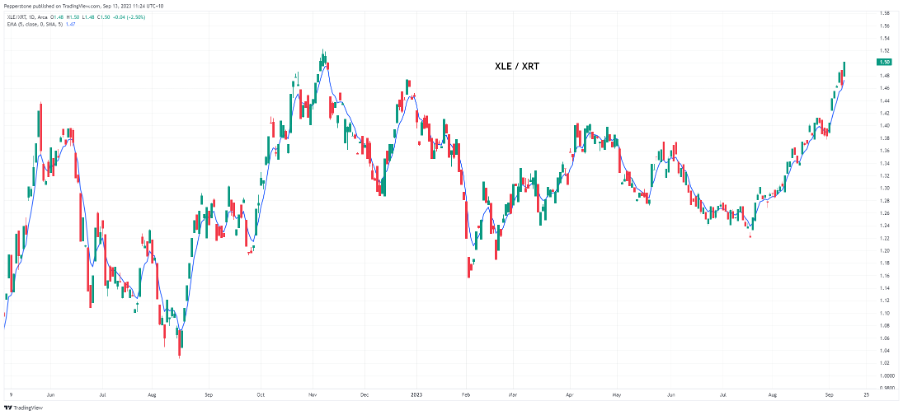
对于寻求原油替代标的的战术交易者,可以考虑查看我们在MT5平台上提供的一系列ETF。采用多空(或“配对”)策略是捕捉主题的一种方式,即做多您认为会表现优越的工具,同时做空认为表现不佳的工具。
通过进行比率分析(将一个工具除以另一个工具),我们可以轻松地将其表现可视化。TradingView非常适合进行这一操作。在这里,我使用了美国零售ETF(XRT)作为空头部分,因为较高的原油价格将导致消费者的生活成本上升,但也会增加美联储将维持更高利率的可能性。正如我们所看到的,与XRT相比,XLE ETF(标普500能源部门)已经表现出色——这个领域是否还有更多潜力?
XAUUSD – 卖方在美国CPI数据发布前占上风
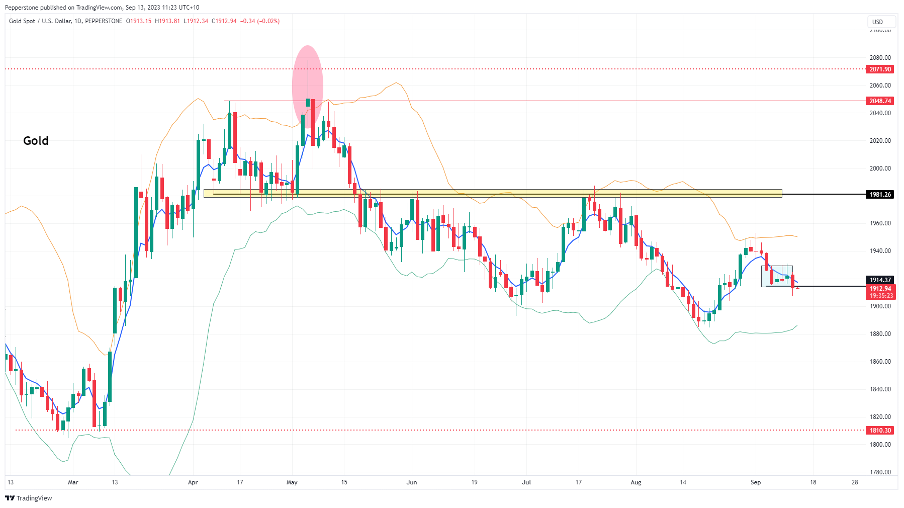
在较高的时间框架(日线图)上,价格走势表明卖方占据上风 - 价格低于5日指数移动平均线(EMA),经过3根K线的横向整理后,价格似乎要跌破这些低点。从理论上讲,原油价格上涨对黄金是不利的,因为它会对债券产生压力并推高收益率。因此,鉴于价格已经跌破1914美元,我们可以进一步观察较低时间框架,如果卖方再次占据优势,势头可能会导致1900美元和1884美元的出现。
美国 CPI – 黄金的指导方针
我们期待着美国消费者价格指数(CPI)数据发布(周二 22:30 AEST),市场共识预期为广义CPI月环比涨0.6%,而核心CPI月环比涨0.2%。市场会更加敏感并更加重视广义CPI数据还是核心CPI数据呢?
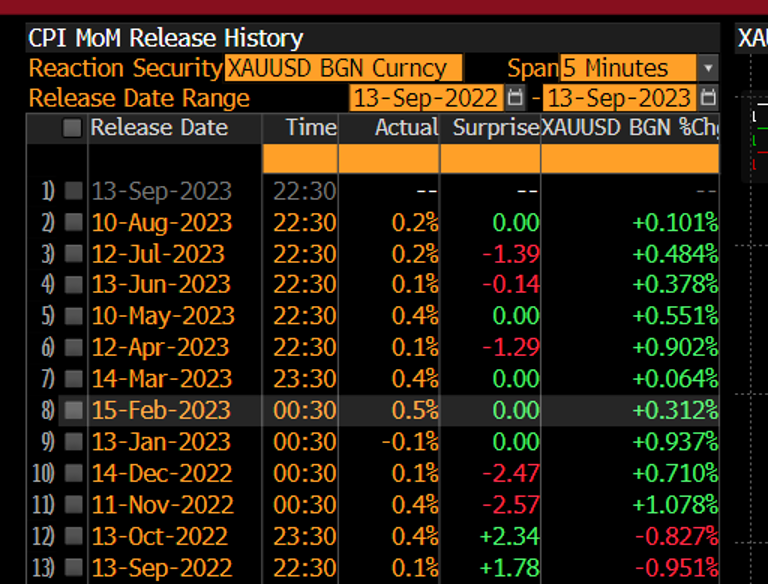
和往常一样,人们将会特别关注核心服务(不包括住房)部分(预计环比增长0.39%),这是美联储密切关注的指标,以及核心商品(环比下降0.22%)。有趣的是,我们注意到在过去10次美国CPI报告中,美元在公布后的5分钟内有9次出现下跌。我们还看到,在过去的10次CPI公告中,XAUUSD在5分钟和30分钟的时间段内均出现了上涨。这一次会有所不同吗?
CADJPY – 持有至 109.50
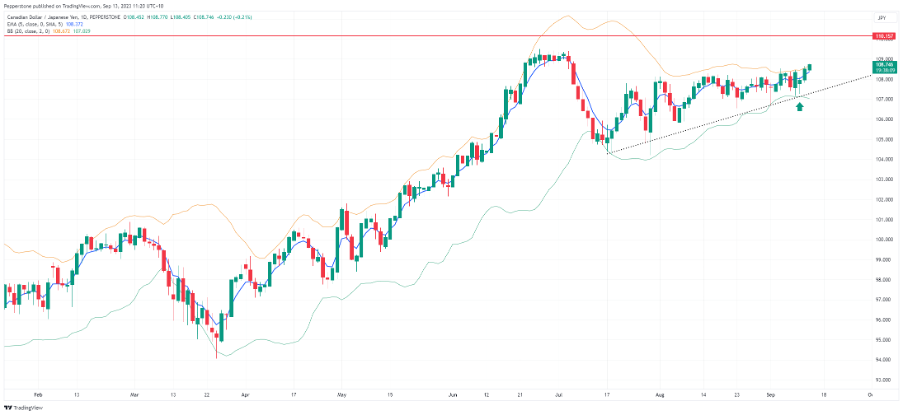
尽管挪威克朗(NOK)与布伦特原油和WTI原油具有最强的统计关系,但我们可以看到原油与加元之间的相关性正在增强。我们可以看到原油与加元/日元(CADJPY)之间的1个月相关性为0.68,因此相关性是显著的。此外,我们还可以看到(在日线上)价格突破了近期的108.50区间的顶部。虽然考虑到日本央行(BoJ)干预风险,许多人担心持有日元空头头寸,但目前,由于波动性较低,交易员仍然愿意做空日元,因为利差交易仍然具有吸引力。此外,随着原油价格的上涨,市场认为这有利于加拿大的贸易条件,但对日本的经济产生了负面影响,因为他们是能源的大量进口国。愿意持有至109.50,设定止损在每日收盘价低于5日指数移动平均线(5-Day EMA)时触发。
Related articles

Pepperstone不保证这里提供的材料准确、最新或完整,因此不应依赖这些信息。这些信息,无论来自第三方与否,不应被视为推荐;或者买卖的要约;或者购买或出售任何证券、金融产品或工具的邀约;或者参与任何特定的交易策略。它不考虑读者的财务状况或投资目标。我们建议阅读此内容的任何读者寻求自己的建议。未经Pepperstone批准,不得转载或重新分发这些信息。