- 中文版
- English
分析

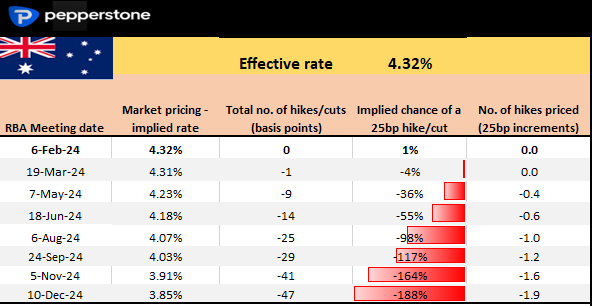
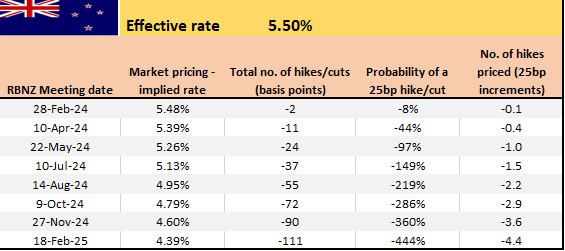
Looking ahead to 2024 from a rates perspective, I observe 90 basis points of cuts priced into NZD rates and 47 basis points into AUD rates, with this trend showing a modest shift in favour of AUD appreciation. Drilling in I see the first cut priced into AUS swaps set for August, with the RBNZ expected to start easing in May.
AUS & NZ swaps pricing per meeting
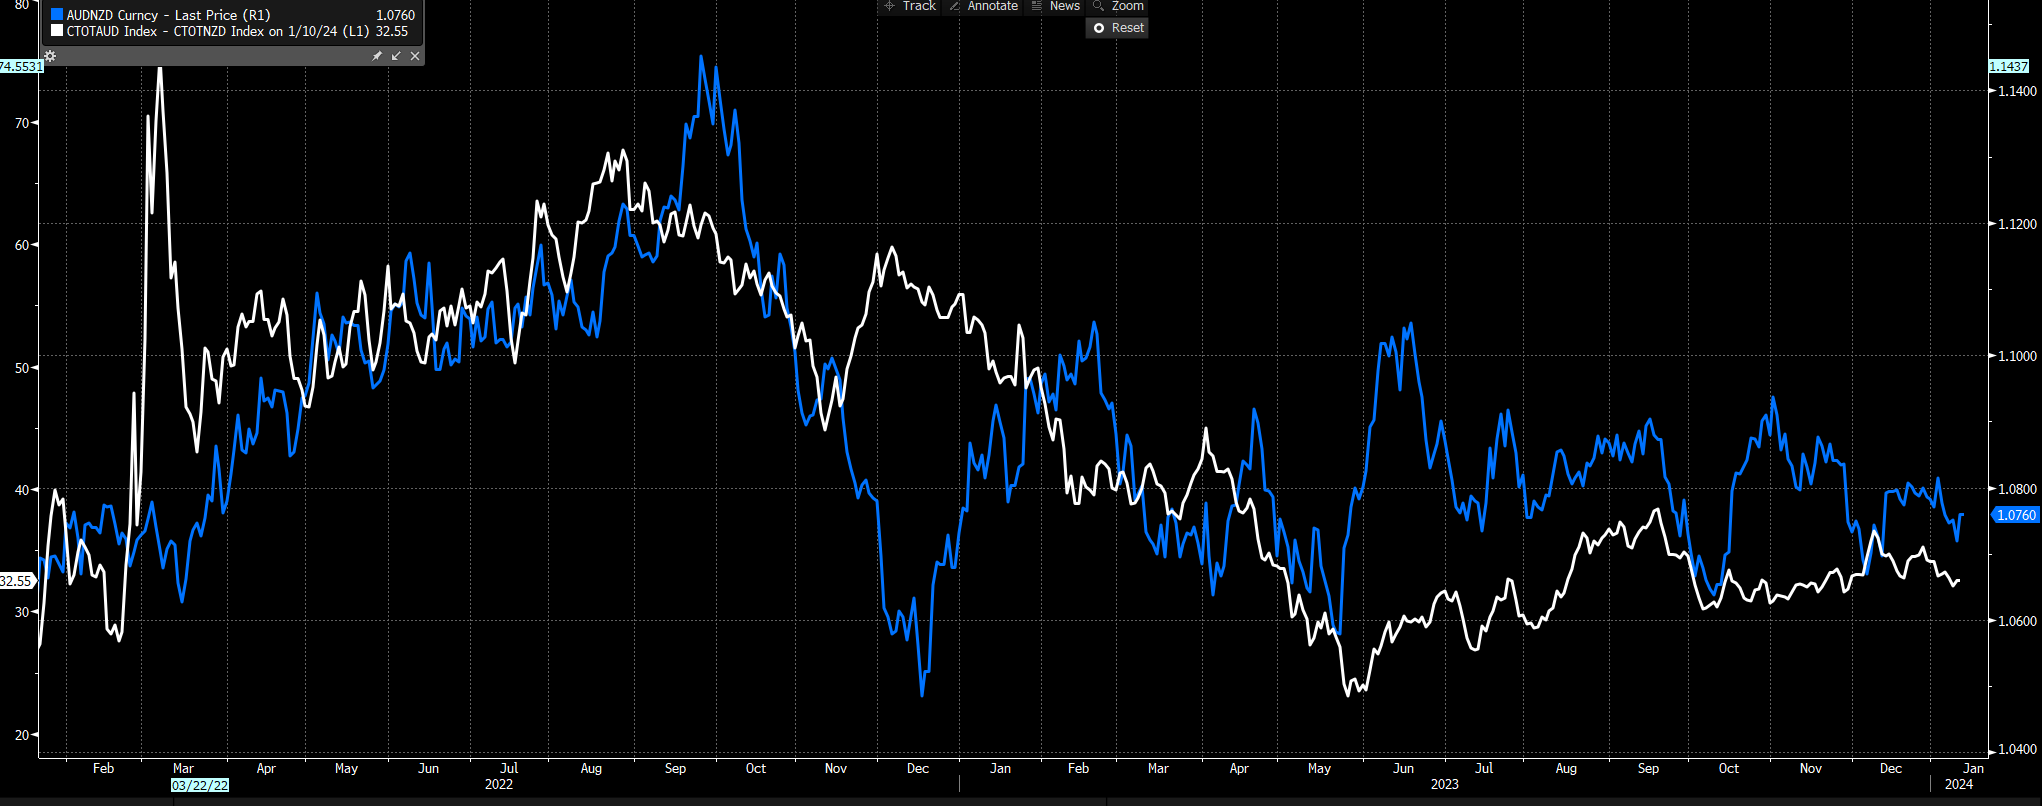
Tactically, both currencies are sensitive to China's news and data, and will often follow copper, China A50 index or CNH (yuan). Both currencies feed off the risk on/risk off theme, so when the NAS100 or US500 rally, we see the AUD &NZD follow suit. So, the move in AUDNZD really comes on relative economic trends and growth differentials – this appeals to certain strategies, especially those running mean reversion strategies.
In recent times Australian data has had a better form of beating consensus expectations than New Zealand data.
I can also look at relative terms of trade (the chart shows AUS-NZD terms of trade indices) with NZ terms of trade having outperformed of late, which favours modest AUDNZD downside – however, I would caution against reading too much into this given there is little correlation.
Technicals
Growth aside, we get trends in AUDNZD when we see diverging paths in central bank policy – we saw that in Sept 2022 to Dec 2022, resulting in a move from 1.1464 to 1.0500. As it stands, we see both central banks holding a similar mantra which partly explains the chop in the price action.
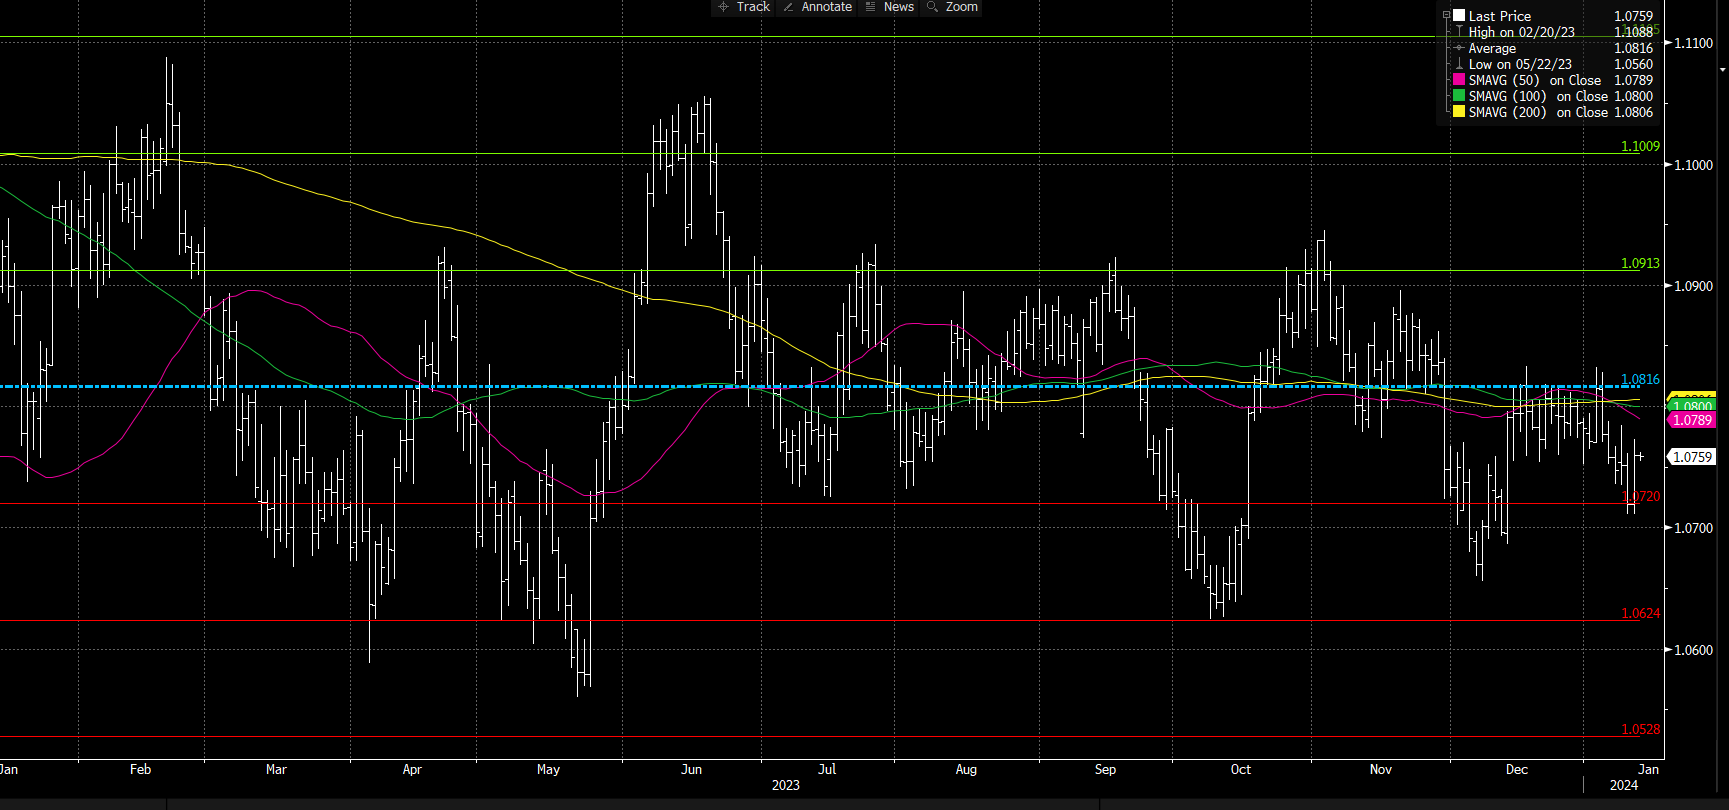
Looking big picture, we see price reverting to the 12-month average. I’ve added 1 and 2 standard deviations to this to show the extent of the moves from the average. While I wouldn’t trade off this concept in isolation, it gives a sense of when potential turning points could be – right now it feels like we could see price pull to the average at 1.0816. We can also look at this through Bollinger Bands and adapting to a 252-day count – the set up shows just how good this can be for mean reversion traders – albeit one should wait for price to reach extremes.
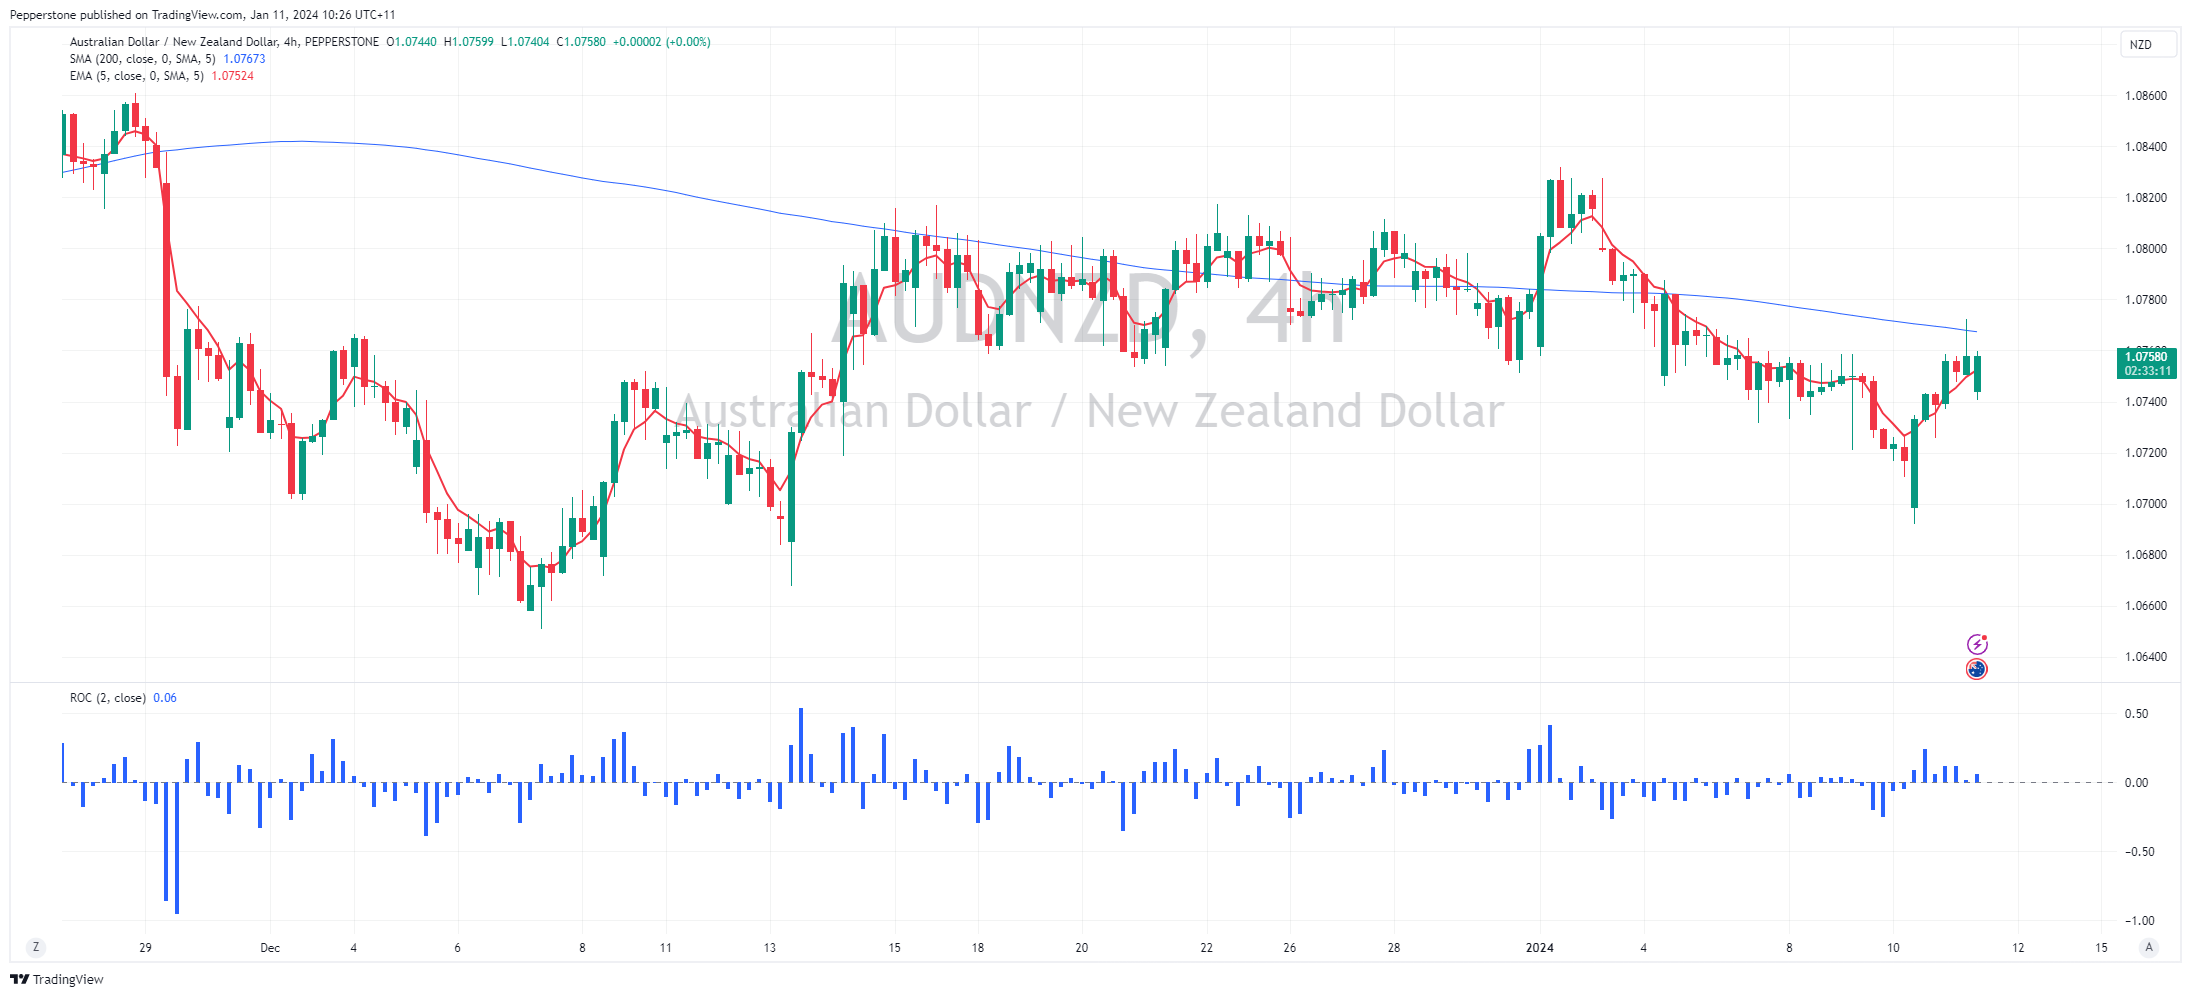
Shorter-term, yesterday’s bar just stopped shy of a bullish outside day, so I’d argue the bulls have a small advantage here. On the 4-hour chart, there’s been a fair bid from below 1.0700, so this would be where I’d define my risk on longs. If long I’d want to see another run through 1.0960 and jump on with the view that momentum could take this higher, but the upside seems capped at 1.0800 or so.
I like trends myself – and while we can drill into very low timeframes to get these – on the higher timeframes this is one where mean reversion is arguably the way to go.
Catalysts?
AUS – Not a lot of tier 1 data on the horizon, so I’d be looking more closely at Chinese data. We get the Aussie jobs report on 18 Jan and Q4 CPI on 31 Jan. The RBA meeting falls on 6 Feb, with the market pricing a 0% probability of a hike.
NZ – The next RBNZ meeting is on 28 Feb, but the market says hikes are not even a chance; it's about the timing of the first cut. Q4 CPI comes on 24 Jan, and that is the next tier 1 event risk.
Related articles


此处提供的材料并未按照旨在促进投资研究独立性的法律要求进行准备,因此被视为营销沟通。虽然它并不受到在投资研究传播之前进行交易的任何禁令,但我们不会在向客户提供信息之前谋求任何优势。
Pepperstone并不保证此处提供的材料准确、及时或完整,因此不应依赖于此。无论是来自第三方还是其他来源的信息,都不应被视为建议;或者购买或出售的要约;或是购买或出售任何证券、金融产品或工具的征求;或是参与任何特定交易策略。它并未考虑读者的财务状况或投资目标。我们建议此内容的读者寻求自己的建议。未经Pepperstone批准,不得复制或重新分发此信息。