
Before getting on to that, however, it’s necessary to delve into the weeds of bond maths, and outline some definitions.
As noted above, duration is a mathematical concept that refers to the sensitivity of an asset – typically a bond – to changes in interest rates; the higher the duration, the more sensitive an asset is to shifts in rates, and vice versa. Bond duration is relatively easy to measure, as fixed income products pay a regular amount, on a fixed schedule, for the life of the instrument. In contrast, equities do not necessarily pay a regular amount on a regular timescale, with said payments instead being constructed as dividends, which are paid subject to a company’s performance and financial situation at a given time. With this in mind, one could consider equity duration as a measure of how long an investor must receive dividends in order to be repaid the purchase price of the stock. It is that irregularity of cash flows that makes equity duration difficult to measure and means that, at best, it is only possible to approximate a value for such a concept.
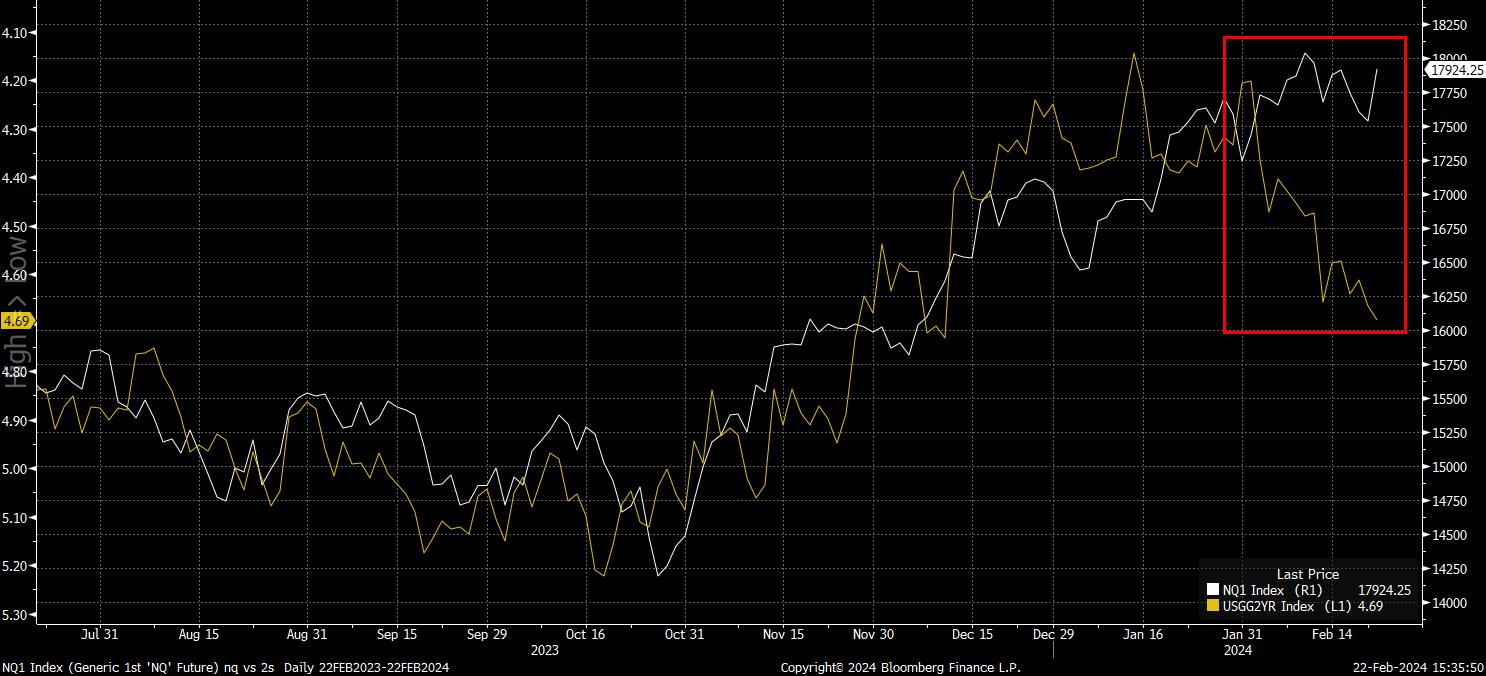
With all of that said and done, there are ways that one is able to gauge the relationship between equities and fixed income. At a, perhaps, crude level, a simple overlay chart helps to paint a picture – as shown below, the inverse relationship (2s are on an inverted Y-axis here) between front-end rates and the Nasdaq 100 has broken down since the end of January.
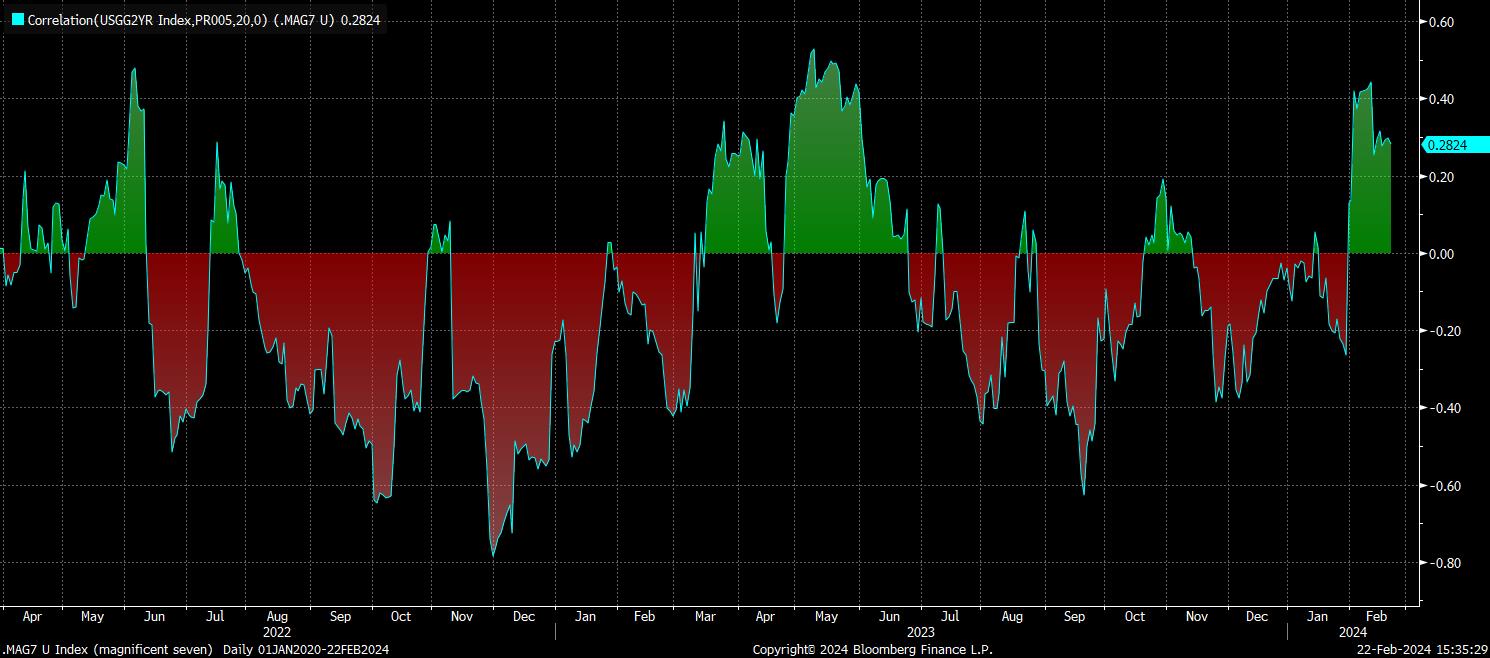
Alternatively, for those of a statistical persuasion, one can look at the correlation between equity and bond prices. This is exactly what I’ve done below, in examining the 20-day correlation between a market-cap weighted index of ‘magnificent seven’ stocks, and the 2-year Treasury yield.
As is easy to see, the correlation between the two has flipped positive over the last few weeks, implying that stocks and bonds are now moving in the opposite direction to each.
In any case, while all this is interesting, it means little on its own without considering the implications of such a shift.
The first is that, in contrast to what has been the prevailing logic for some time now, higher real rates may not in fact prove to be the headwind to risk that we have expected. However, on the same note, there is perhaps a case to be made that lower real rates, which are likely to prevail as central banks ease policy as the year progresses, may not prove to be as much of a boon for the tech sector as in prior cycles. Despite this, the broader policy backdrop should remain supportive for risk, with the central bank put remaining alive, and more flexible than before.
On a similar note, it could also be argued that the broader market is, perhaps, less exposed to any potential resurgence in inflation, or stickier-than-expected price pressures, owing to the less rate-sensitive nature of the market’s most dominant sector.
The final significant conclusion from all this, particularly after NVDA earnings yesterday, the tech behemoths have proved that they are able to deliver on earnings expectations, and in many cases vastly surpass said estimates, no matter the interest rate environment. Of course, this is much more of a longer-term consideration for the sector, though does bode well for longer-run profitability.
Related articles


此处提供的材料并未按照旨在促进投资研究独立性的法律要求进行准备,因此被视为营销沟通。虽然它并不受到在投资研究传播之前进行交易的任何禁令,但我们不会在向客户提供信息之前谋求任何优势。
Pepperstone并不保证此处提供的材料准确、及时或完整,因此不应依赖于此。无论是来自第三方还是其他来源的信息,都不应被视为建议;或者购买或出售的要约;或是购买或出售任何证券、金融产品或工具的征求;或是参与任何特定交易策略。它并未考虑读者的财务状况或投资目标。我们建议此内容的读者寻求自己的建议。未经Pepperstone批准,不得复制或重新分发此信息。