- 中文版
- English
分析
American Exceptionalism Supports the USD - Where is the Dollar Headed?

Before we address specific levels of the dollar against its main counterparts, it is important to know what has been happening in the USD and the main dynamics that have been impacting it.
While we can do this in extensive and complex ways, this can also be illustrated quite simply in a single chart and is made up of four key moments in the USD.
4 Key Stages USD
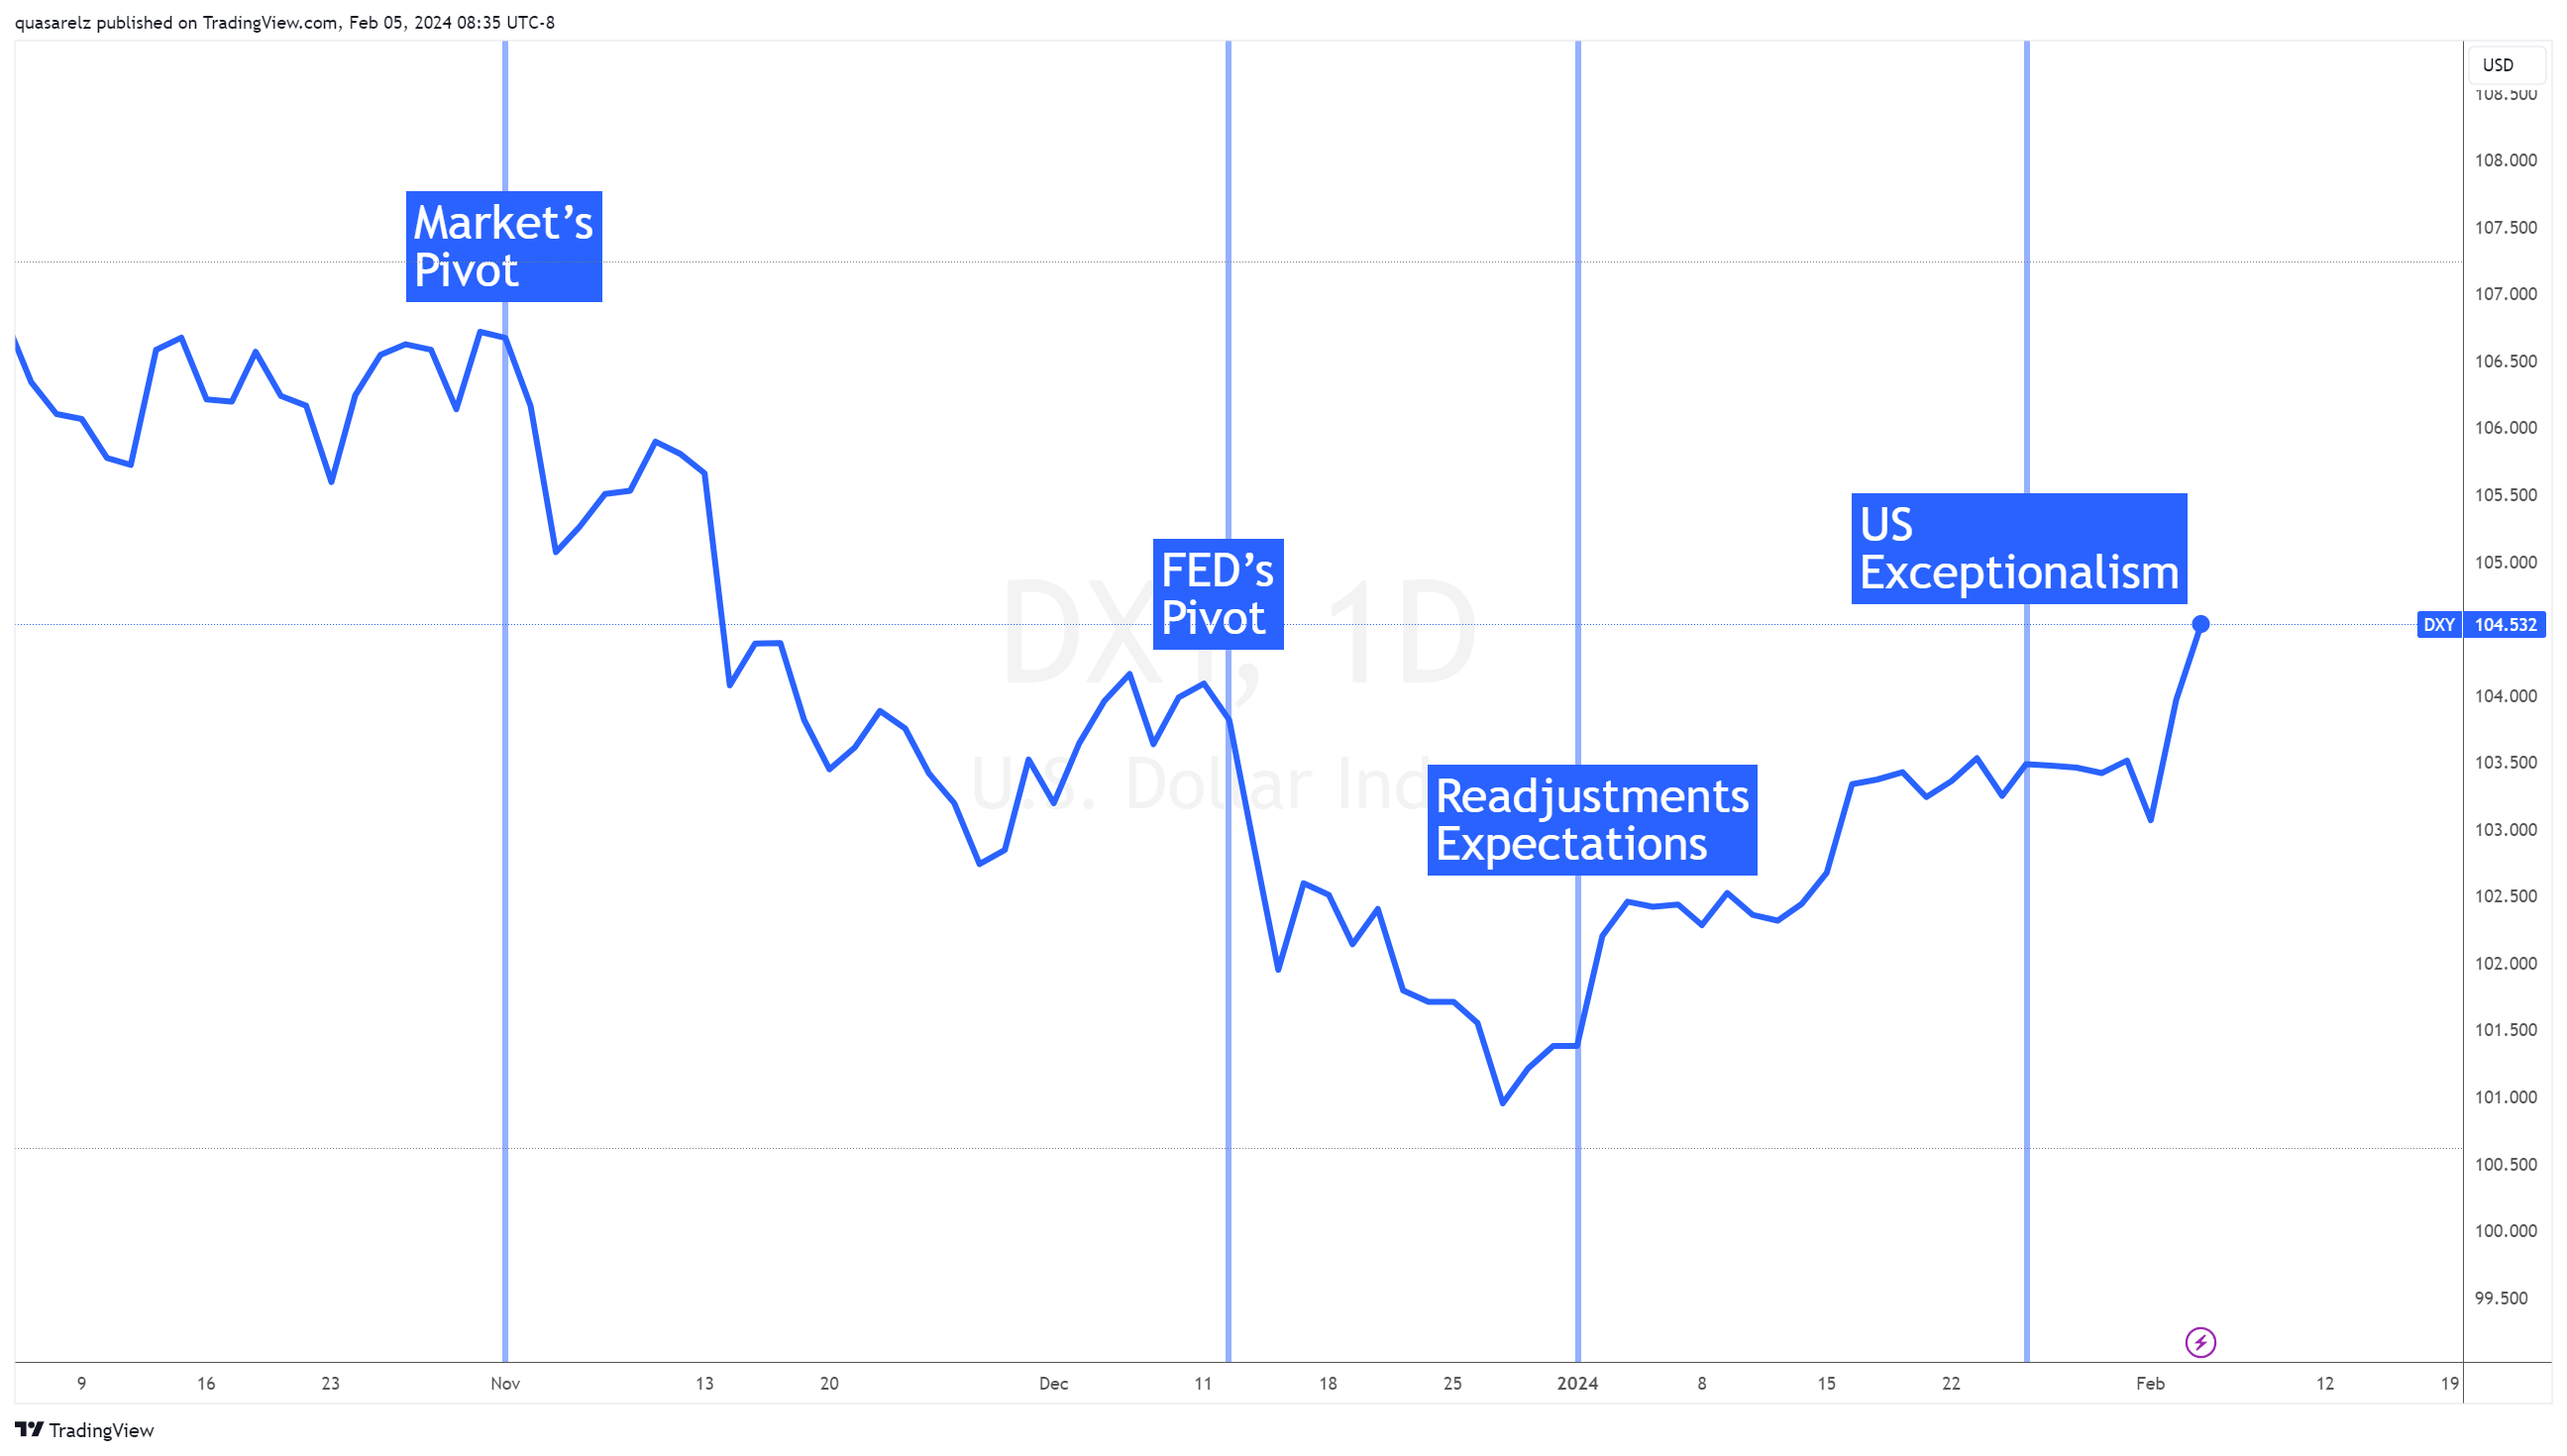
Let's briefly look into these stages:
Markets Pivot
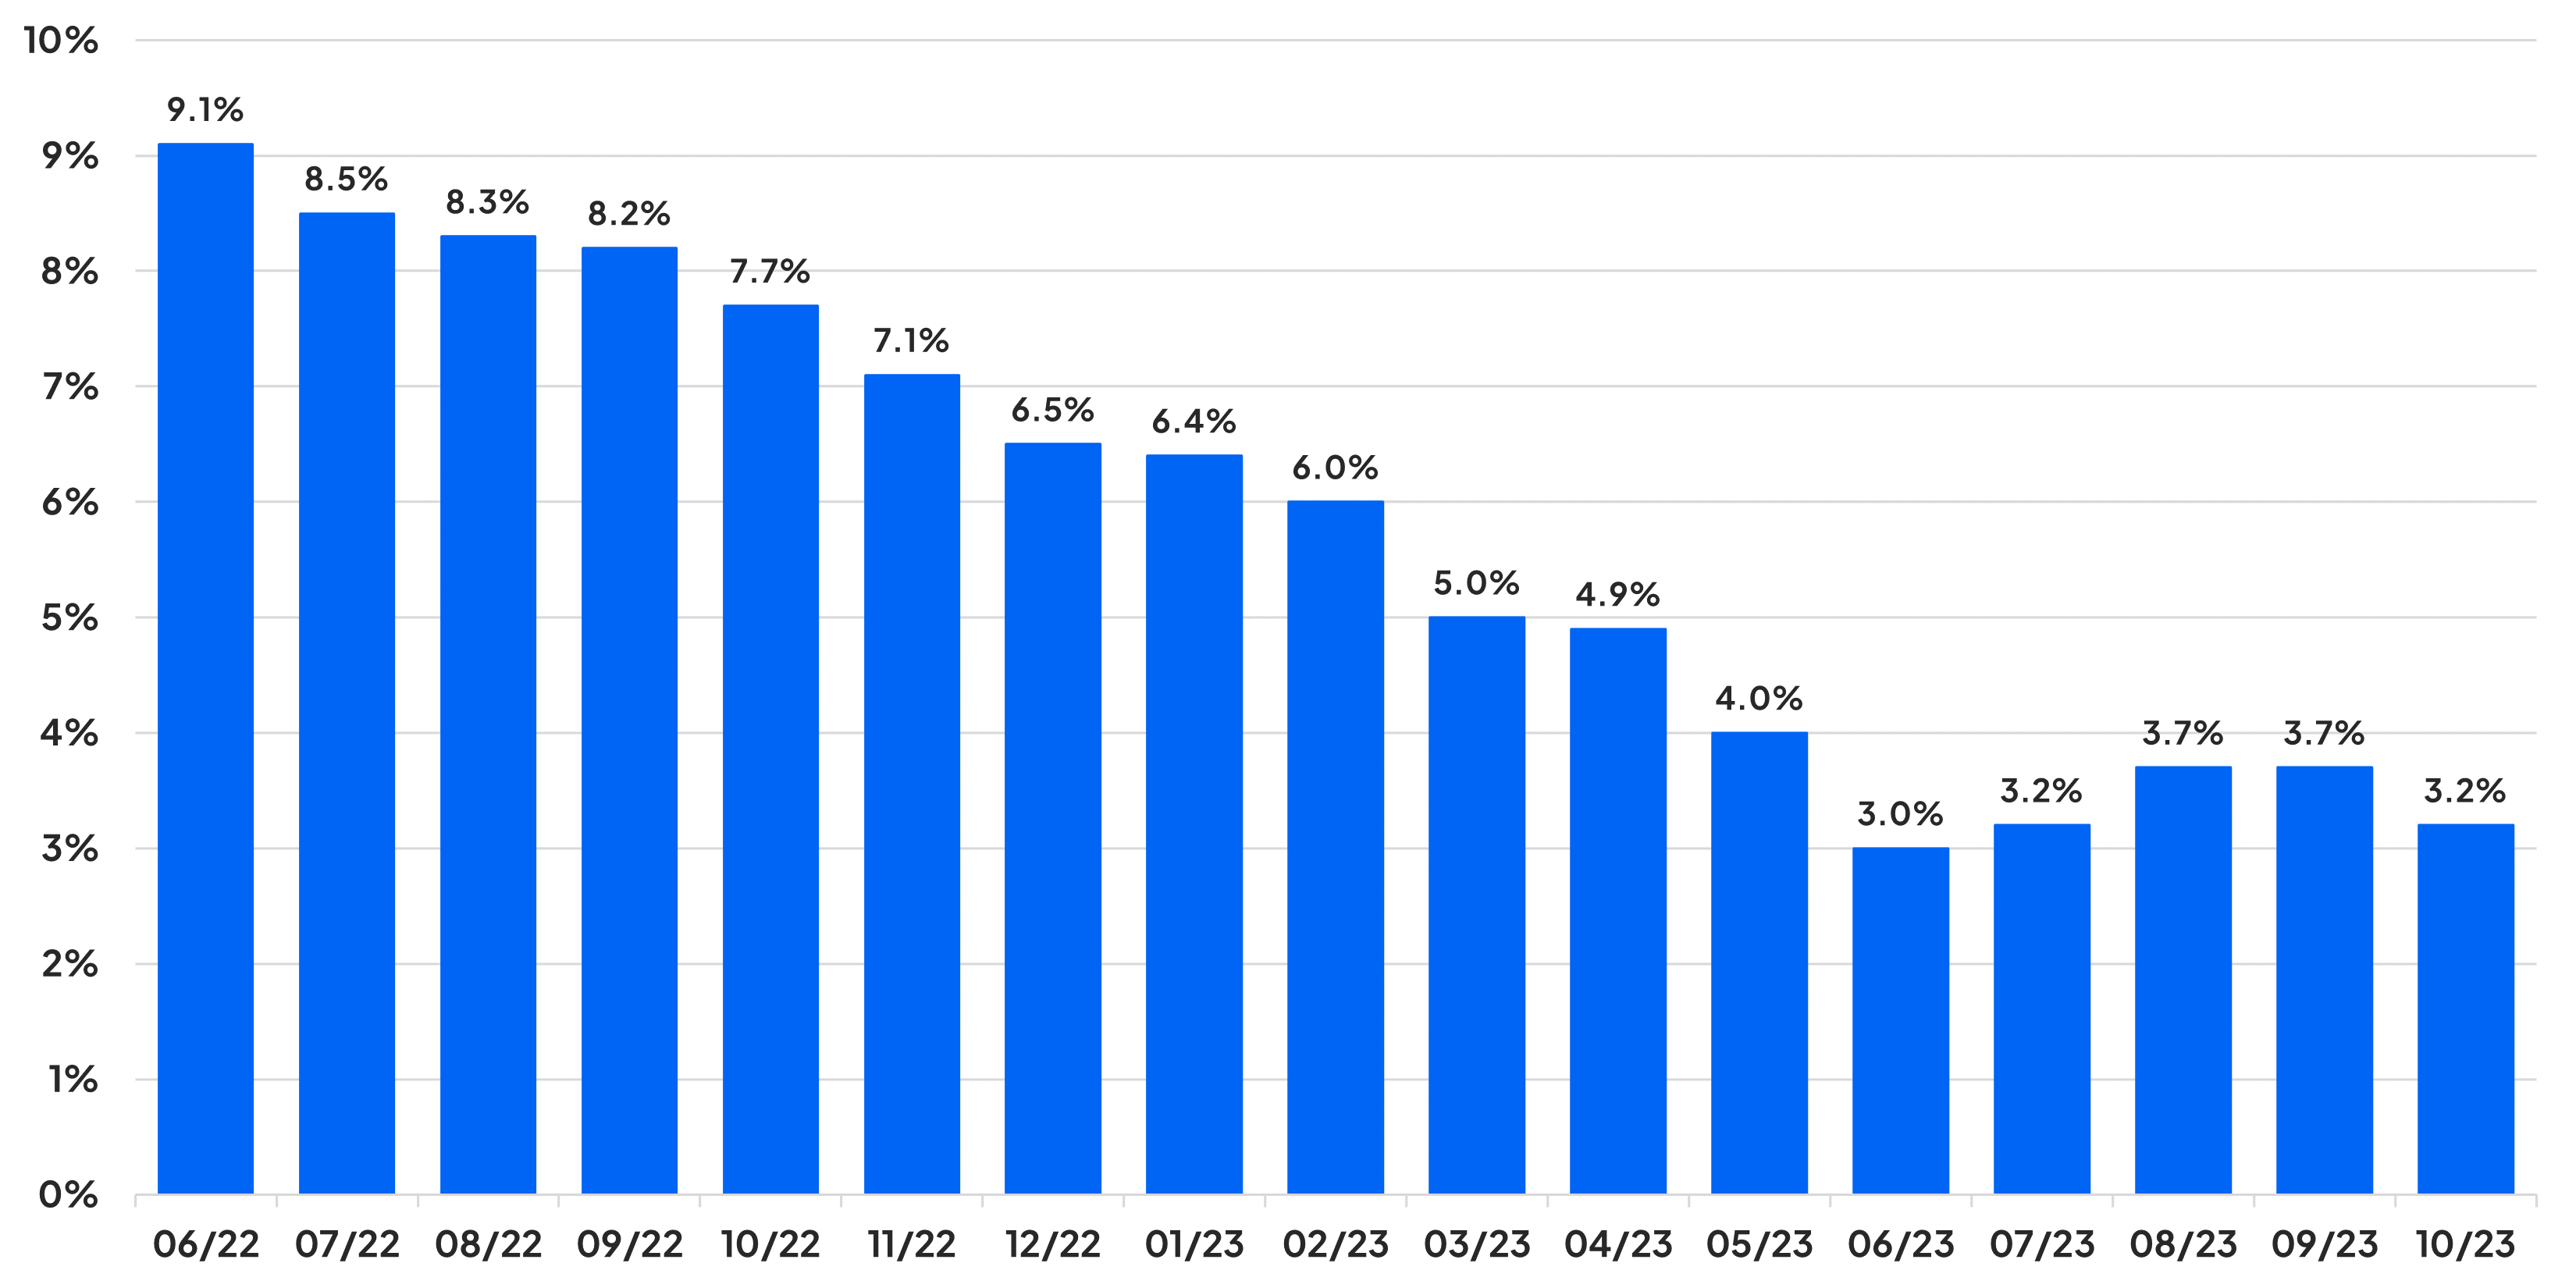
As we remember, November was key for the USD since this, in a simple way, represented the month where the markets pivoted towards a profile where the FED had finished increasing rates and in turn began to visualize cuts for the future. More specifically, during November we saw how inflation, after accelerating from the June lows, returned to the disinflationary path, where at that time, the CPI in the US fell to levels of 3.2%. Additionally, although this figure was later adjusted upwards, the NFP data for October recorded the second worst job creation since the lows of the pandemic, a factor which also supported markets to begin betting on rate cuts.
NFP October
CPI October
FED Pivot
As the month of December unfolded, and as the last FOMC meeting of 2023 arrived, based largely on the data that previously supported the markets pivot, the FED also made its own pivot, where at that time the FOMC put an end to the prospects of additional increases and according to the dot map, it reflected a vision where 2024 would see 3 rate cuts.
Adjustments Expectations
Although both parties changed their perspective to one aimed at cuts, the magnitude of these, we could say, differed somewhat, which led us to the next stage of readjusting of expectations. Where the markets were pointing towards 6 cuts of 25 bp, the FED had a more conservative vision, where in much of January we saw a considerable campaign by those in charge of monetary policy seeking to emphasize that, what the markets expected, was somewhat out of line. As markets reduced expectations of cuts, this supported the greenback.
US Exceptionalism
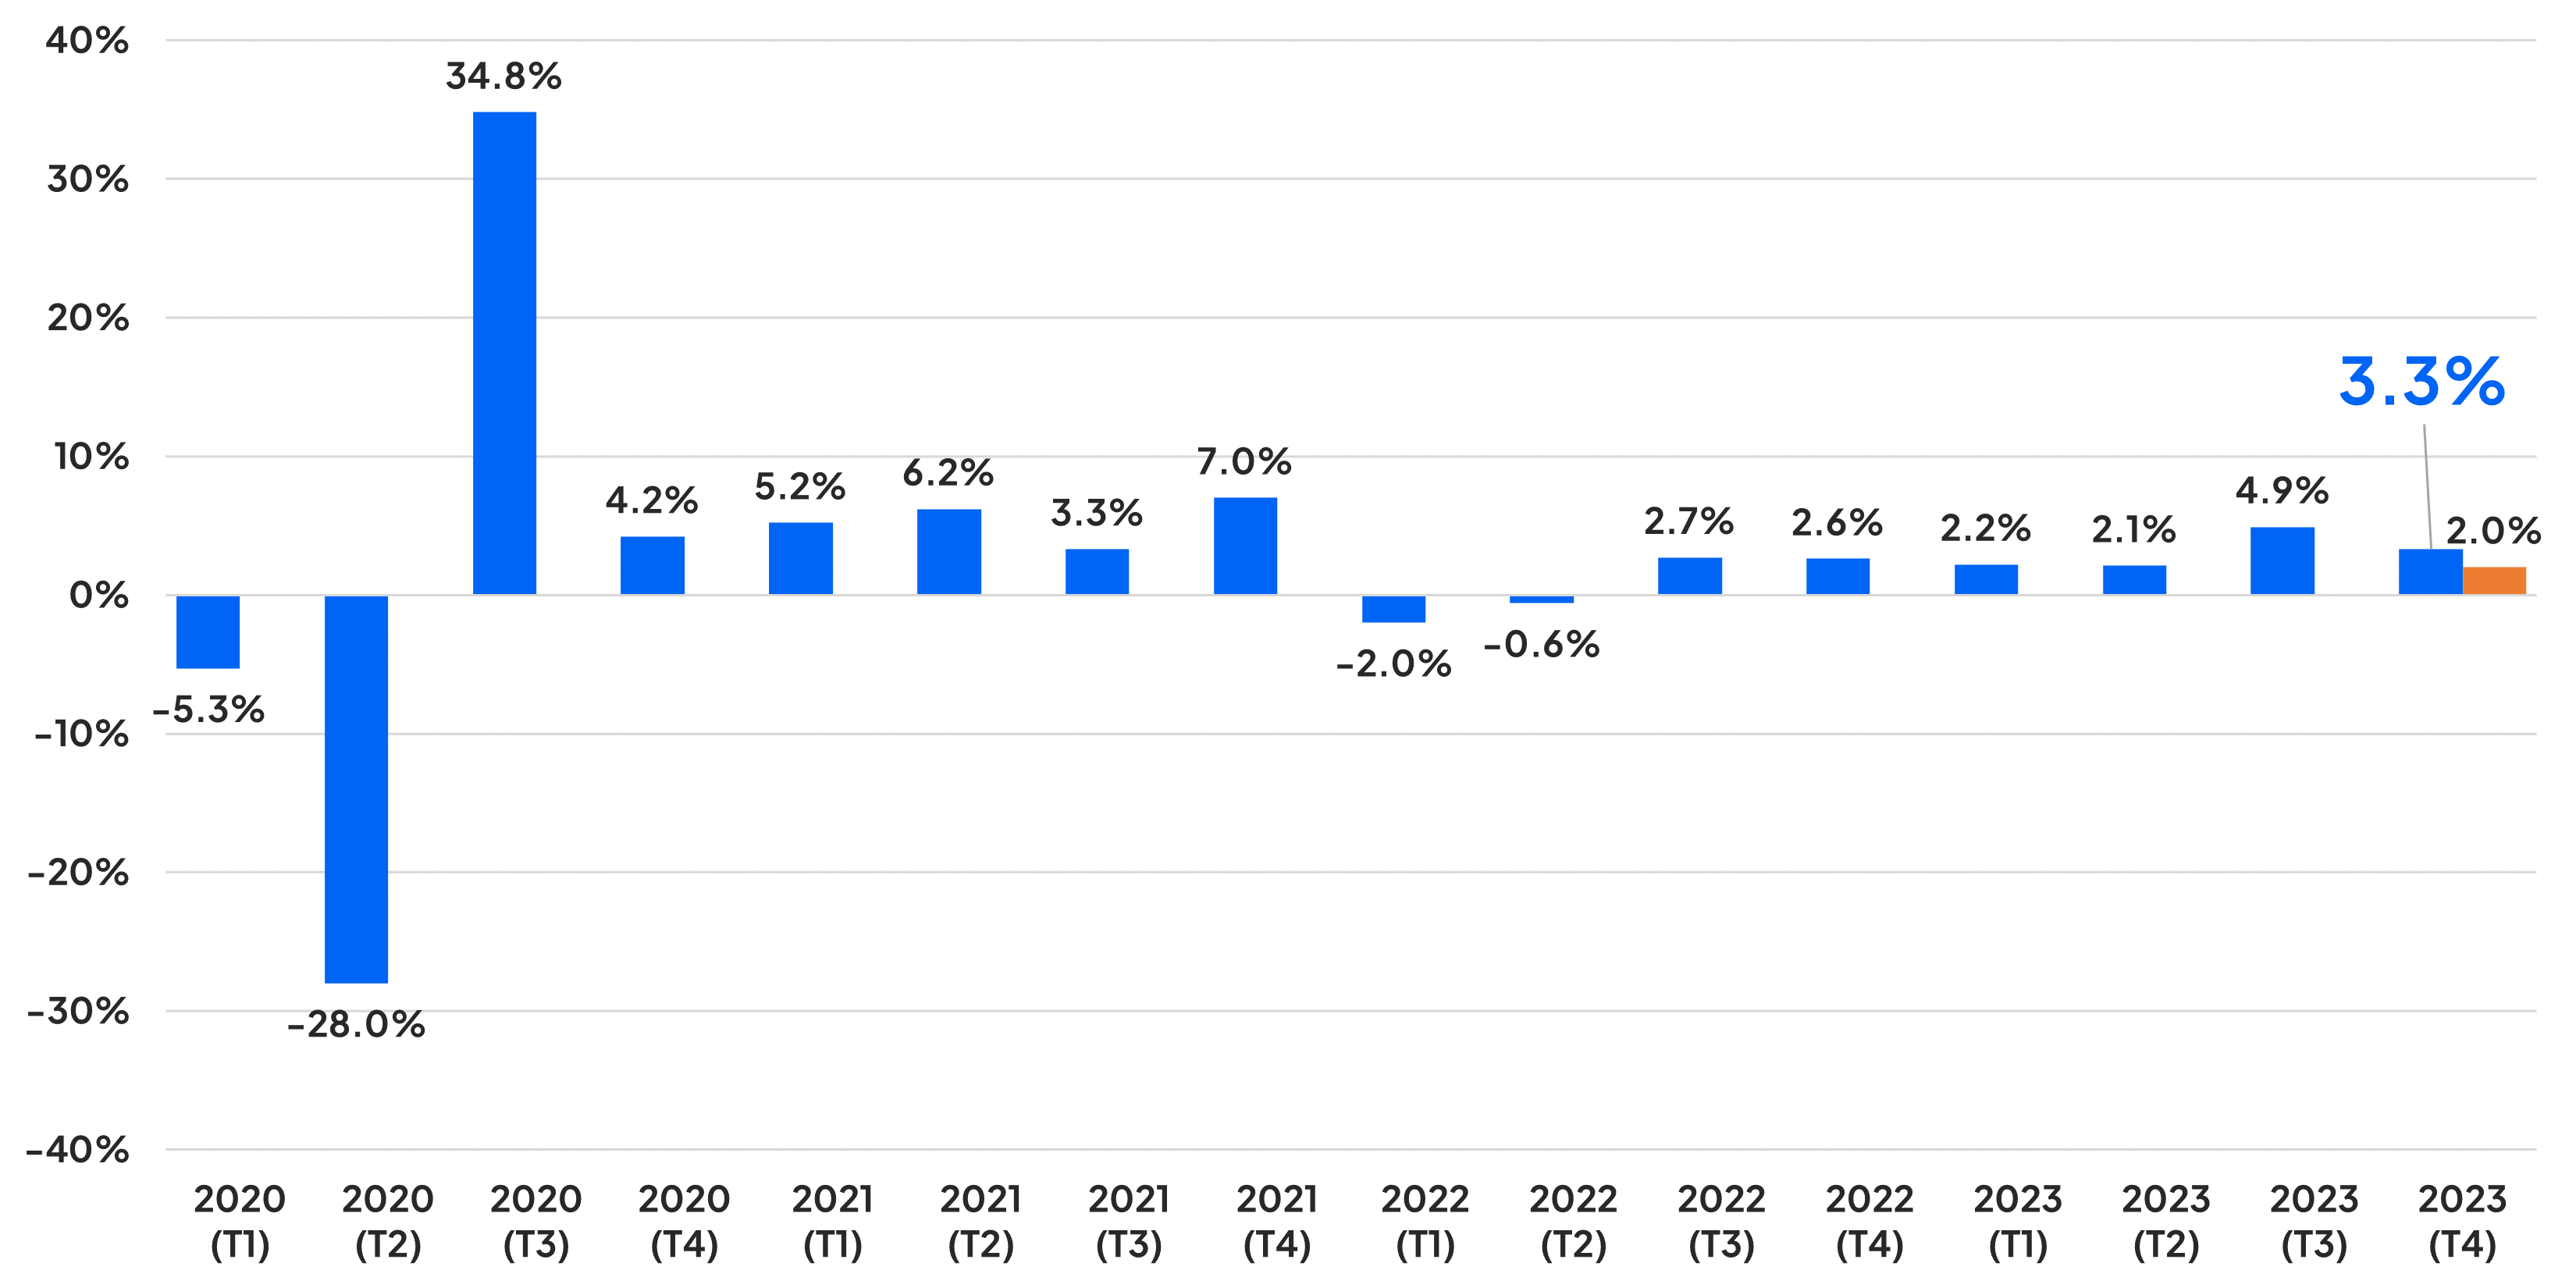
In the most recent stage of the USD, the “exceptionalism” of the US economy is playing a key role and supporting the dollar. As we remember, we have recently seen positive and better than expected economic data across the board from the American economy.
As a summary, in recent weeks we have seen a US economy present a GDP of economic growth widely above market expectations, an NFP almost double of what was expected, a manufacturing PMI return to expansion territory and a services PMI register a greater acceleration than stipulated.
US GDP
NFP
Here is the video I prepared last week showcasing the NFP results. (Content is in Spanish, but there are English subtitles available through YouTube's closed captioning feature.)
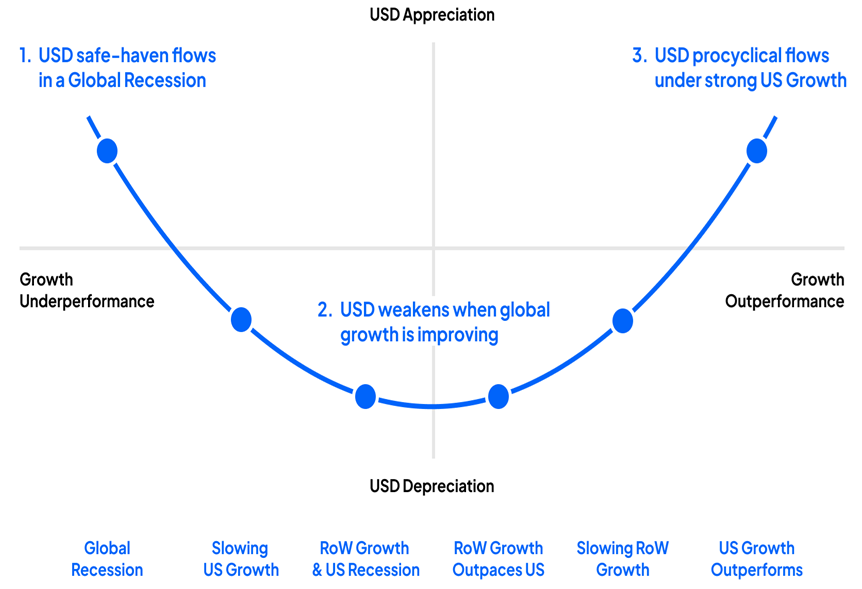
This has obviously impacted the need for imminent rate cuts and, in turn, in the midst of a global economy which is in multiple areas is looking quite slow, making the North American front shine even more. Here the smile theory can serve as a guide to how the USD tends to behave in these moments.
Discover trading opportunities with Pepperstone
USD smile theory
DXY
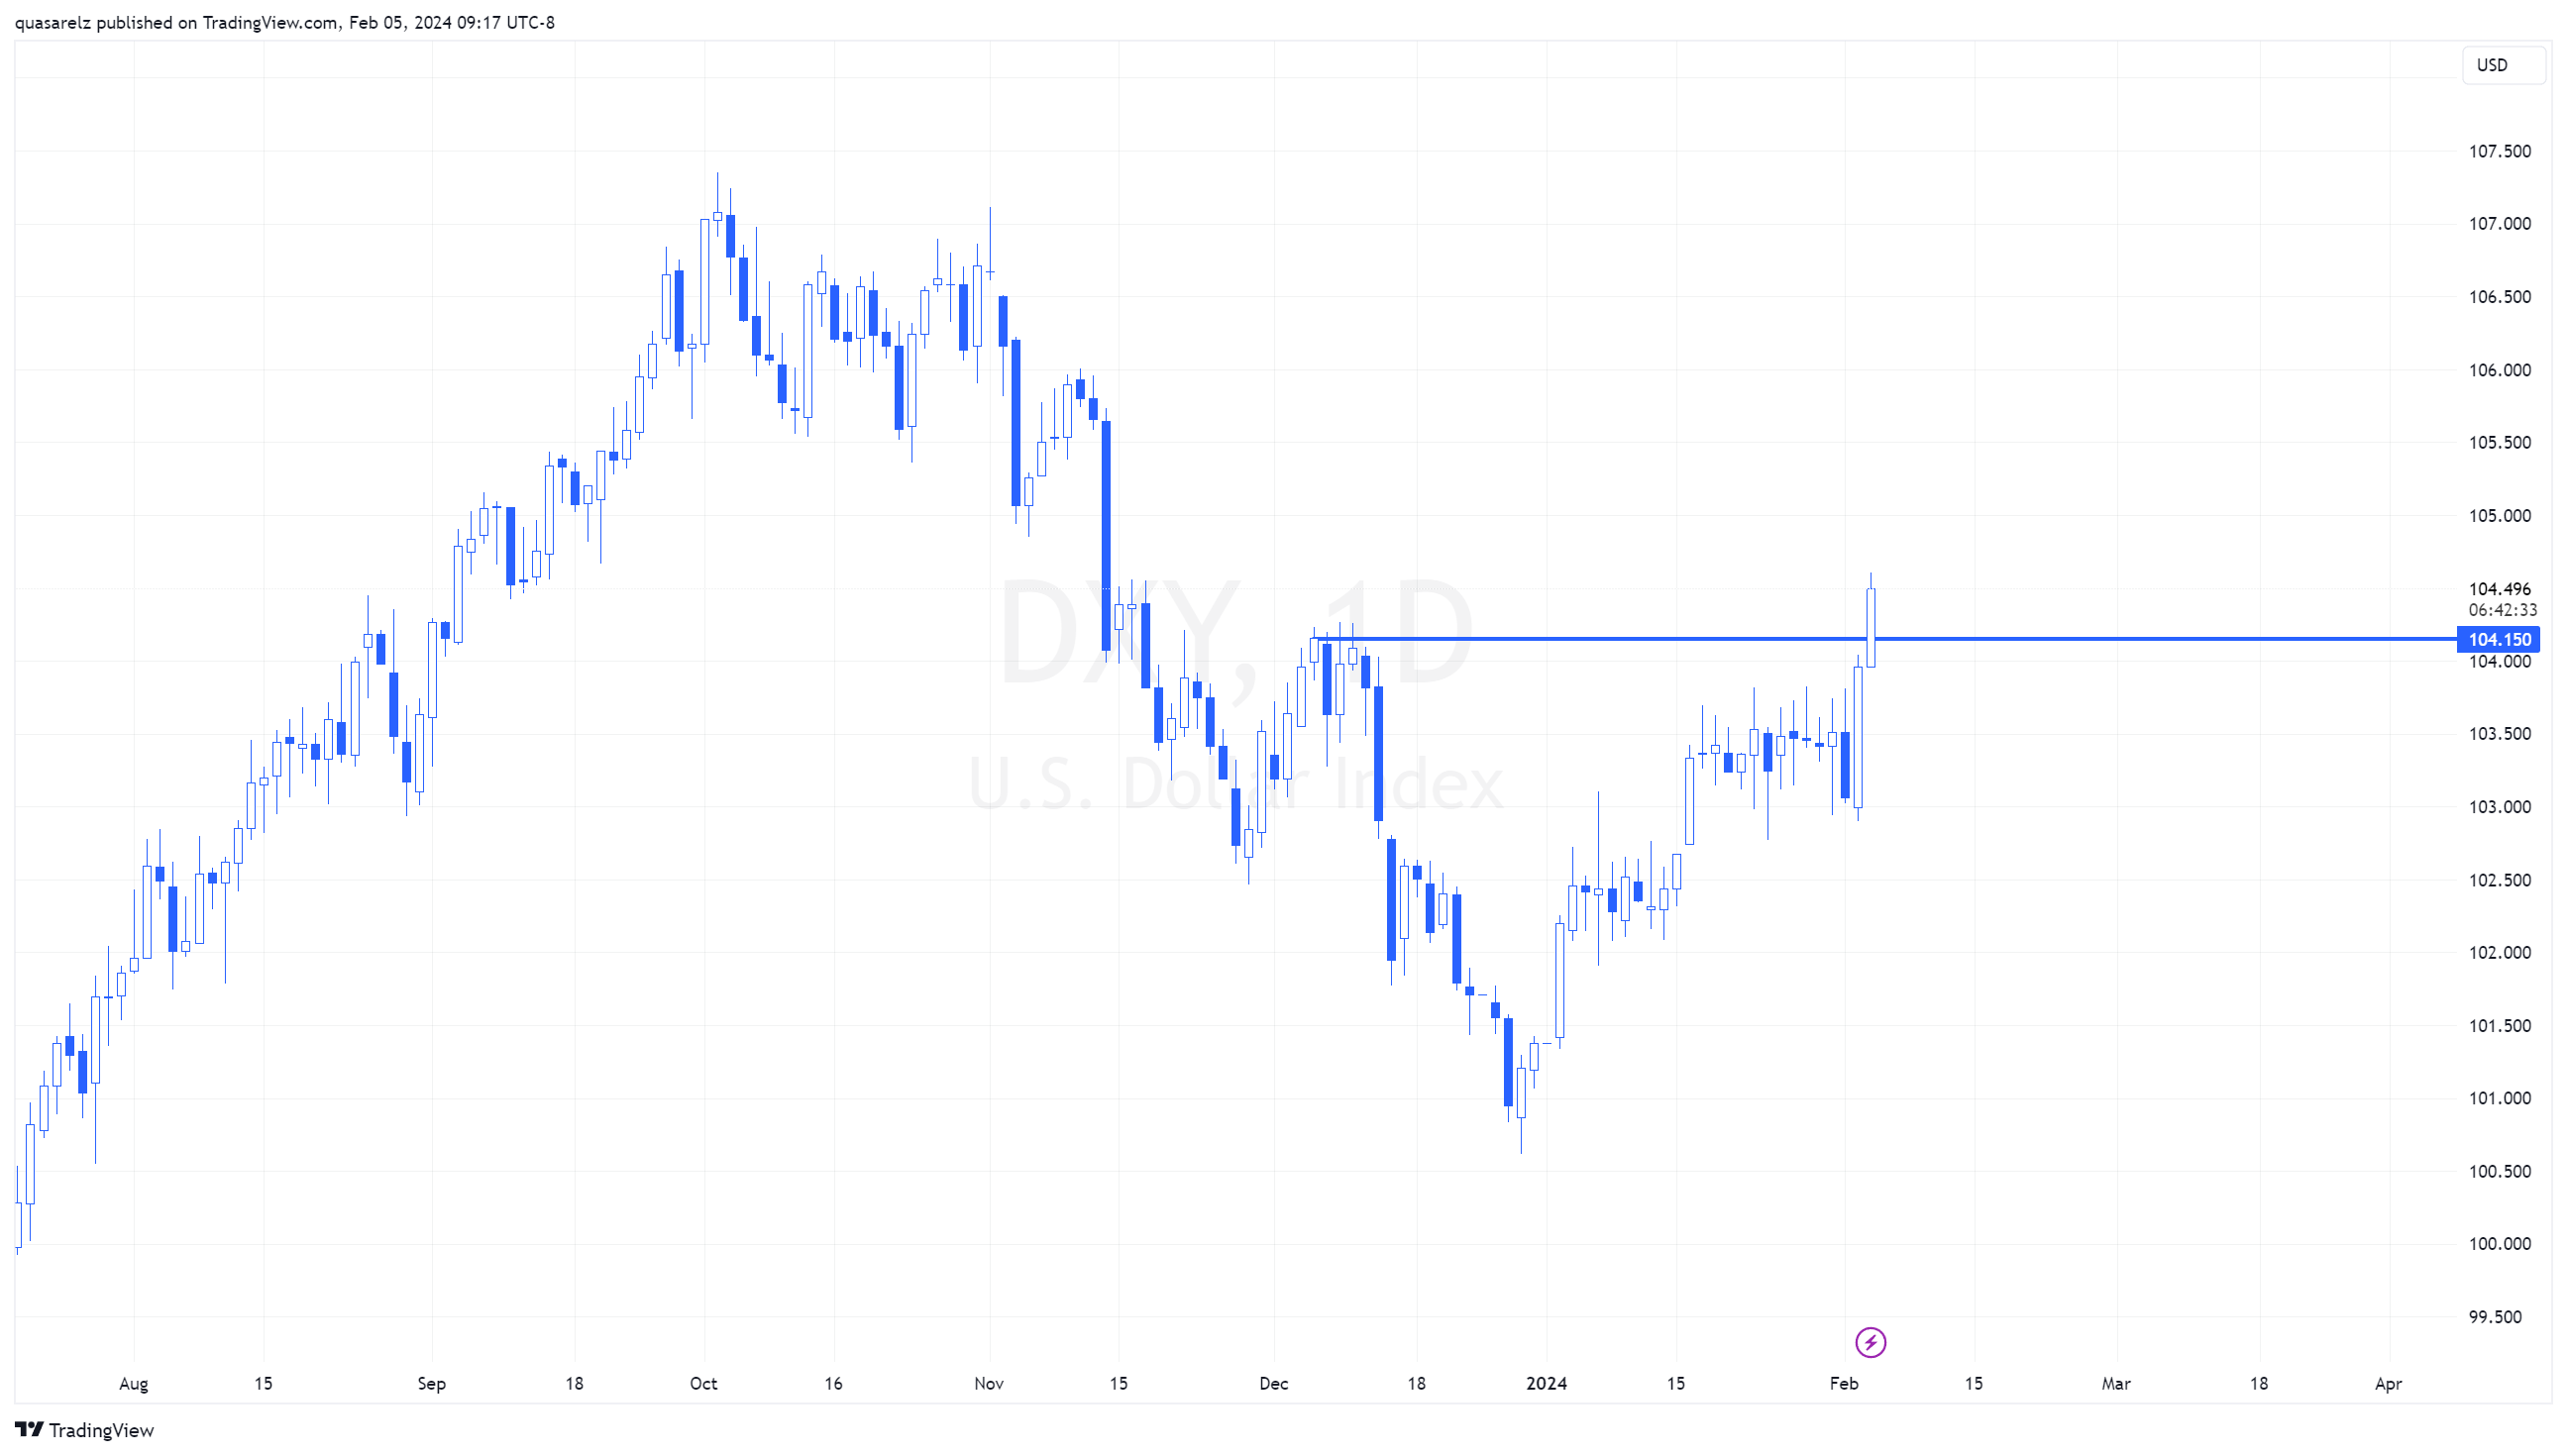
As the latest USD price action develops, it is generating a maximum at a higher level, breaking the December highs. This development is prompting us to carefully assess the operational dynamics of the dollar in comparison to its primary counterparts.
Technical analysis
EUR/USD
Daily Chart:
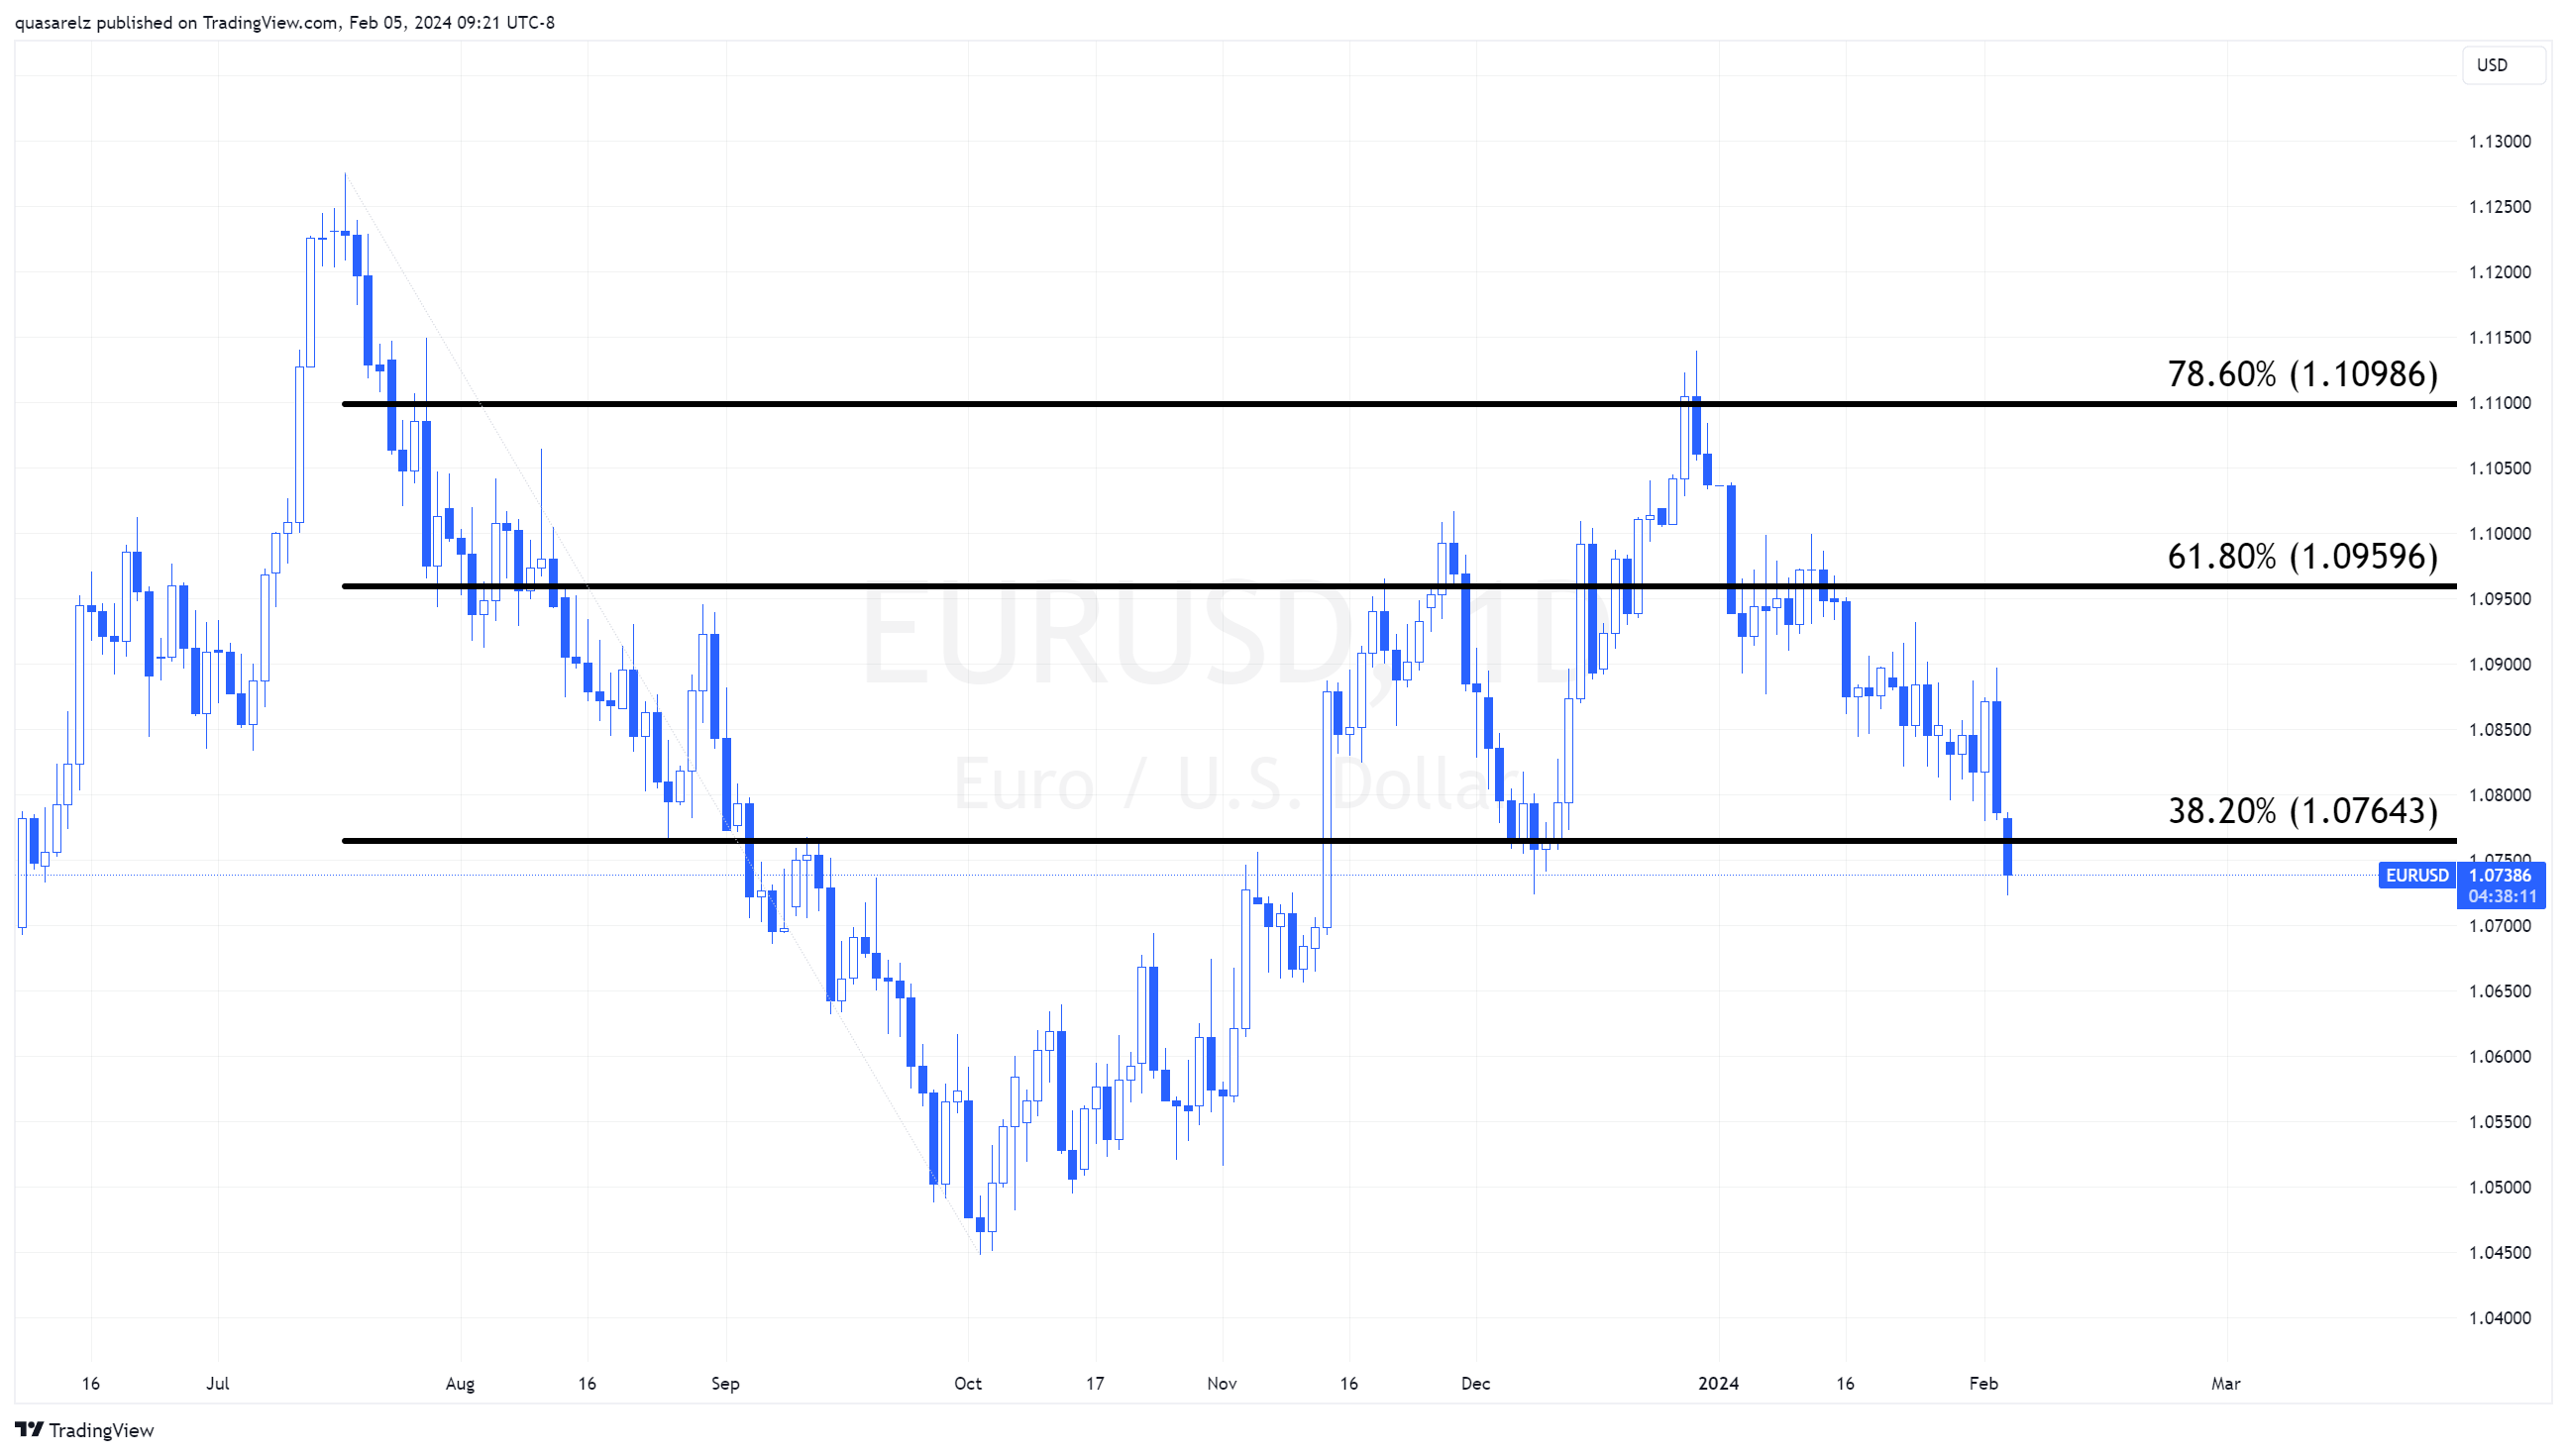
After a prevailing bullish structure in favor of the single currency, which peaked at the 78.60% Fibonacci retracement of the bearish move between the highs and lows of 2023, as of this trading session, the EUR/USD is generating a lower minimum level, invalidating the December lows.
Monthly Chart:
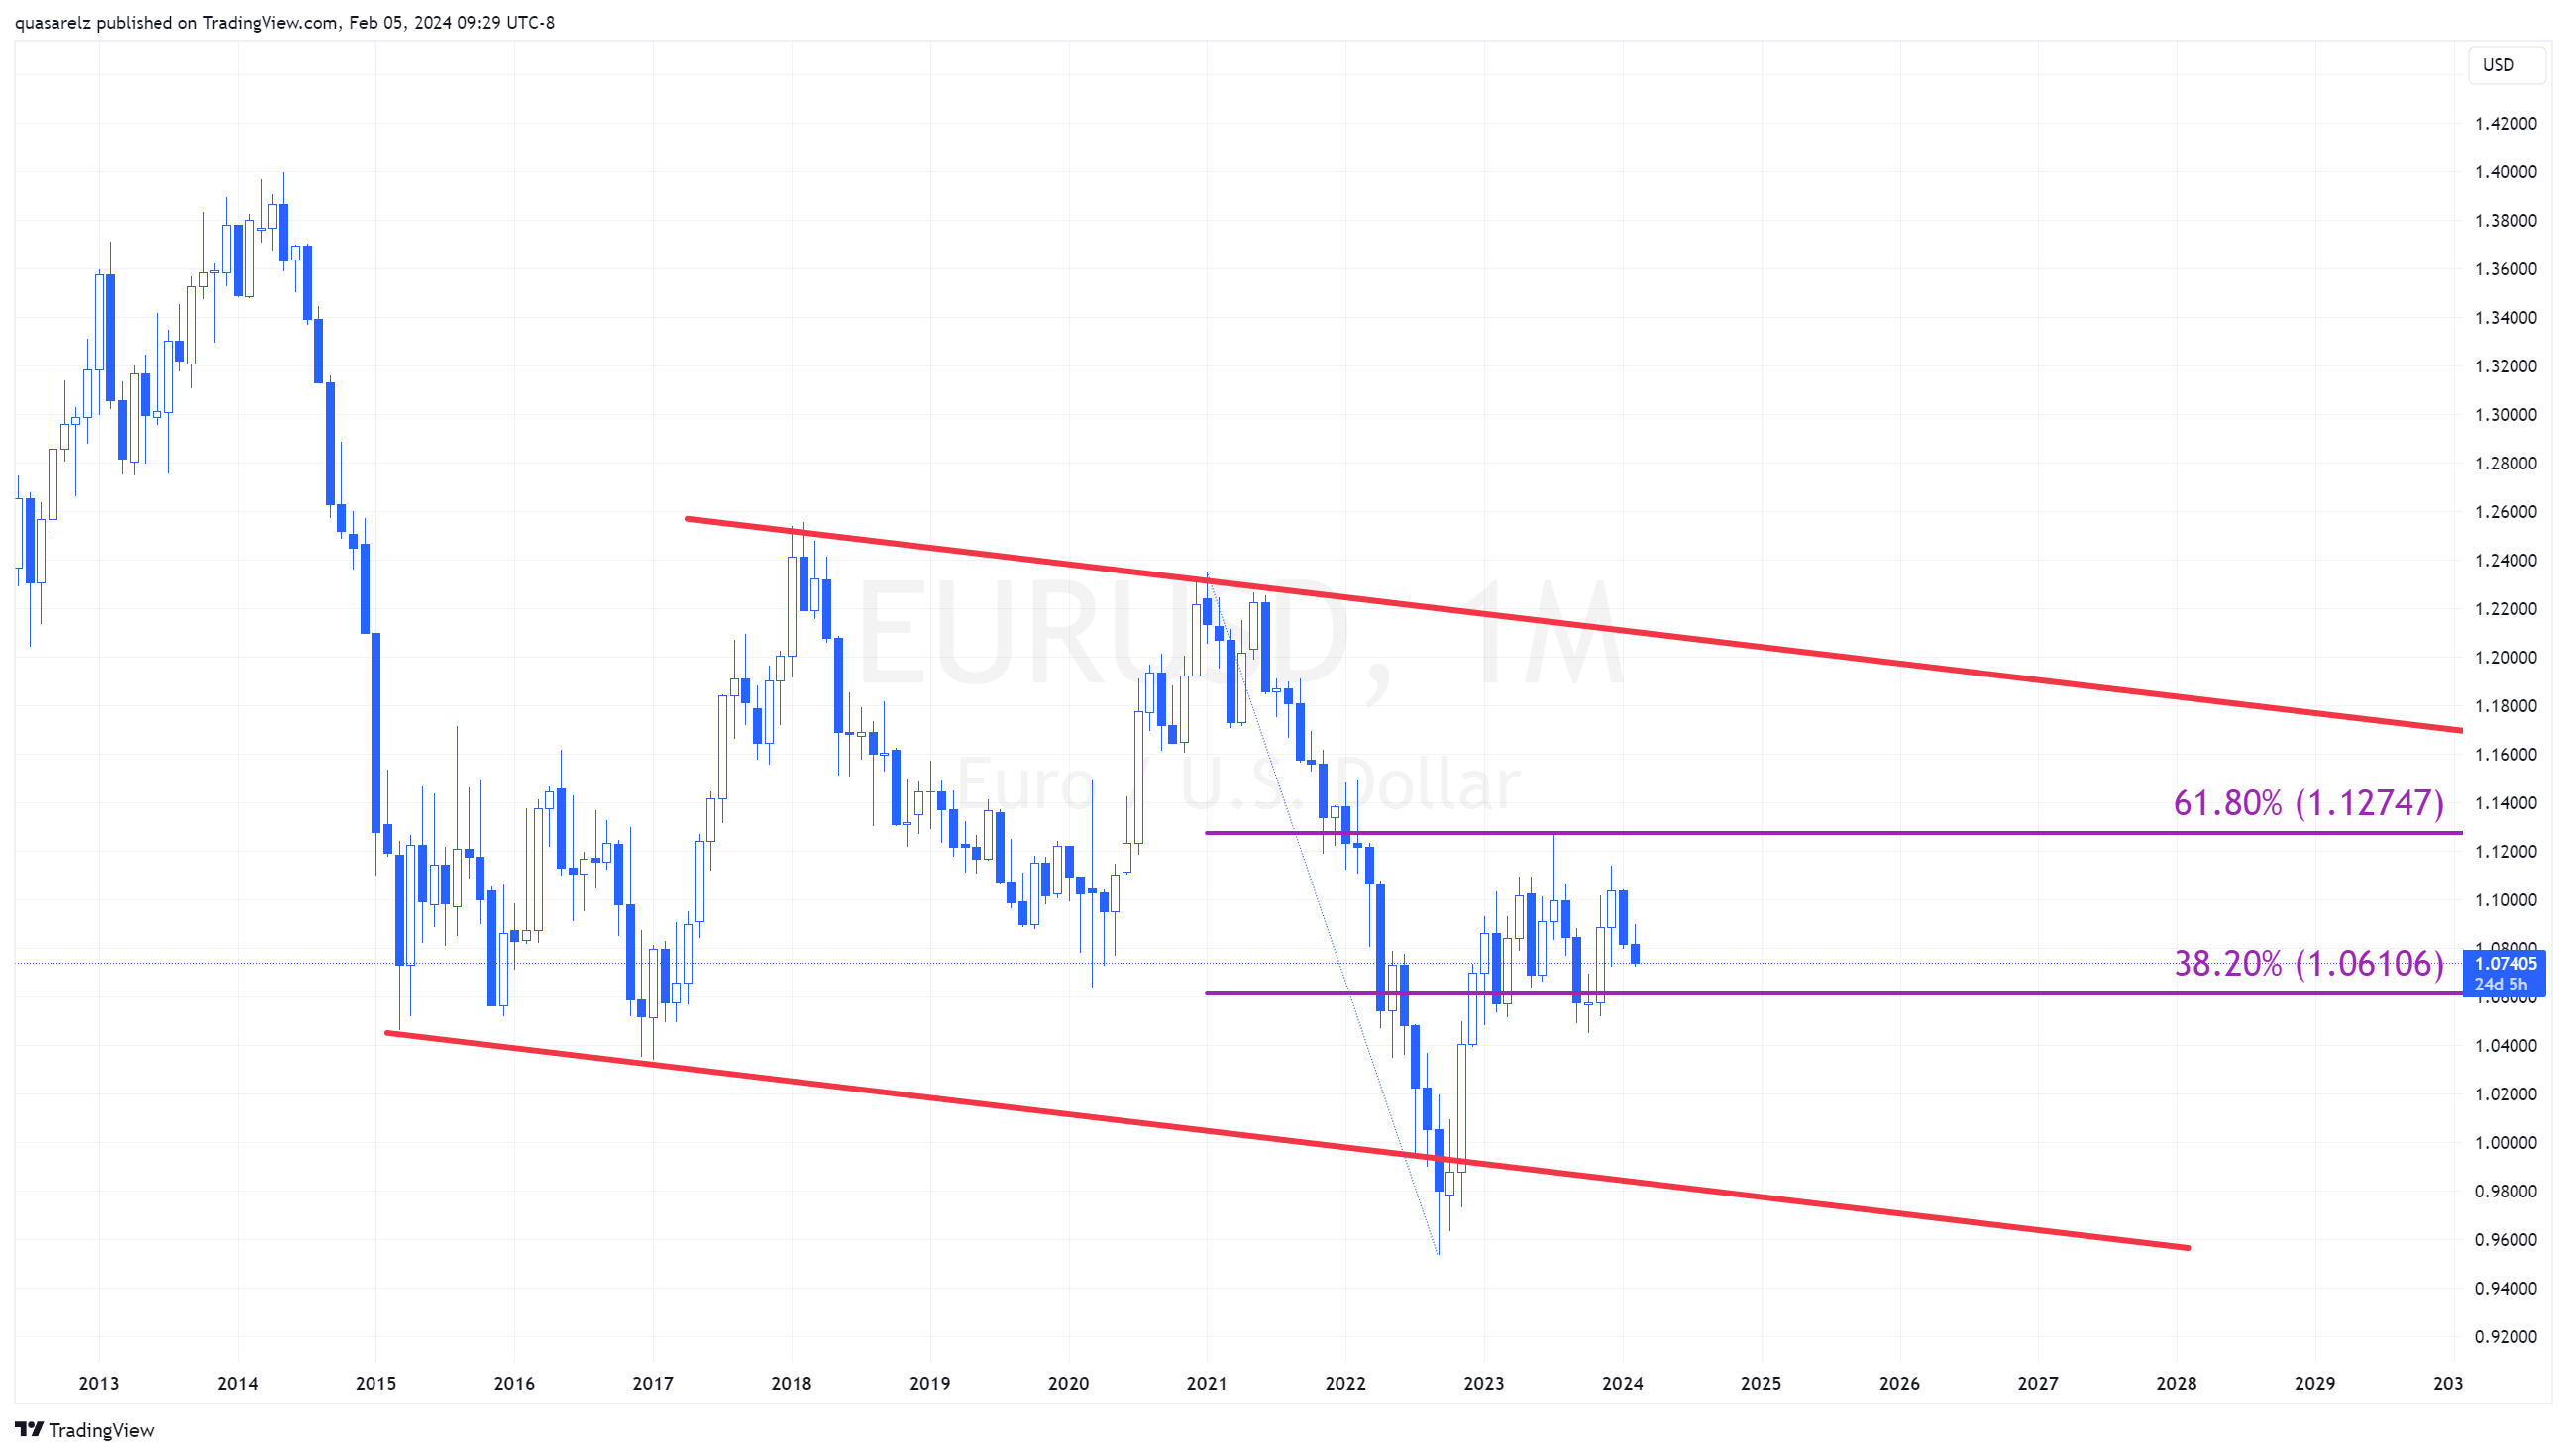
This immediately shifts our focus to the monthly chart, where after the break of the positive structure, the focus is now on bearish movements, where everything seems to indicate that EUR/USD will likely continue lower in search of the 2023 lows around the 38.20% Fibonacci retracement level of the bearish operation from the 2021 highs.
It is still too early to discuss the potential for a retest of the support of the descending channel that has been in place since 2015, but if American exceptionalism continues, and the eurozone remains under unfavorable economic pressures, this could be a factor that brings this configuration back into play.
GBP/USD
4-Hour Chart:
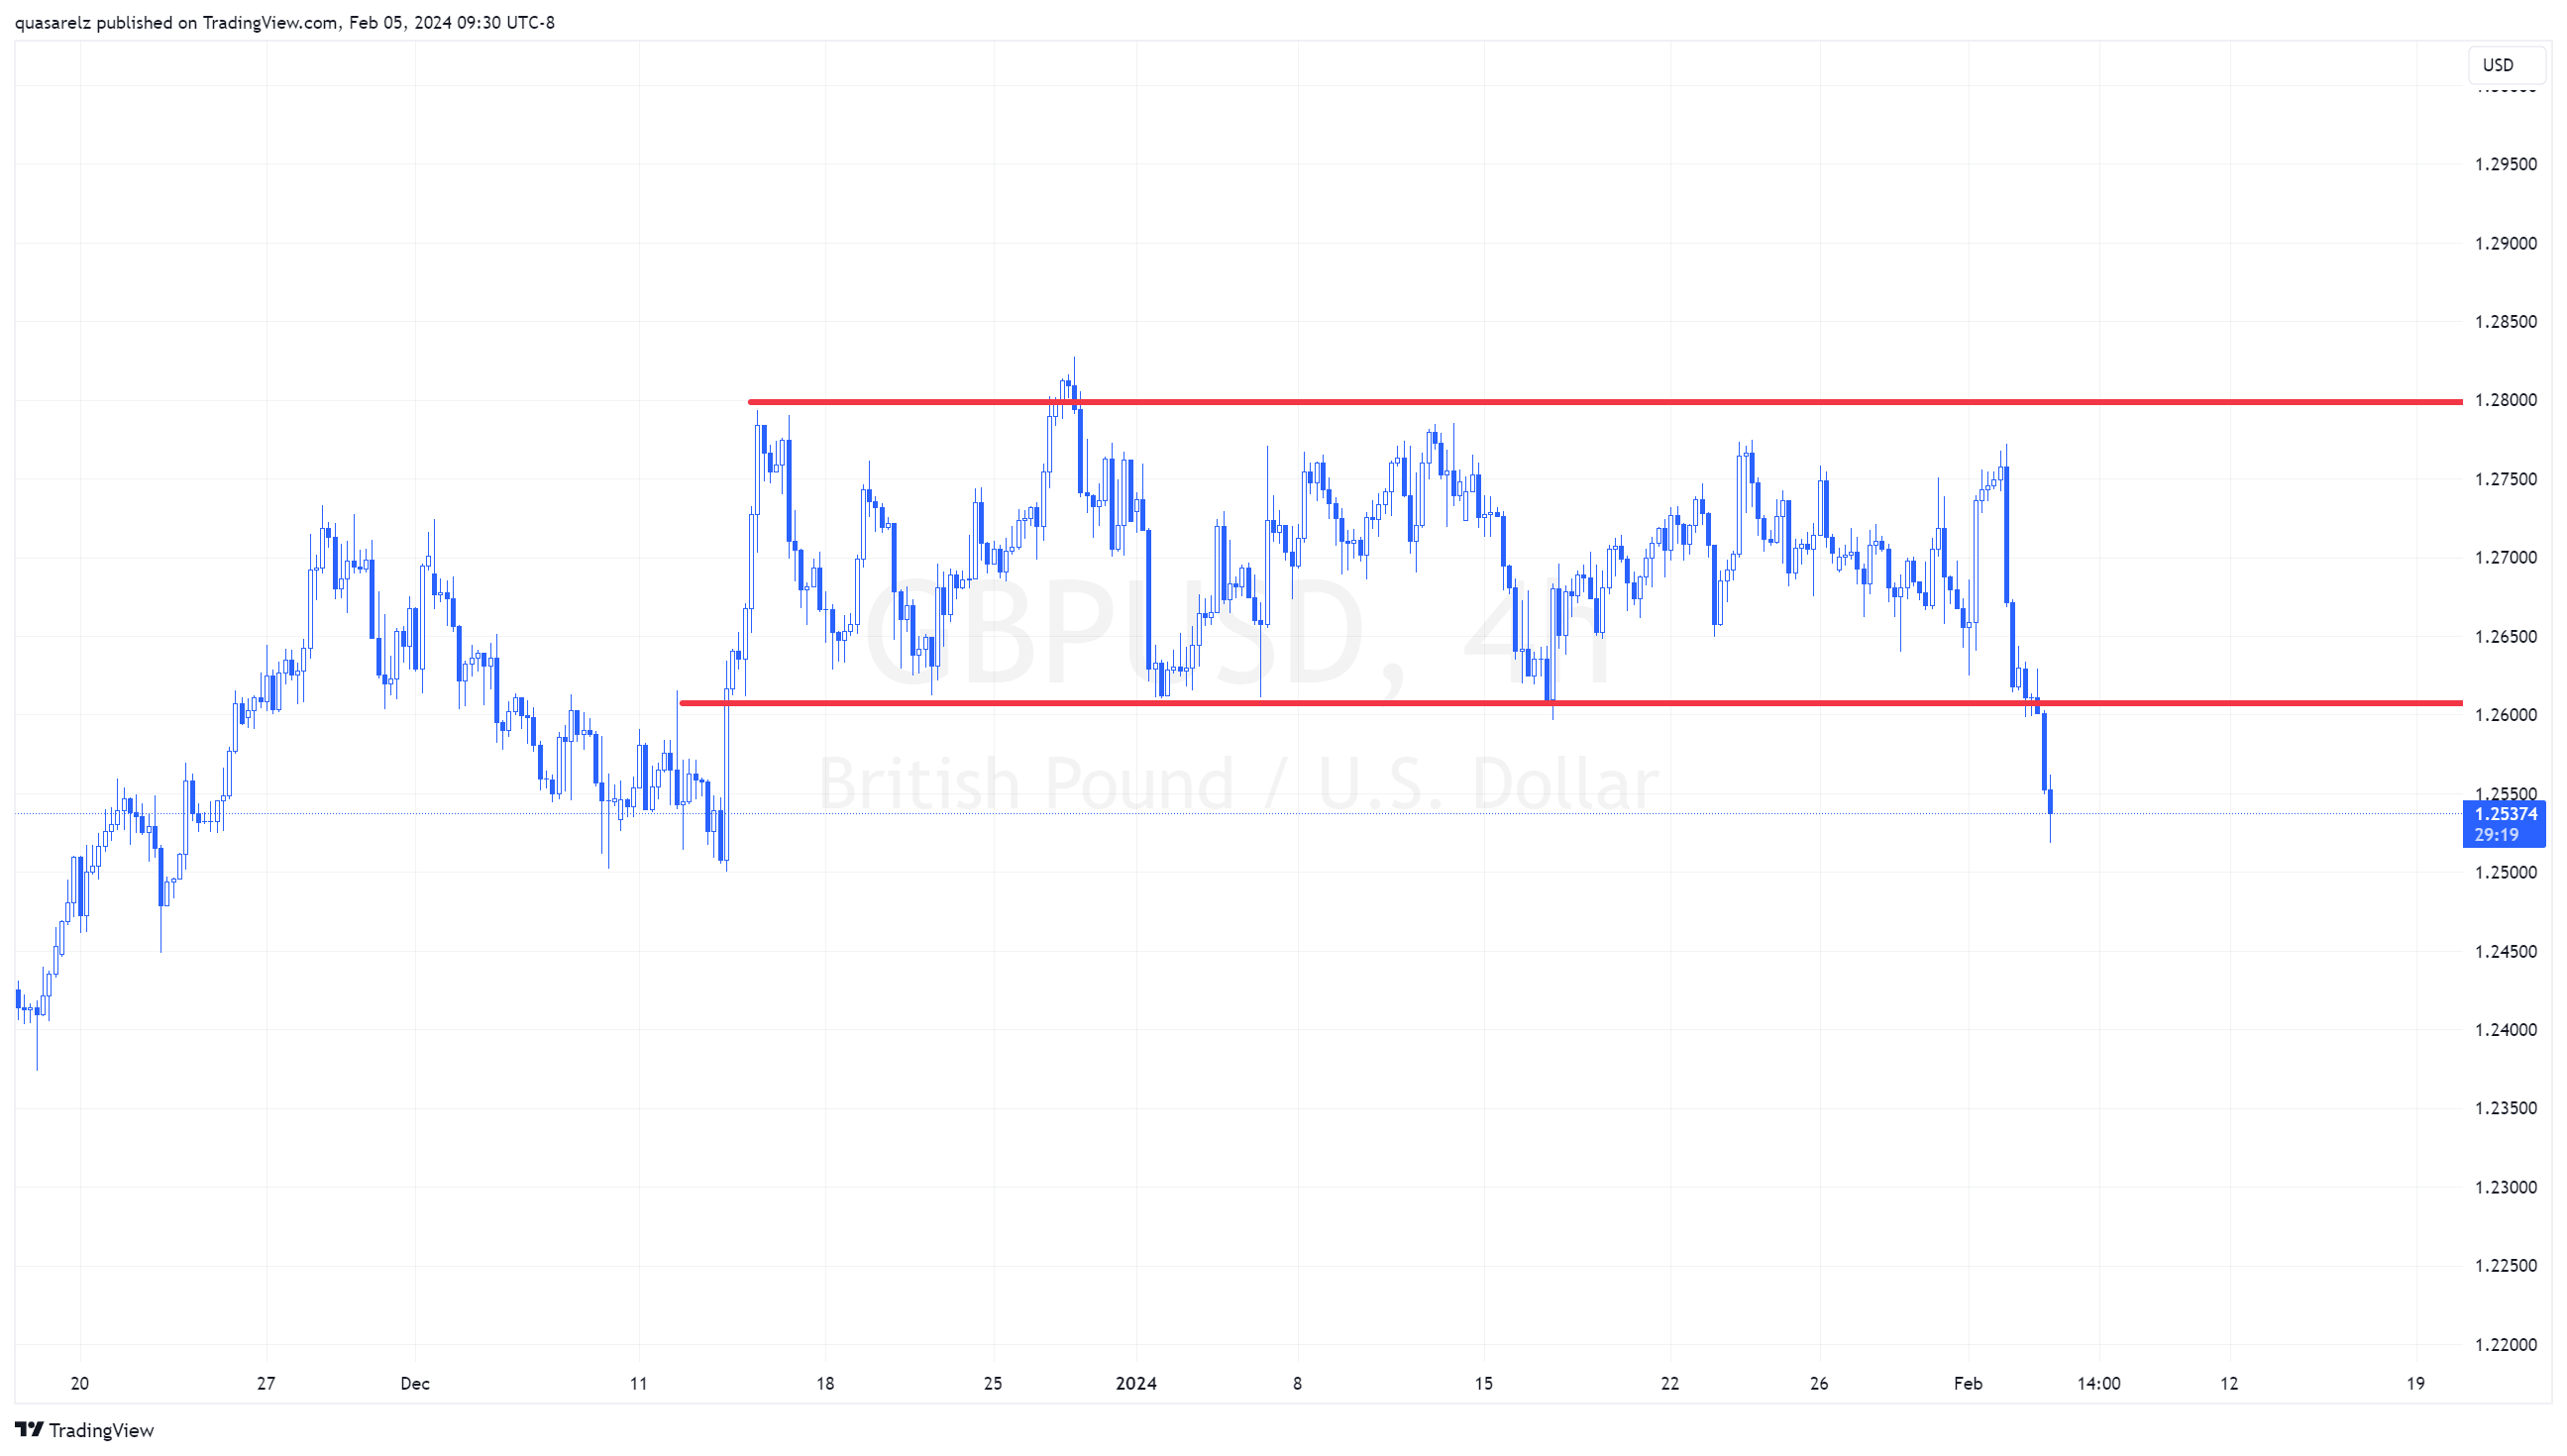
For the British pound, the positive USD has finally broken a price range that had been limiting GBP/USD trading since mid-December.
Weekly Chart:
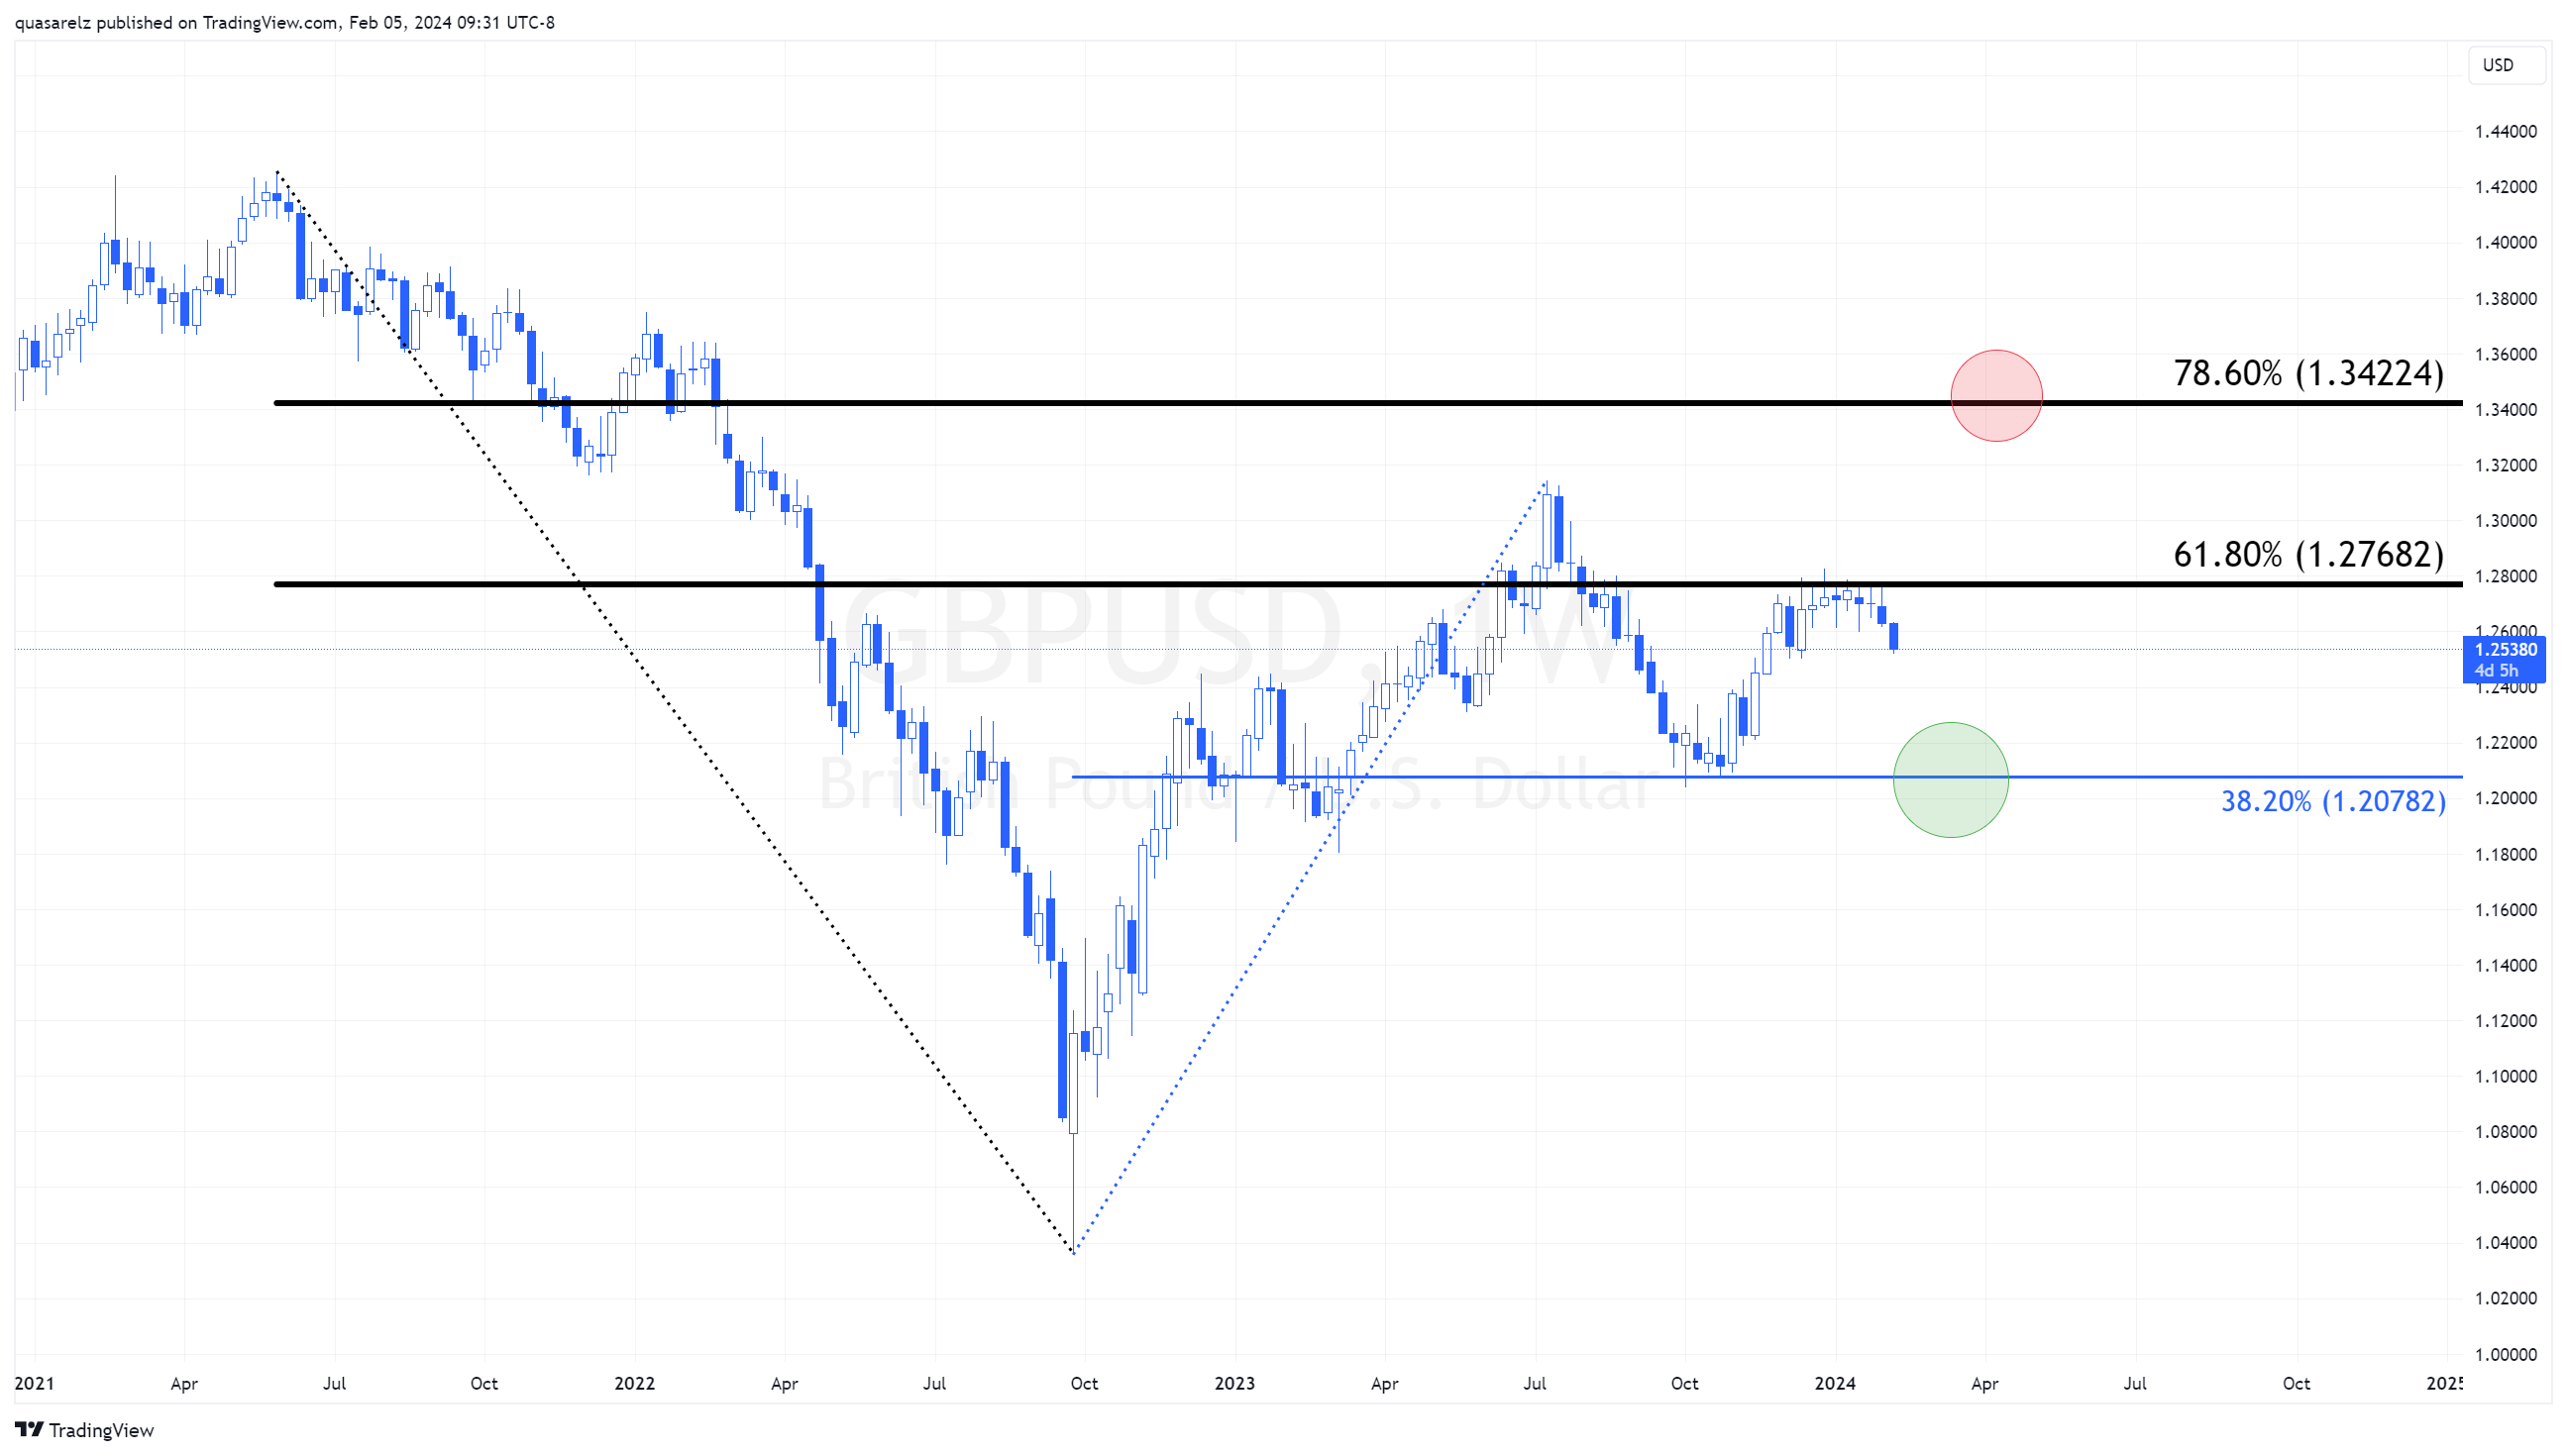
On a larger scale, this means we should abandon the search for further upside continuation towards the 78.60% Fibonacci retracement of the bearish operation from the 2021 highs and instead look for a downside continuation towards the 2023 lows around 1.20. It's worth mentioning that this level represents the 38.20% Fibonacci retracement of the bullish price dynamic that occurred from the 2022 lows.
One of the things that had kept the British pound in a better position was the reluctance of inflationary pressures in the UK. If high prices persist in the UK, this could somewhat protect the pound, as it should lead the BOE to continue to resist the prospects of imminent interest rate cuts. However, if the American economic momentum continues, this should continue to generate downward pressure on GBP/USD.
USD/JPY
Daily Chart:
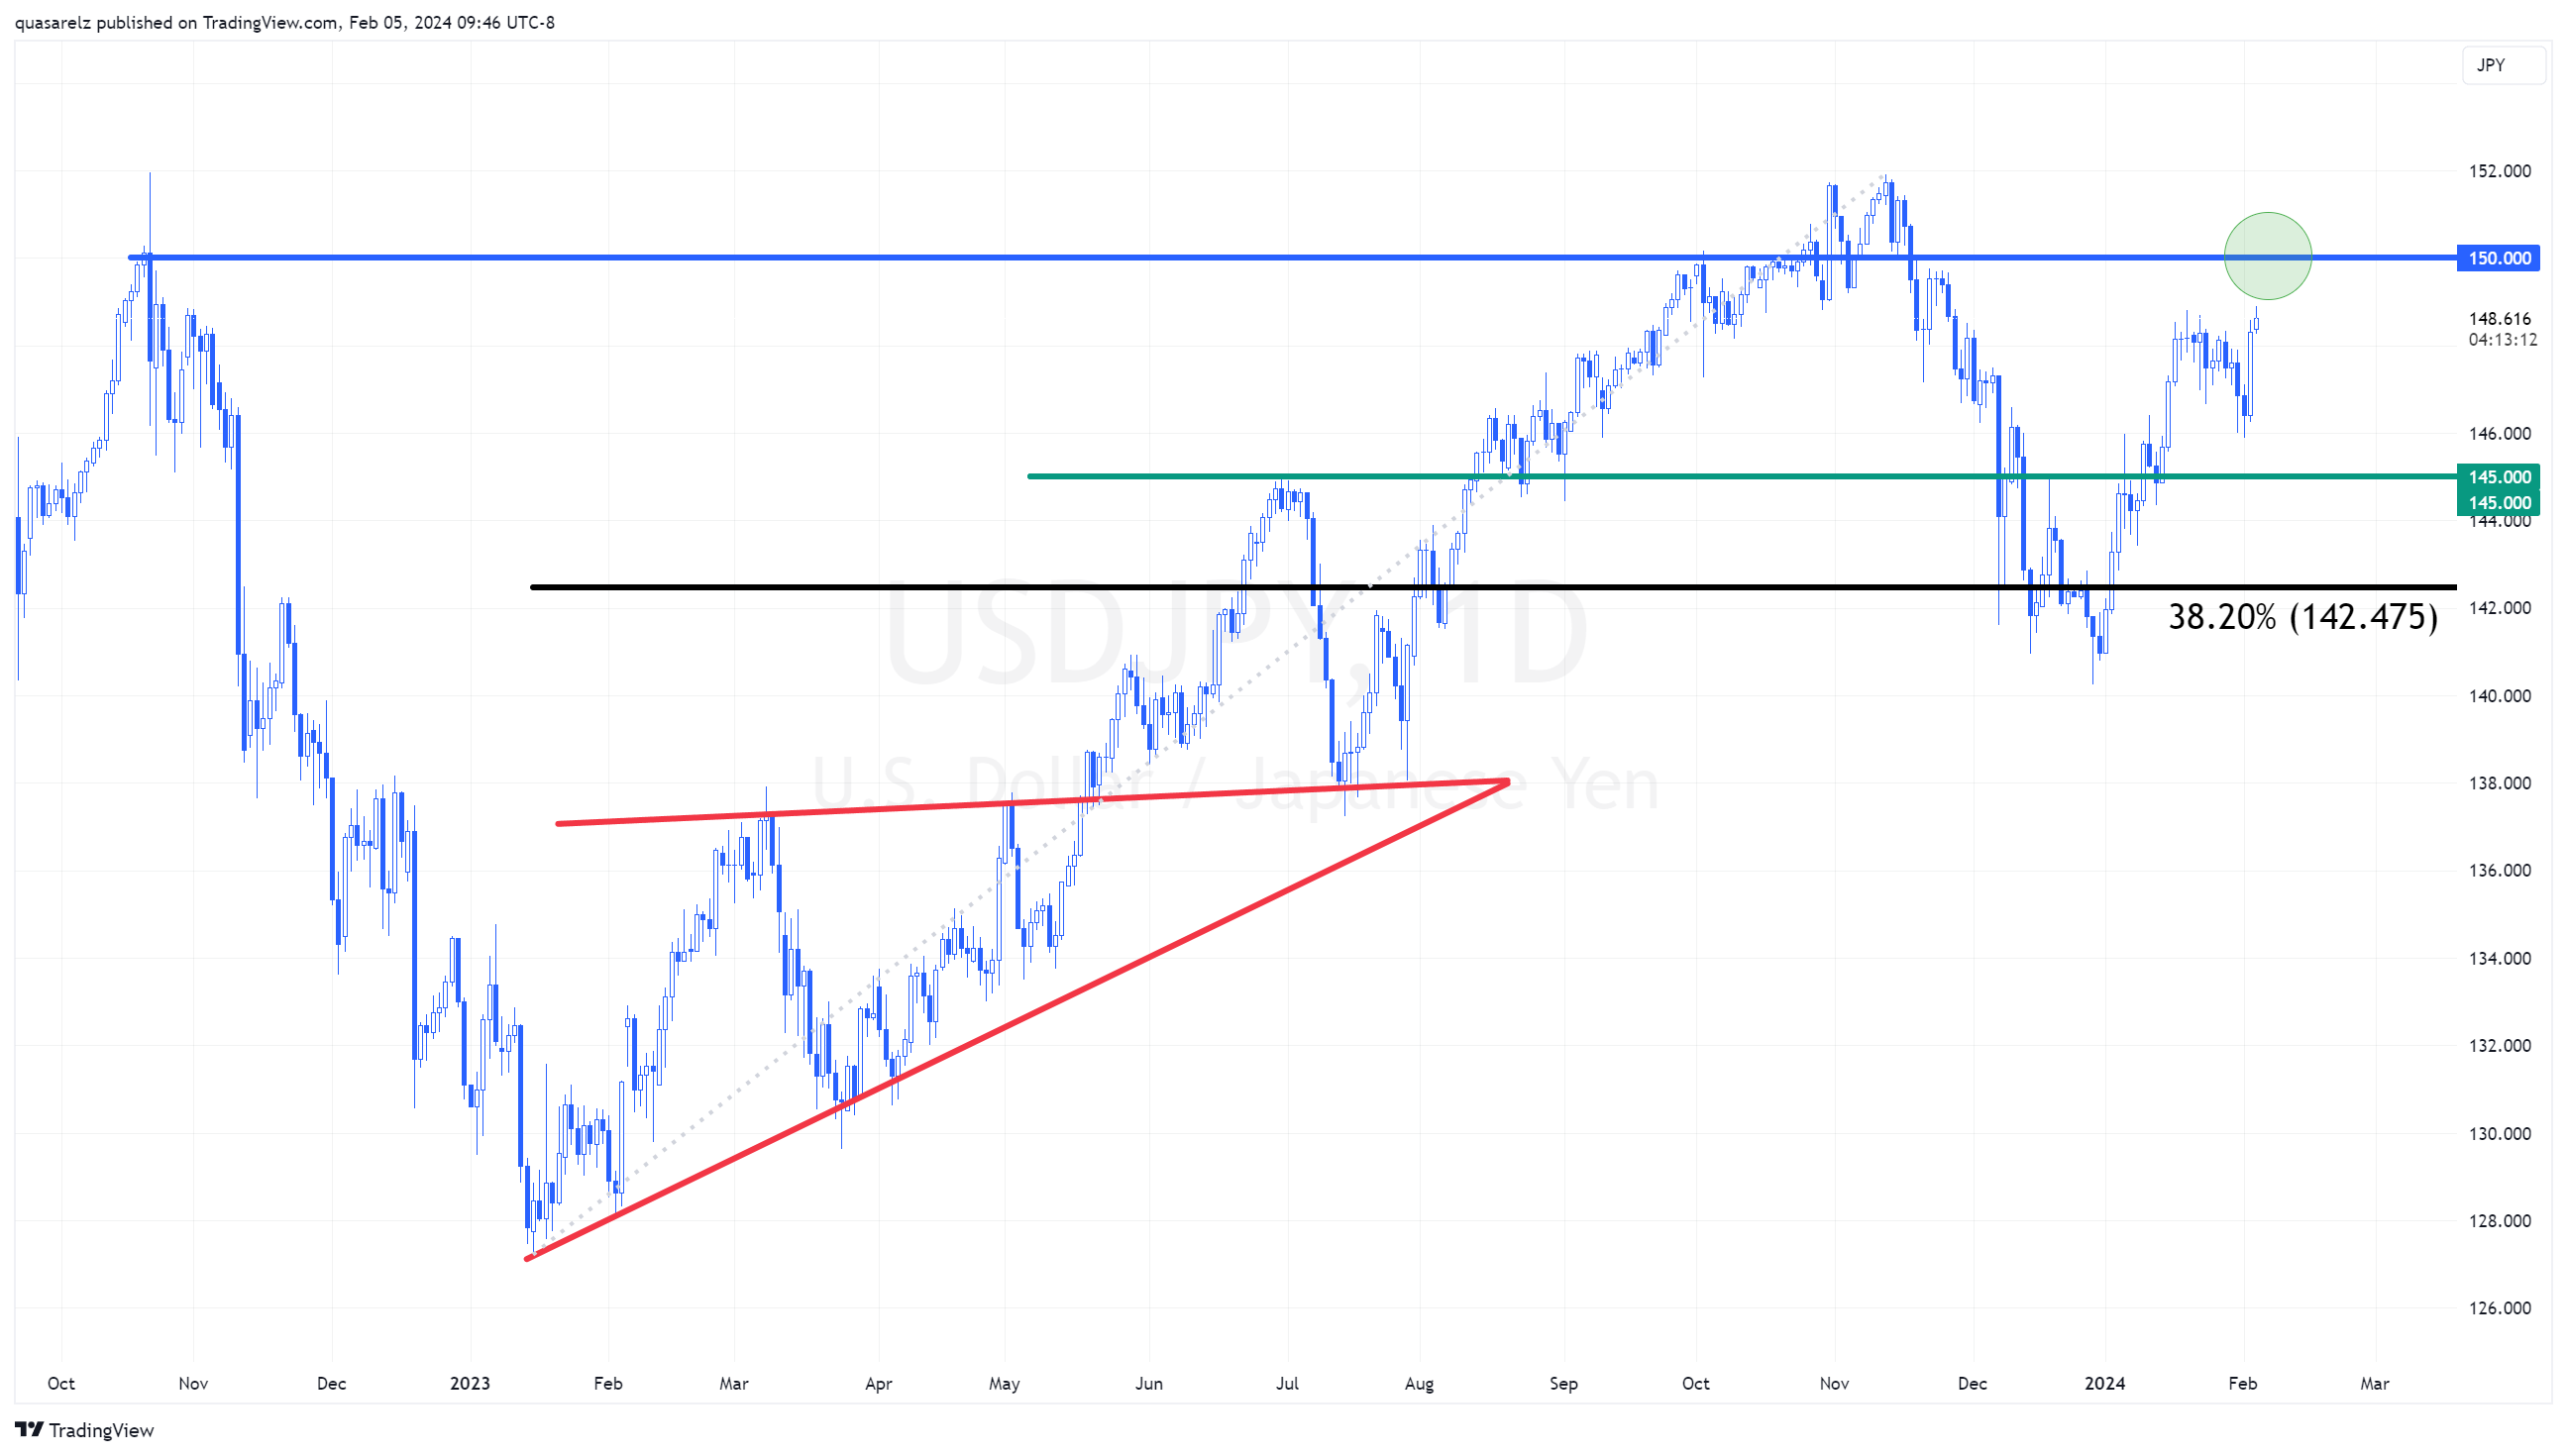
For the yen, the path of least resistance seems to be one of weakness. After finding support around the 38.20% Fibonacci retracement of the 2023 advance, USD/JPY is once again aiming for the psychological level of 150.
This is definitely a much more complex pair than the two previously presented for several reasons. On one hand, the level of 150 has previously triggered interventions, not just verbal ones, by the Bank of Japan. Additionally, unlike its other counterparts, where practically all other central banks are considering cuts, the Bank of Japan is on the opposite side of the spectrum, with expectations of rate hikes.
While the restrictive profiles are modest for the BOJ at the moment, with the first and only increase for Japan expected in April and with a value of only 10 basis points, an exit from the experiment of negative interest rates and potential additional hikes can trigger a capital influx back home, which could provide further support to the JPY.
做好交易准备了吗?
只需少量入金便可随时开始交易。我们简单的申请流程仅需几分钟便可完成申请。
此处提供的材料并未按照旨在促进投资研究独立性的法律要求进行准备,因此被视为营销沟通。虽然它并不受到在投资研究传播之前进行交易的任何禁令,但我们不会在向客户提供信息之前谋求任何优势。
Pepperstone并不保证此处提供的材料准确、及时或完整,因此不应依赖于此。无论是来自第三方还是其他来源的信息,都不应被视为建议;或者购买或出售的要约;或是购买或出售任何证券、金融产品或工具的征求;或是参与任何特定交易策略。它并未考虑读者的财务状况或投资目标。我们建议此内容的读者寻求自己的建议。未经Pepperstone批准,不得复制或重新分发此信息。