- Italiano
- English
- Español
- Français
This has led to an increase in the oil price from the 34 year low of US $9.12/barrel to approximately $33.25 a barrel in just over a month of trading.
This move was a mixture of anticipation of demand returning to the market, and OPEC cutting production to help steady the supply/demand dynamics. While this major move has presented traders with opportunity, there remains a stark reminder of what can go wrong when trading a commodity that is so heavily reliant on deals and agreements between multiple countries.
Brent remains the better technical trade with heavy resistance point being reached

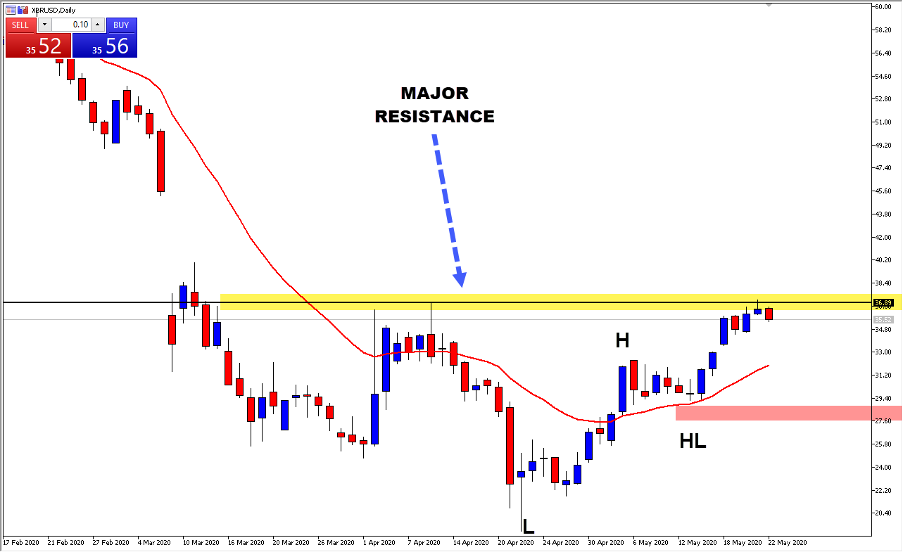
The chart above shows XBRUSD (Brent) making a higher high after breaking past the high labelled by H on the chart at a price of $32.35. This was a strong signal for Brent buyers, and they have steadily pushed the price into the next major resistance zone of $36.89 (highlighted in yellow) over the last week, with price now rejecting, and finding some weakness, as many traders are potentially profit taking in this area.
As mentioned above, oil’s miraculous recovery has been aggressive over the last few weeks, and it might be time for selling pressure to come into the market before it resumes the uptrend, as it attempts to fill the gap created in early March.
Gold breaks to a new high as China U.S. trade tensions continue

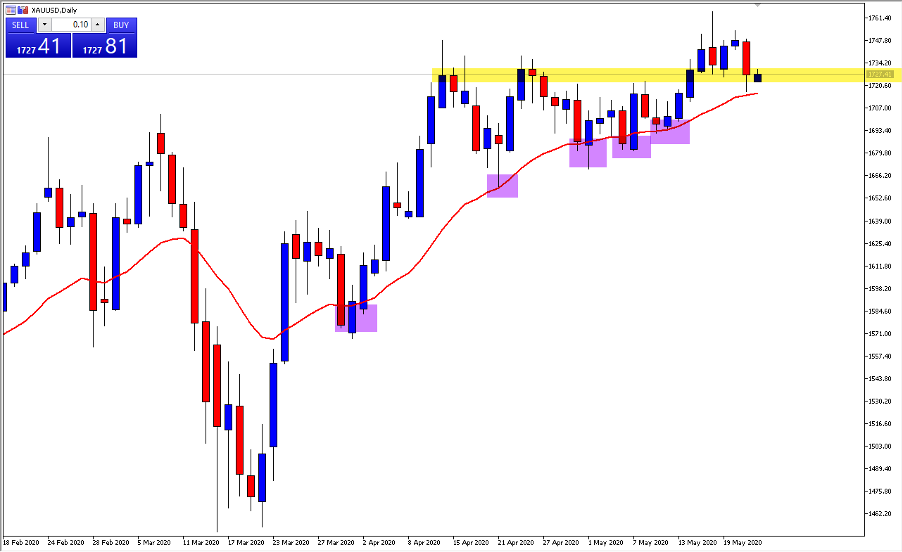
Gold (XAUUSD) remains a commodity that generally performs well during uncertainty. In recent weeks, the 20-exponential moving average (red line) has become a great dynamic support zone for gold, with price consistently finding buyers when reaching the 20-moving average with the uptrend remaining intact. When price was breached at the resistance of $1734 zone (highlighted in yellow), it quickly moved towards the $1760 area, before finding resistance where the bulls took profit and bears gained control.
Price has now almost reached the 20-exponential moving average, while at the same time the previous resistance of $1734 has now become a zone of potential role reversal, with expected buying pressure to be found between the price of $1720-$1730.
EURUSD remains rangebound on the 4 hour timeframe

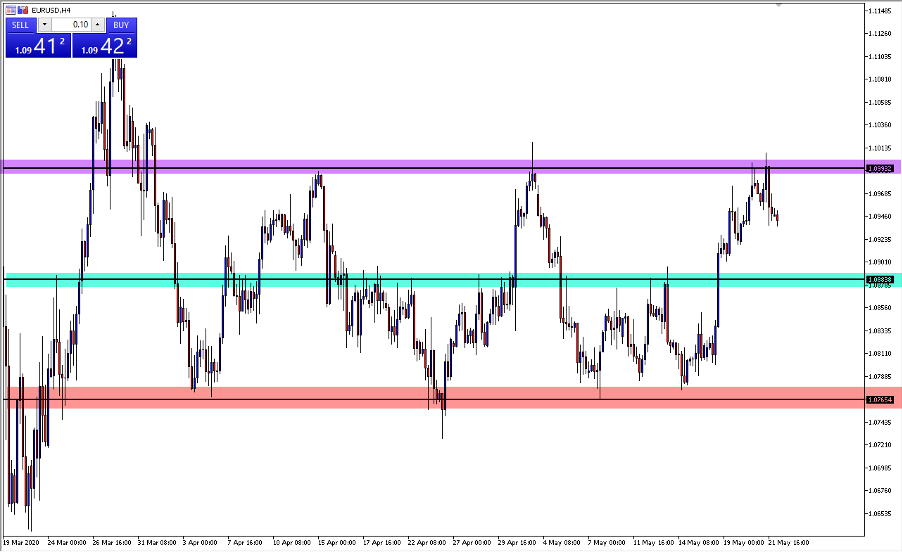
The EURUSD currency pair has remained rangebound since early April, with price finding support at the 1.0765 area (highlighted in red) and finding resistance at the massive psychological area of 1.100 (highlighted in purple).
Even more interesting is the way price is interacting in the middle of the range, with the 1.088 area (highlighted in green) acting as a great confirmation point of breakouts either way, and allowing traders to potentially enter positions with clear stop loss and take profit targets. If price remains trapped for the coming week, the 1.088 area will remain one that technical analysis traders continue to look to when finding take profit zones or entry areas.
All eyes on USDX as risk off sentiment may be coming back into the market

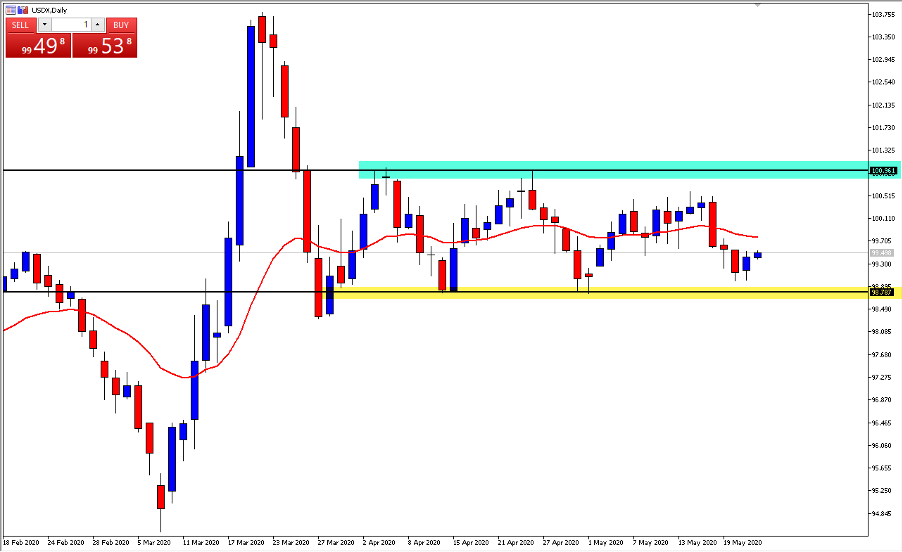
The U.S. Dollar Index (USDX) remains the key to many major currency trades including the EUR/USD on the larger timeframes. In the last 24 hours, Risk Off sentiment has started to come back into the markets, with the S&P 500 finding some resistance and selling off with slightly weaker than expected unemployment numbers of over 2.4 million.
It remains to be seen what the Federal reserve and Jerome Powell will do to continue combatting this uncertainty, but if price continues to find support above the 98.80 zone (highlighted in yellow), we may see further strength, with the previous resistance at 101.00 (highlighted in green) being tested over the coming weeks. This will surely push major currency pairs, and the fact that the EURUSD is at major resistance while the USDX is around major support is no coincidence.
Related articles
Iniziamo a fare trading?
Iniziare è facile e veloce. Con la nostra semplice procedura di apertura conto, bastano pochi minuti.
Pepperstone non dichiara che il materiale qui fornito sia accurato, attuale o completo e pertanto non dovrebbe essere considerato tale. Le informazioni, sia da terze parti o meno, non devono essere considerate come una raccomandazione, un'offerta di acquisto o vendita, la sollecitazione di un'offerta di acquisto o vendita di qualsiasi titolo, prodotto finanziario o strumento, o per partecipare a una particolare strategia di trading. Non tiene conto della situazione finanziaria o degli obiettivi di investimento dei lettori. Consigliamo a tutti i lettori di questo contenuto di cercare il proprio parere. Senza l'approvazione di Pepperstone, la riproduzione o la ridistribuzione di queste informazioni non è consentita.


