- English
- 简体中文
- 繁体中文
- ไทย
- Tiếng Việt
- Español
- Português
- لغة عربية
5 Charts traders should have on their radar
DXY
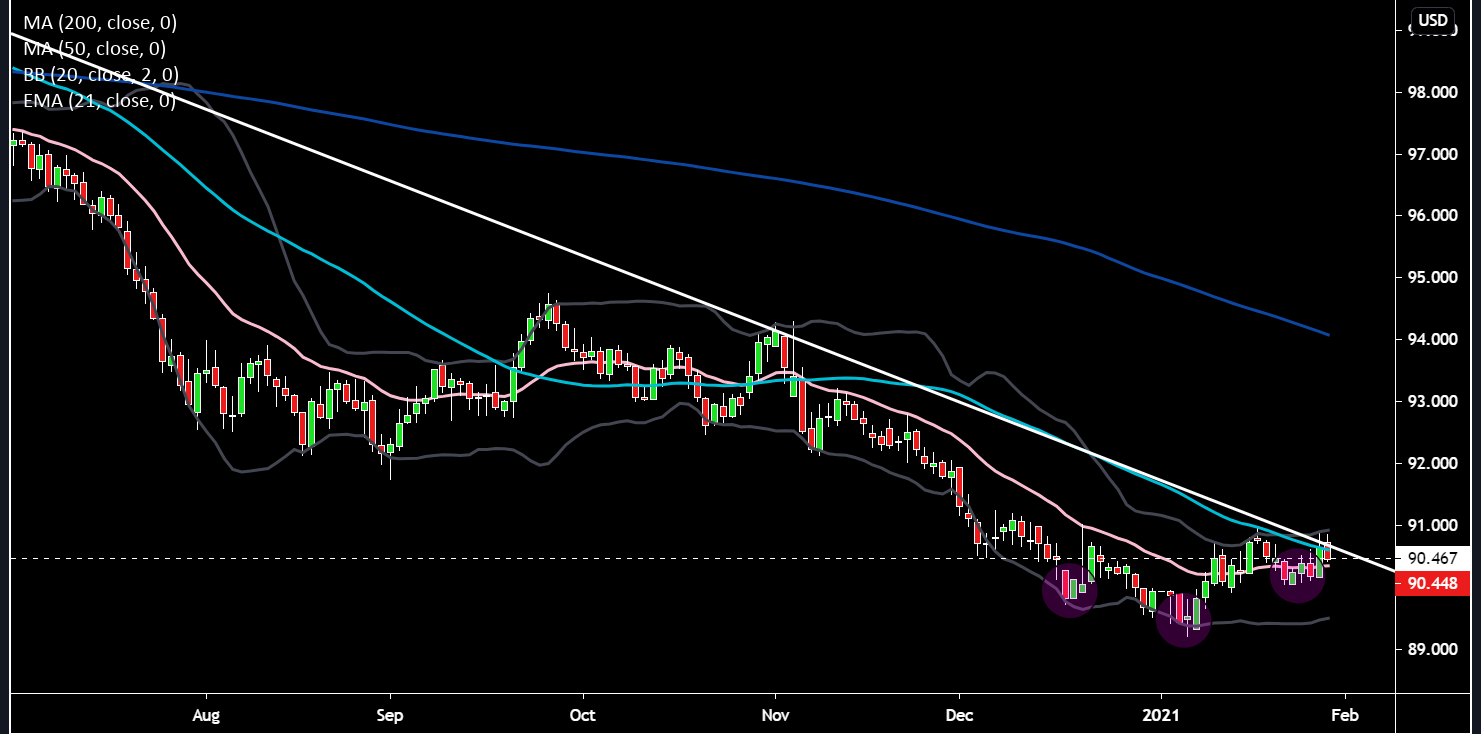
The dollar was modestly stronger earlier in the session despite a dovish message from Jerome Powell last evening. The typical risk-on risk-off switch of the equity market led to a bid in DXY. Economic data was solid too with beats on jobs and an in-line with consensus GDP print. The strength didn’t last for dollar bulls and the early morning gains have been pared back with red now flashing on the screen. This is due to the S&P 500 seeing some decent uplift as well as potentially some month end rebalancing flows. Dollar shorts are very large and if we’ve learnt anything from what’s transpired in the market the last few days it’s that short squeezes are still alive and well.
The chart is certainly interesting. Depending on your outlook one could either see the pattern as a bear flag or alternatively an inverted head and shoulders (purple shaded circles). I personally see an inverted head and shoulders with the neckline around 90.7 Price is currently pushing up against a lot of overhead resistance in the form of the March high’s downtrend line, upper BB and the light blue 50-day SMA – this is all in the 90.8 – 91 zone. Bulls would have been hoping for a close above that downtrend line which looks unlikely today. There is some support on the downside from the white dotted horizontal line at 90.5 and the pink 21-day EMA around 90.3. Monitoring the dollar which drives a whole host of other assets is prudent.
VIX
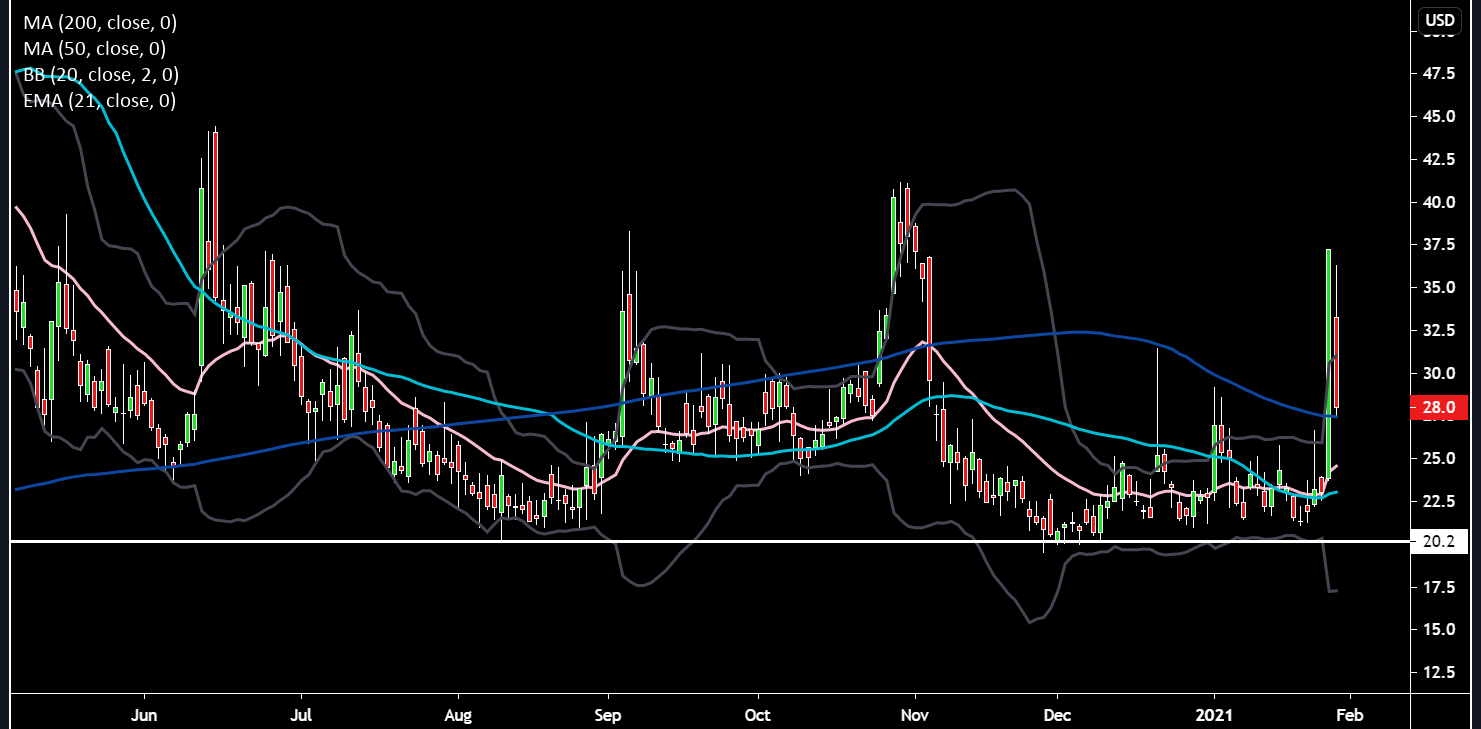
It’s always good to check on the fear gauge to get a measure of sentiment prevailing in the market. It spiked yesterday by 14 points up to 37 as the equity market sold off over 2.5%. Now it’s currently hovering around 27.8 which is also right on the 50-day SMA. The more VIX compresses the more risk starts to enter the market. The 20 level is still proving a sticky congestion zone to break below and the 35 level has capped upside moves. The range since June of 20-35 remains intact.
Bitcoin
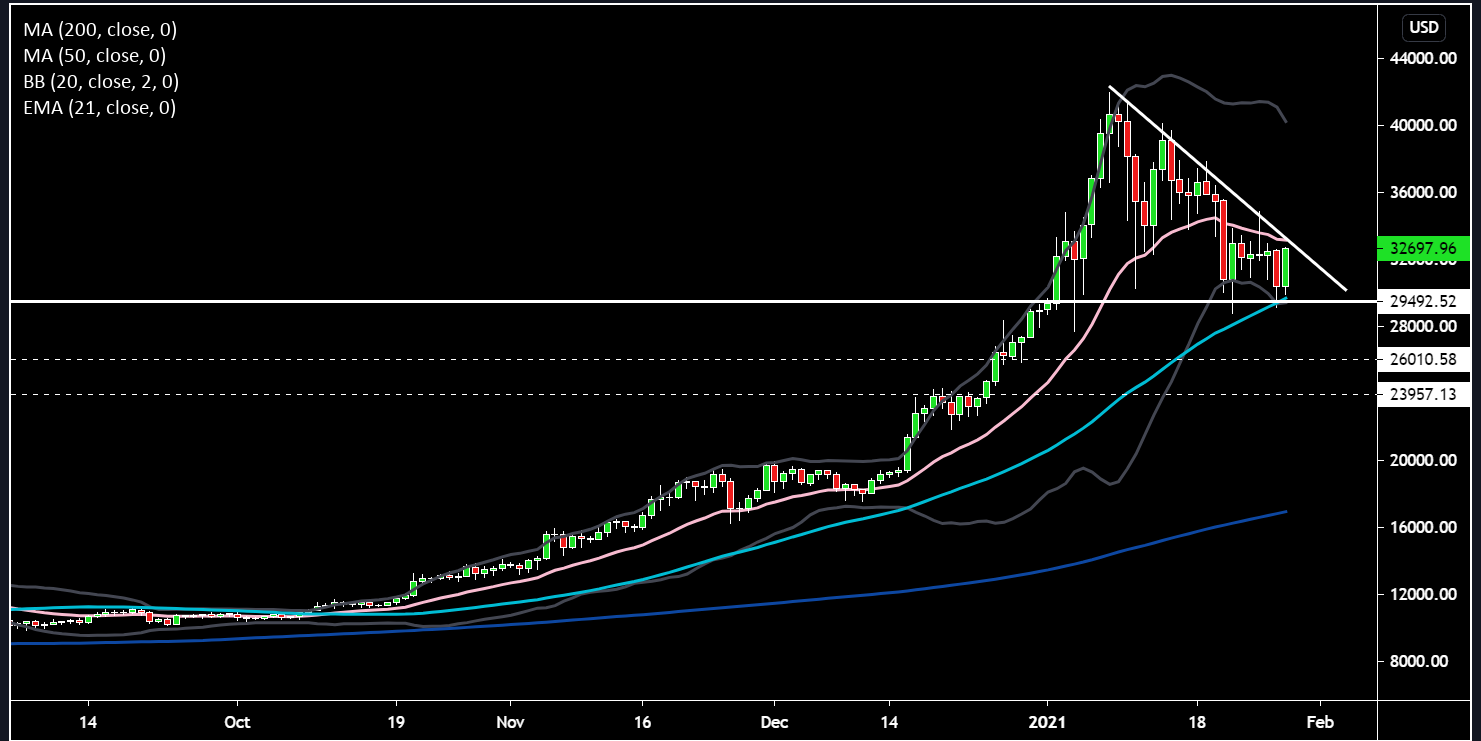
Speaking of risk, an all-time favourite – Bitcoin has taken a backseat to Gamestop in recent days, however, with Ray Dalio lauding it this evening as “one hell of an invention” it certainly shouldn’t be put in the cupboard and locked away. Bitcoin has formed a descending flat sided triangle on the daily chart which usually resolves to the downside, but as we all know Bitcoin is not a conventional asset so sometimes those rules don’t always apply. At present, price is wedged between the pink 21-day EMA and the light blue 50-day SMA. Today’s price action found support at the 50-day SMA and the white horizontal support line around the 30k level. If price did break that level the next support zones come in at 26k and 24k as indicated on the chart by the horizontal white dotted lines.
Gold
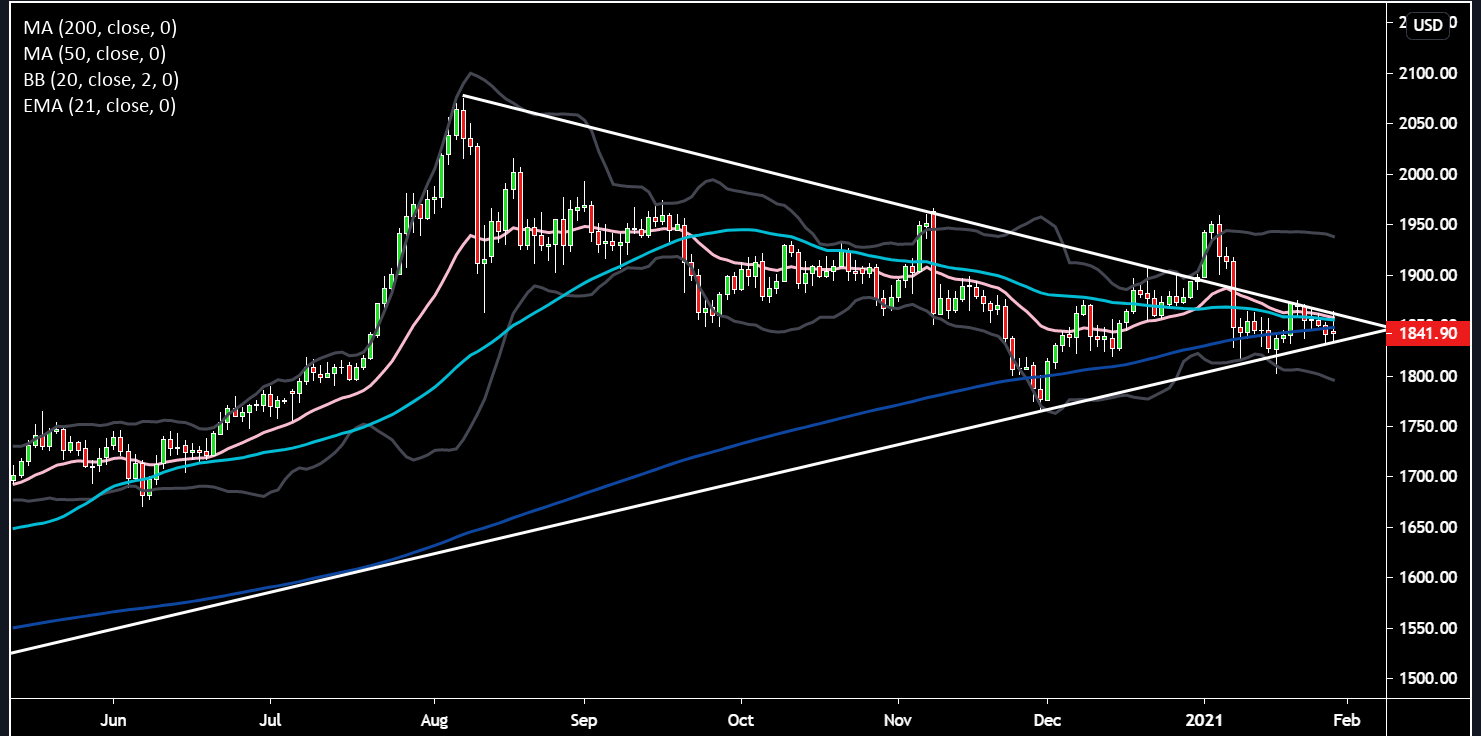
Moving onto Gold which some believe is now being replaced by Bitcoin, it’s reaching a pivotal point in terms of price action. Despite a weaker dollar and weaker real yields the risk-on bug has settled over equity markets and Gold has been given the cold shoulder. All 3 moving averages are converging towards each other with crossovers in either direction giving more hints to traders. A large triangle pattern has formed. $1830 is an important support level which has seen multiple tests in the past, it also coincides with the uptrend line from March lows. Will be interesting to see whether price breaks out up or down.
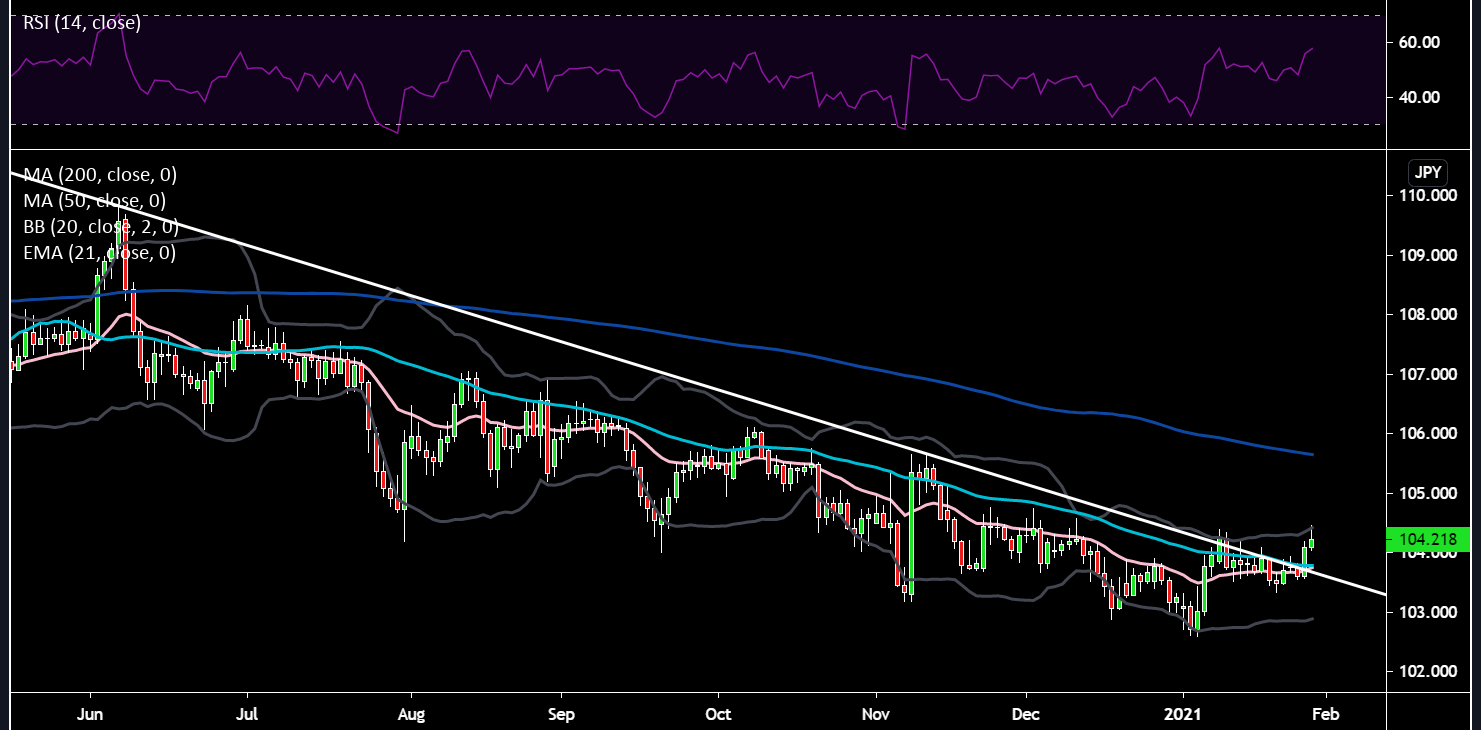
USDJPY
This classic cross has put in some impressive moves of late and is starting to look quite bullish on the charts. USD/JPY has been in a slow grinding downtrend since the March highs, not able to overcome the downtrend line, but yesterday price surged through the downtrend line as some stops were probably triggered. Not only the downtrend line was breached, but so was the pink 21-day EMA and light blue 50-day SMA - with the former now looking to make an upward bullish crossover with the latter. The RSI is no where near overbought either. Although bullish gains were pared back today as price tagged the upper band of the Bollinger Band, if the dollar sees further strength I think we could see a move towards the dark blue 200-day SMA around the 105 level.
Related articles


Ready to trade?
It's quick and easy to get started. Apply in minutes with our simple application process.
The material provided here has not been prepared in accordance with legal requirements designed to promote the independence of investment research and as such is considered to be a marketing communication. Whilst it is not subject to any prohibition on dealing ahead of the dissemination of investment research we will not seek to take any advantage before providing it to our clients.
Pepperstone doesn’t represent that the material provided here is accurate, current or complete, and therefore shouldn’t be relied upon as such. The information, whether from a third party or not, isn’t to be considered as a recommendation; or an offer to buy or sell; or the solicitation of an offer to buy or sell any security, financial product or instrument; or to participate in any particular trading strategy. It does not take into account readers’ financial situation or investment objectives. We advise any readers of this content to seek their own advice. Without the approval of Pepperstone, reproduction or redistribution of this information isn’t permitted.