- English
- 简体中文
- 繁体中文
- ไทย
- Tiếng Việt
- Español
- Português
- لغة عربية
Excitement in oil is off the charts, are you ready for the OPEC+ meeting?
.jpg?height=93&quality=100)
Traders would be forgiven for getting some motion sickness from the wild rollercoaster ride the oil price was on last week. Volatility was the order of the day with price moving almost 6.2% intraday. The large selling seen last week has been pinned on systematic investors (CTAs) liquidating their positions as stop losses were triggered, volatility targeting changes, price slicing through short term-momentum indicators such as the 21-day EMA and 50-day SMA and lastly option gamma causing forced selling. The oil complex remains one of the most interesting spaces in markets currently. Drone strikes and trapped tankers in the Suez Canal – oil has it all. Below I’ll examine the key dynamics I believe traders should have on their radar to play in the oil space.
The main event this week will be the OPEC+ meeting on Thursday, with the street expecting another rollover of production cuts. At the 4th of March meeting, price closed just shy of $67, today price sits at $64.37. Given the softness and volatility in price we’ve seen recently it seems increasingly likely we’ll see production kept offline, importantly, Russia supports a roll-over of production from April to May and seeks a small output rise for itself in May – according to Reuters sources. I’d say the risk from this event would actually be tilted towards deeper cuts (if the oil price softens more leading up to the meeting), causing a knee-jerk reaction higher in prices. Last week, well placed OPEC+ sources confirmed the streets’ expectations that supply curbs into May should remain, given the lack of stabilization in the oil price. Shale production in the US is another piece of the oil puzzle that OPEC+ has to try and get right. It does seem like shale production has now peaked as companies use their cash to return capital to investors, pay down debt, M&A (consolidating the industry) as opposed to deploying it into new capex projects. Interestingly, the No Oil Producing and Exporting Cartels Act (NOPEC) is back in play as a group of US Senators reintroduced the legislation which will allow the government to take action against OPEC on the basis of price fixing.
The other major news story is the situation in the Suez Canal, the mammoth sized Ever Given tanker has been partially freed with the Suez Canal Authority Chairman telling Egyptian state TV that shipping activity could resume on Monday afternoon. Complicating efforts to move the ship were rock structures found at the ship’s bow. It seems like the worst case scenario of the ship breaking during an unloading of the cargo to reduce the vessel’s weight (if the refloating failed) has now been averted. This would help unblock the major traffic jam in global trade. To illustrate the importance of the Suez Canal, some estimates put the amount of oil being held up around 10 mln barrels. A Lloyd’s analysis, published by the Financial Times found that 4.6 mln barrels traversed through the canal daily in 2018.
On the geopolitical front, Saudi Arabia recently proposed a ceasefire to the Houthi Rebels in an attempt to stem the spate of drone attacks targeting Saudi oil facilities. This would certainly go a long way in reducing some of the geopolitical risk premium embedded in the oil price. However, it seems these peace efforts were rebuked as an oil terminal was damaged by a drone attack on Friday. Fears of the 2019 Khurais attack causing crude to skyrocket is always a tail risk which lingers in the back of traders’ minds.
The demand side of the oil equation has been under pressure with the worsening virus situation in Europe as well as in Brazil and India. There has also been larger than expected refinery maintenance taking place in China that added to the lower demand from US refiners due to the Texas Deep Freeze seen recently. Despite this uncertainty the Saudi Aramco CEO seems unfazed and is very bullish about oil demand going forward. Dollar strength and softer risk sentiment as a result of broad equity market sell-offs could also act as a drag on bullish price action. On the supply side, besides the Suez Canal issue discussed above, Iran has managed to increase its oil exports despite US sanctions adding to the overall supply in the market. After last week’s build, US crude inventories have now increased for a fifth consecutive week.
Price action remains stuck between $62 and $65. With a breakout either side attracting more directional momentum. Price is hovering under $65 with topside resistance in the form of the 21-day EMA and the lower line of the ascending channel. The RSI is just below the 53 resistance too. If we see a move back into the price channel, I would look towards the $67 level as an initial price target. Downside support comes in at $62.50 (50-day SMA) and the white dotted horizontal support line around $62. If price was to take out the 23 March low of $60.30 then oil could slide down to $55 (next support level). On a seasonality basis oil has historically done well in April. It will be interesting to see in which direction price resolves, my bias leans towards the upside.
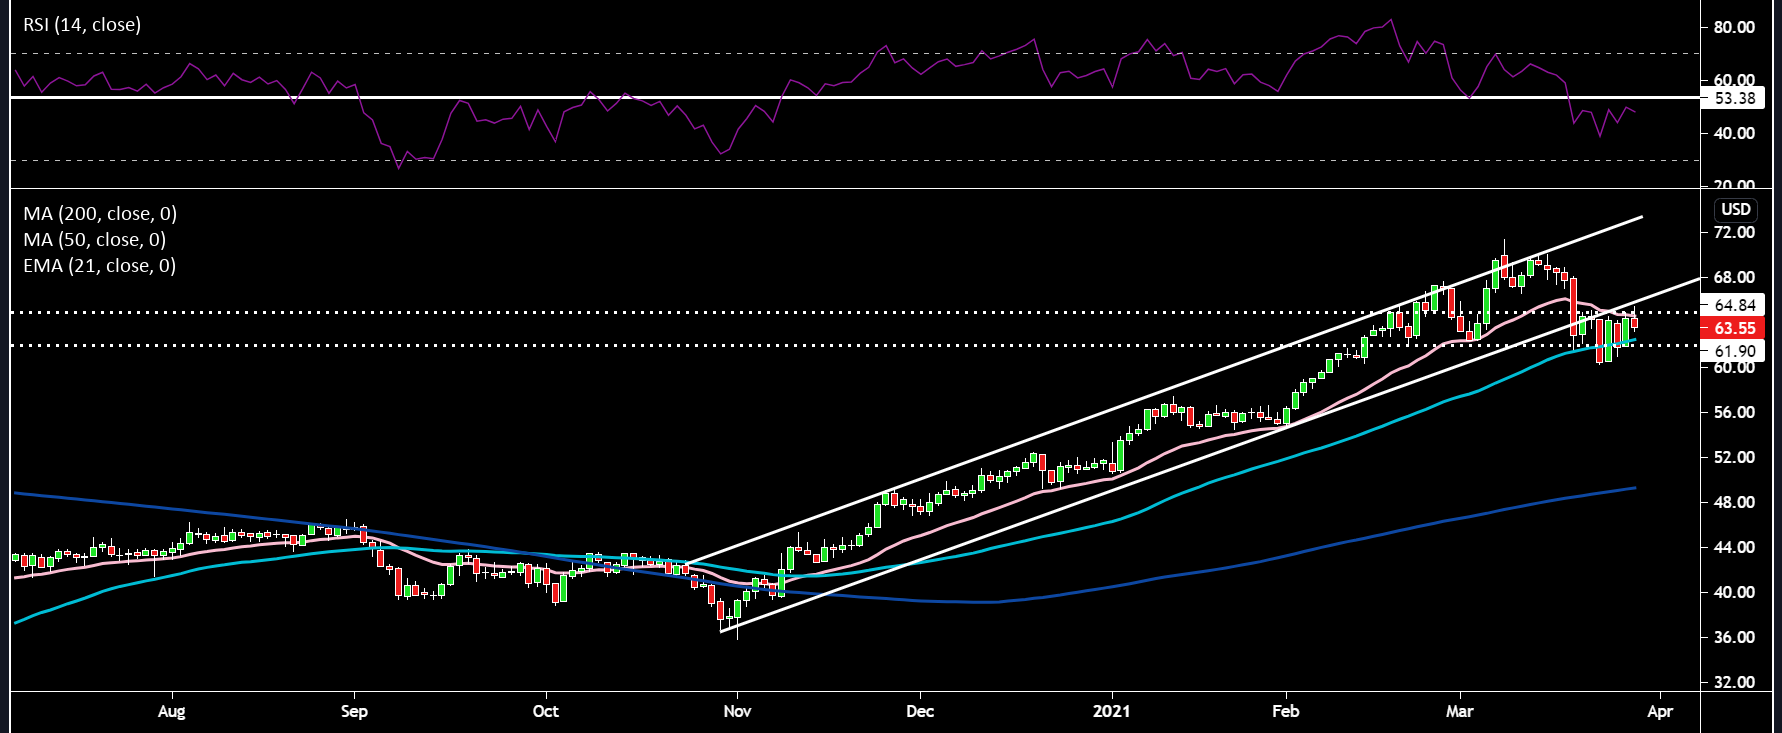
Pink line: 21-day EMA; Light Blue Line: 50-day SMA; Dark Blue Line: 200-day SMA
Related articles

Ready to trade?
It's quick and easy to get started. Apply in minutes with our simple application process.
The material provided here has not been prepared in accordance with legal requirements designed to promote the independence of investment research and as such is considered to be a marketing communication. Whilst it is not subject to any prohibition on dealing ahead of the dissemination of investment research we will not seek to take any advantage before providing it to our clients.
Pepperstone doesn’t represent that the material provided here is accurate, current or complete, and therefore shouldn’t be relied upon as such. The information, whether from a third party or not, isn’t to be considered as a recommendation; or an offer to buy or sell; or the solicitation of an offer to buy or sell any security, financial product or instrument; or to participate in any particular trading strategy. It does not take into account readers’ financial situation or investment objectives. We advise any readers of this content to seek their own advice. Without the approval of Pepperstone, reproduction or redistribution of this information isn’t permitted.