- English (UK)
- English (UK)
Analysis

Before getting on to that, however, it’s necessary to delve into the weeds of bond maths, and outline some definitions.
As noted above, duration is a mathematical concept that refers to the sensitivity of an asset – typically a bond – to changes in interest rates; the higher the duration, the more sensitive an asset is to shifts in rates, and vice versa. Bond duration is relatively easy to measure, as fixed income products pay a regular amount, on a fixed schedule, for the life of the instrument. In contrast, equities do not necessarily pay a regular amount on a regular timescale, with said payments instead being constructed as dividends, which are paid subject to a company’s performance and financial situation at a given time. With this in mind, one could consider equity duration as a measure of how long an investor must receive dividends in order to be repaid the purchase price of the stock. It is that irregularity of cash flows that makes equity duration difficult to measure and means that, at best, it is only possible to approximate a value for such a concept.
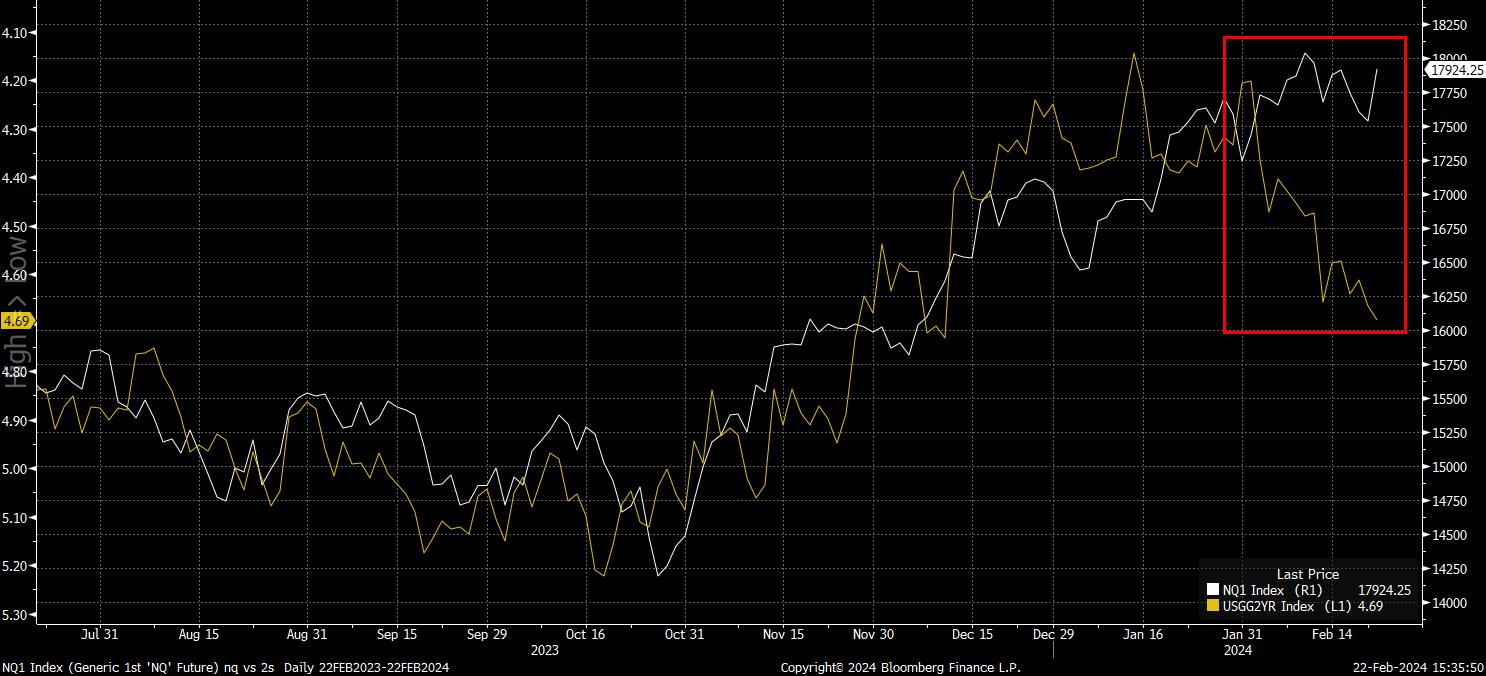
With all of that said and done, there are ways that one is able to gauge the relationship between equities and fixed income. At a, perhaps, crude level, a simple overlay chart helps to paint a picture – as shown below, the inverse relationship (2s are on an inverted Y-axis here) between front-end rates and the Nasdaq 100 has broken down since the end of January.
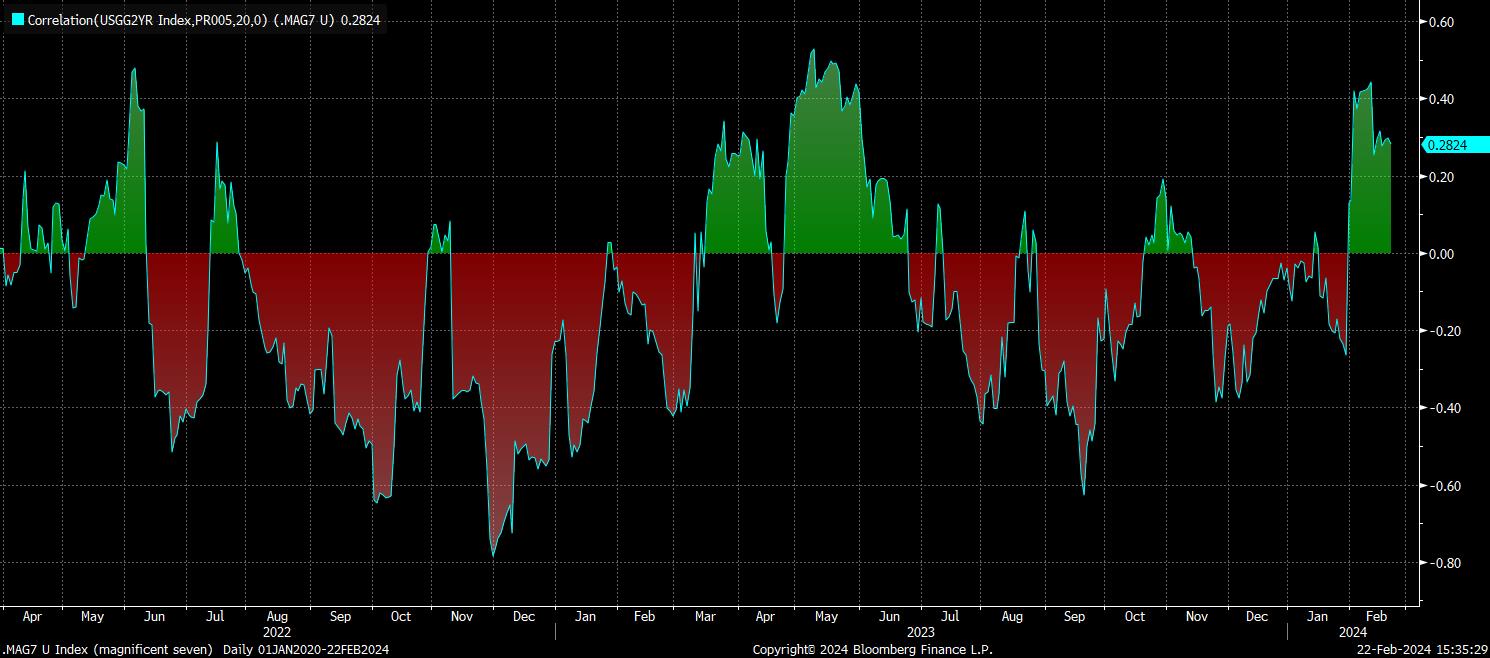
Alternatively, for those of a statistical persuasion, one can look at the correlation between equity and bond prices. This is exactly what I’ve done below, in examining the 20-day correlation between a market-cap weighted index of ‘magnificent seven’ stocks, and the 2-year Treasury yield.
As is easy to see, the correlation between the two has flipped positive over the last few weeks, implying that stocks and bonds are now moving in the opposite direction to each.
In any case, while all this is interesting, it means little on its own without considering the implications of such a shift.
The first is that, in contrast to what has been the prevailing logic for some time now, higher real rates may not in fact prove to be the headwind to risk that we have expected. However, on the same note, there is perhaps a case to be made that lower real rates, which are likely to prevail as central banks ease policy as the year progresses, may not prove to be as much of a boon for the tech sector as in prior cycles. Despite this, the broader policy backdrop should remain supportive for risk, with the central bank put remaining alive, and more flexible than before.
On a similar note, it could also be argued that the broader market is, perhaps, less exposed to any potential resurgence in inflation, or stickier-than-expected price pressures, owing to the less rate-sensitive nature of the market’s most dominant sector.
The final significant conclusion from all this, particularly after NVDA earnings yesterday, the tech behemoths have proved that they are able to deliver on earnings expectations, and in many cases vastly surpass said estimates, no matter the interest rate environment. Of course, this is much more of a longer-term consideration for the sector, though does bode well for longer-run profitability.
Related articles


The material provided here has not been prepared in accordance with legal requirements designed to promote the independence of investment research and as such is considered to be a marketing communication. Whilst it is not subject to any prohibition on dealing ahead of the dissemination of investment research we will not seek to take any advantage before providing it to our clients.
Pepperstone doesn’t represent that the material provided here is accurate, current or complete, and therefore shouldn’t be relied upon as such. The information, whether from a third party or not, isn’t to be considered as a recommendation; or an offer to buy or sell; or the solicitation of an offer to buy or sell any security, financial product or instrument; or to participate in any particular trading strategy. It does not take into account readers’ financial situation or investment objectives. We advise any readers of this content to seek their own advice. Without the approval of Pepperstone, reproduction or redistribution of this information isn’t permitted.