- English
US nonfarm payrolls playbook: can goldilocks continue for markets

While equity has been strong, we’ve also seen US Treasury yields moving higher, and in some cases breaking out, as US growth data points consistently beat low expectations – we’ve seen these beats in new homes sales, the Q1 GDP revision, durable goods and consumer confidence, a name a few.
The poor ISM manufacturing read (at 46), seen this week, didn’t surprise too greatly as it was the seventh consecutive reading below 50 (the growth/contraction level). However, importantly, we saw the ‘prices paid’ sub-component – the inflationary aspect of the report - fall to 41.8 and well below expectations.
One could easily feel this week’s US ISM services print (Friday 00:00 AEST) may be the more influential data point, given just how important the service sector is to the GDP calculation. The market expects growth in this data point, with the diffusion index eyed at 51.3 (from 50.3) – the prices paid, the employment and the new orders components will be closely watched.
The market theme
To simplify the current Goldilocks economic backdrop: Growth may be below potential, but the US recession call gets pushed out and is a 2024 story, labour markets are hot, but wage pressures are abating, and inflation continues to grind lower.
The fact the USD has been moving sideways – with the US dollar index stuck in a 106 -101 range throughout all of 2023 has also been helpful for equity appreciation.
Touching on inflation, the market sees the risk for US core PCE inflation to continue falling and to come in below the Fed’s year-end projection of 3.9%. We’ll get a clearer view on that call on 12 July when we see the US June CPI print. At this point, the Cleveland Fed CPI headline inflation nowcast model sits at 3.1%, which would be a big fall, thanks somewhat to base effects, from the last headline CPI print at 4%. The model for core CPI is 5.1%. The current consensus from economists is 3.1% and 5%, respectively.
The US CPI print, along with the PPI inflation print (due 13 July), will go some way to help us forecast the June core PCE inflation print (due 28 July).
US nonfarm payrolls – due Friday 22:30 AEST
The continued strength US labour market has also been a factor in this Goldilocks dynamic. Only a month ago the consensus felt that it was a risk positive to see a cooling labour market and a higher unemployment rate. It now seems the thesis has evolved, and the market wants to see strong job creation, conditional on subdued wage growth.
With this in mind, we can look at a simple playbook for the nonfarm payrolls (NFP) report.
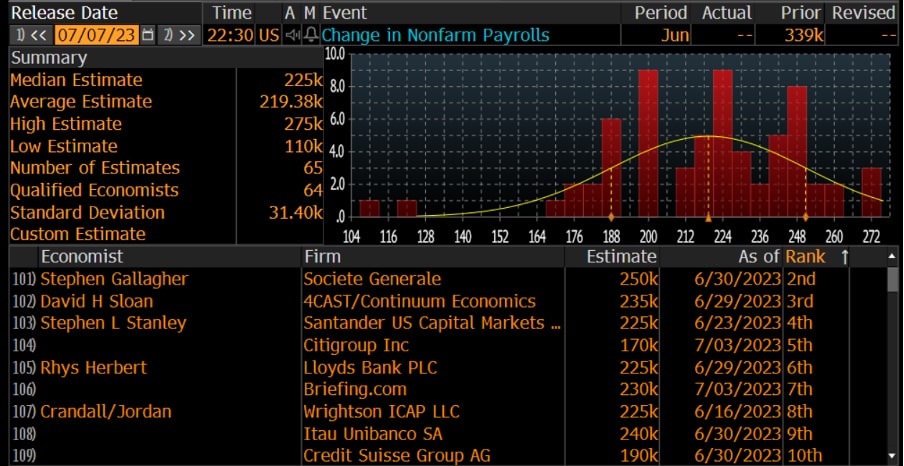
The economist’s consensus expectations:
Change in Nonfarm payrolls +225k – the economist's estimates range from 275k to 110k
Average Hourly Earnings (AHE) +0.3% MoM / 4.2% YoY (the economist’s range of estimate – 4.2% to 4.3%)
Unemployment rate – 3.6% (from 3.7%)
(The distribution in the economist’s calls)
AHE YoY% change
.png)
The playbook
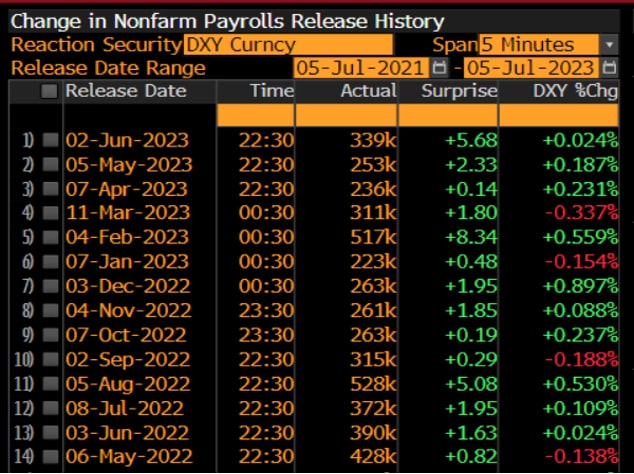
The form guide suggests we get an above consensus change in the NFP, where many have noted the outcome has beaten the consensus median forecast in the last 14 consecutive reports. One would therefore expect the market to be positioned a print closer to 250k - 260k jobs. Also consider the 12-month average is 336k jobs, so the odds are stacked that the NFP print comes in above expectations – that said, I think anything above 200k is a solid level of job creation.
(The form guide – NFP vs expectations + USD reaction)
Above consensus NFP and a lower AHE – the nirvana play
If we see above 225k and AHE prints 4.2% or below, then risky assets should find buyers – naturally, should AHE’s fall below 4%, it will greatly surprise and would suggest the Fed have just one more hike to go in this cycle, which would sit well with equity bulls and USD shorts.
Above consensus NFP and a higher AHE
If AHEs comes in above 4.3% but we also saw NFPs above 230k then bond yields should push higher, and we may see the interest rate market move to price November fed funds closer to 5.6%. The risk here is for a USD stronger, with the NAS100 and gold trading lower.
Lower than consensus NFP and a lower AHE
A below 200k read on jobs and subdued wages may see a limited initial reaction in equity with small downside risk in the USD (gold upside) – the unemployment rate may then play an influence here (this is calculated from the Household survey). It wouldn’t surprise if we see equity buyers emerge as the session wore on.
Lower than consensus NFP and a higher AHE
An NFP below 200k and AHE at or above 4.3% is perhaps the most risk-negative scenario of the playbook. Here, the NAS100 may fall by more than 1% and in FX, higher beta currencies (such as the AUD) under pressure.
In summary, the market is very comfortable with a strong labour market – that is, if inflation is grinding lower – if this dynamic is maintained, the VIX index should remain below 15%, and equity finds buyers on pullbacks and higher highs are the greater risk.
Related articles

.jpg?height=420?quality=30)


The material provided here has not been prepared in accordance with legal requirements designed to promote the independence of investment research and as such is considered to be a marketing communication. Whilst it is not subject to any prohibition on dealing ahead of the dissemination of investment research we will not seek to take any advantage before providing it to our clients.
Pepperstone doesn’t represent that the material provided here is accurate, current or complete, and therefore shouldn’t be relied upon as such. The information, whether from a third party or not, isn’t to be considered as a recommendation; or an offer to buy or sell; or the solicitation of an offer to buy or sell any security, financial product or instrument; or to participate in any particular trading strategy. It does not take into account readers’ financial situation or investment objectives. We advise any readers of this content to seek their own advice. Without the approval of Pepperstone, reproduction or redistribution of this information isn’t permitted.