- English

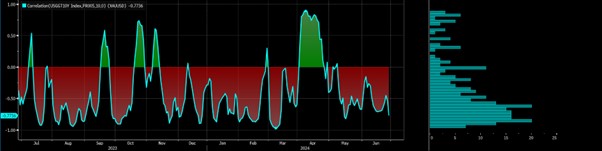
But it does show us that the US bond markets and their effects on the USD are starting to drive the gold market more intently. For more fundamental and thematic-based gold traders, this does matter.
10-day rolling correlation between gold and US 10yr real Treasury yields
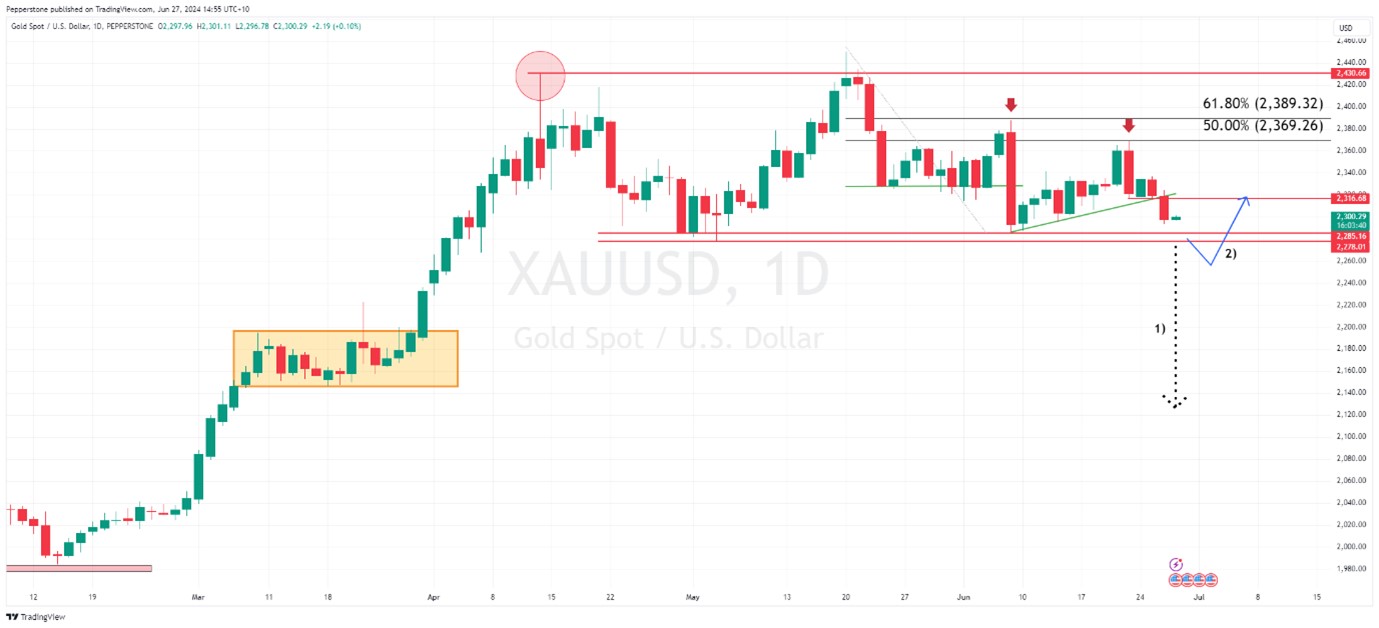
For the technical and price action traders, we are coming into big levels on the higher timeframes and what happens next could be significant for the future direction of the gold market. As we head to the lower levels of the multi-month range of $2430 to $2277, for those working off higher timeframes, we can now plan ahead.
Within this multi-month range we have seen an interesting roadmap of supply v demand and how this has shaped the price action and the technical set-up. I have been enthused by how price has respected fibo levels of late – we saw this on 7 June with the sizeable bearish outside day reversal coming directly off the 61.8% fibo of the $2450 (20 May) to $2286 (7 June) sell-off. Then on 21 June, we saw another bearish outside day reversal, but this time off the 50% fibo of those same levels.
Two outside day reversals within the space of 10 bars speak to a market where the buyers have tried to push price higher, but the sellers have easily wrestled back control and pushed price lower – essentially within the range, it has been a seller’s market.
4hr chart
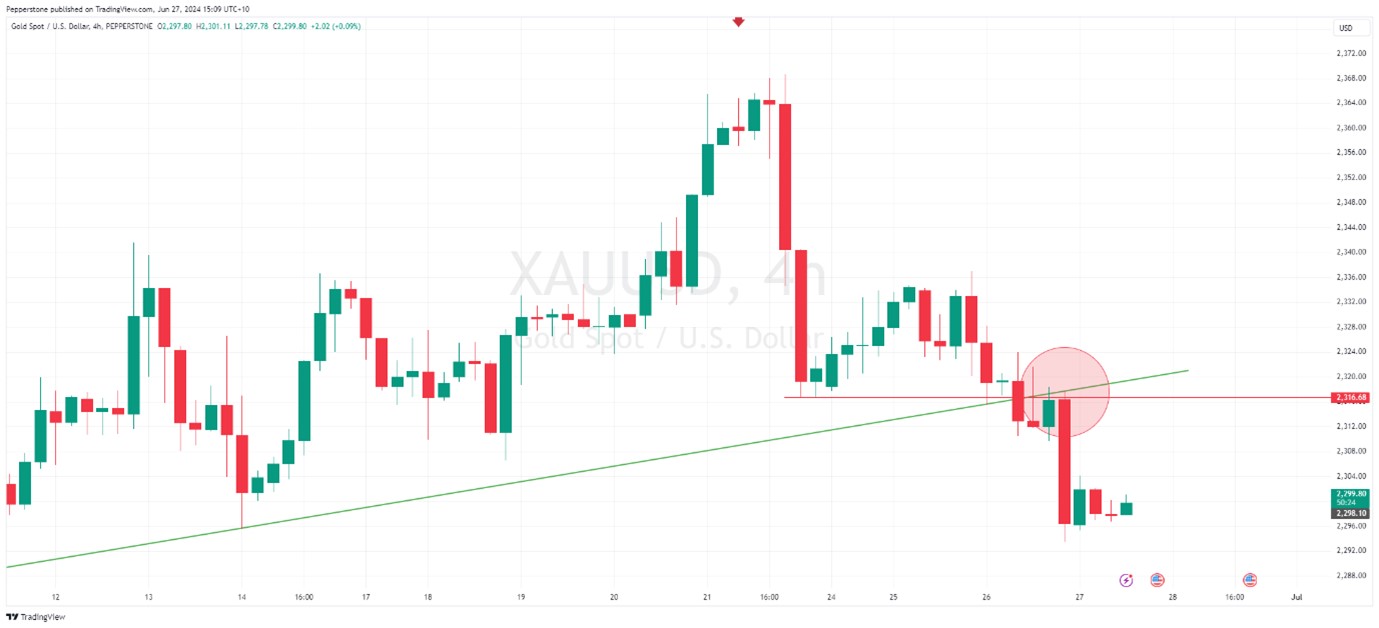
Many have also noted the break of Friday’s low ($2316.67), along with the break of the rising trend support (drawn from the 7 June low). We then saw a retest and subsequent rejection of the former rising trend with a push lower into $2293 – I have displayed below on the 4hr chart (above). Given this price action and structure, traders are on notice for a possible lower and ultimate test of the multi-month range lows into $2286/77.
This is a big level for the bulls to defend and given 60% of clients' open positions are now held on the long side, so many are feeling these levels hold in the near term.
Daily chart of gold
The playbook from here:
By way of a quasi-plan of attack, and while there is obviously a huge range of outcomes ahead of us, I have looked at two scenarios that could define a playbook.
- A failed breakout below the range lows, with the daily bar subsequently closing back inside the range.
- A daily close outside of the range lows, where I would position for momentum to build and for a possible trend lower into $2150.
On scenario 1 - if the range is to be tested, we could easily see a downside break, with stops triggered resulting in a quick-fire move into $2260/50 – once the market feels the stop loss run has abated the buyers (algo’s) step back in pushing price back inside the range for a daily close above $2286/77 – that would be the bullish scenario. Should that play out, I would be placing buy-stop orders above the high of that day’s closing bar. The view would be if the price saw follow-through buying and printed a higher high, the momentum could see the gold price kick towards $2340/60.
On scenario 2) - the other scenario I am looking at would be a daily close below the range lows of $2377 – this is where the art of breakout trading kicks in, and while many breakouts fail, a closing break below $2277, especially on increased range expansion, could ramp up the probability that gold starts to bear trend - where the range target, based on a measure move, would be below $2150.
Given the increasing relationship between gold and the US bond market, I could offer a strong guess at what drives gold through $2277 – and this can be helpful for managing risk, especially into tomorrow’s US core PCE inflation report. However, for the more technical heads out there, we are coming into important levels in gold, and being prepared with a strong game plan seems advantageous.
Good luck to all.
The material provided here has not been prepared in accordance with legal requirements designed to promote the independence of investment research and as such is considered to be a marketing communication. Whilst it is not subject to any prohibition on dealing ahead of the dissemination of investment research we will not seek to take any advantage before providing it to our clients.
Pepperstone doesn’t represent that the material provided here is accurate, current or complete, and therefore shouldn’t be relied upon as such. The information, whether from a third party or not, isn’t to be considered as a recommendation; or an offer to buy or sell; or the solicitation of an offer to buy or sell any security, financial product or instrument; or to participate in any particular trading strategy. It does not take into account readers’ financial situation or investment objectives. We advise any readers of this content to seek their own advice. Without the approval of Pepperstone, reproduction or redistribution of this information isn’t permitted.