- English
Week Ahead Playbook: Politics, Payrolls, and Policy

The Week That Was – Themes
Last week was, perhaps, rather typical of the choppy and indecisive trade that is typically seen towards month-end, with rebalancing flows – exacerbated by June also marking the end of the second quarter, and first half of the year – dominating for much of the past five trading days, and rather muddying the waters when it comes to defining a precise narrative which can be assigned to suit the price action.
On the whole, however, despite this choppiness, volatility remains relatively low across the board, with markets appearing to have entered the typical summer lull, just as the sun begins to shine (at last!) here in the UK.
The VIX continues to trade with a 12 handle, and just inches above the cycle lows seen earlier in June, while BofAML’s MOVE index of implied Treasury vol also remains subdued. G10 FX vol has ticked somewhat higher, though much of this owes to higher EUR implieds as a result of ongoing French elections, with implieds elsewhere in G10 remaining considerably below the 25th %ile of their respective 52-week ranges.
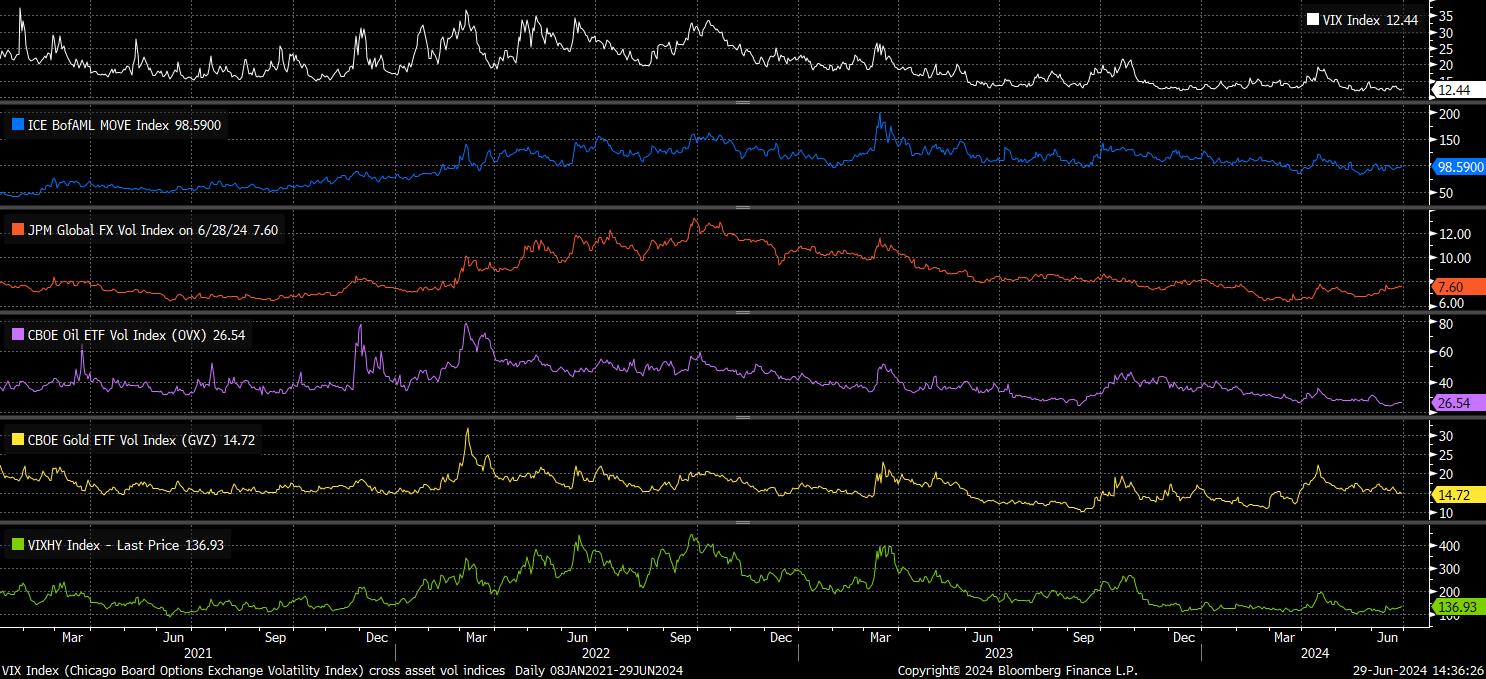
As discussed in these pages many times in the first half of the year, the return of the central bank ‘put’, in a more flexible and forceful form than before, continues to substantially insulate markets from external shocks, while also continuing to give investors confidence to move, and to stay, further out on the risk curve. This should continue into H2, particularly with the BoE set for the first cut in August, and the first Fed cut possibly coming as soon as September.
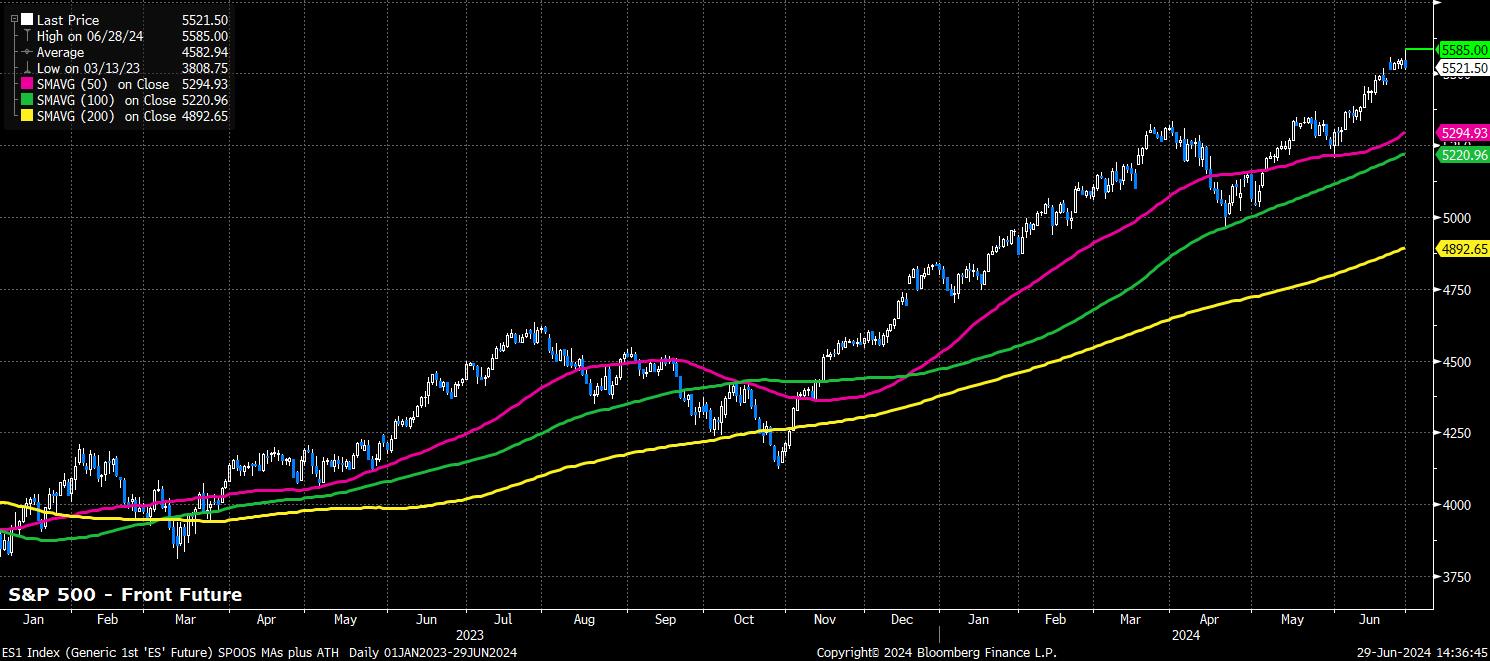
To this end, the S&P 500 notched an impressive 15% gain in the first six months of 2024, with ten of the eleven sectors ending H1 in the green, as the rally was led by Information Technology and Communication Services. The market extended upon these gains on Friday, with the S&P and Nasdaq 100 both notching fresh intraday records, albeit with those gains paring into the close.
Nevertheless, the S&P 500 has notched 31 all-time closing highs so far this year, with the index having ended at a fresh record on one-in-four trading days.
The path of least resistance, clearly, continues to lead to the upside.
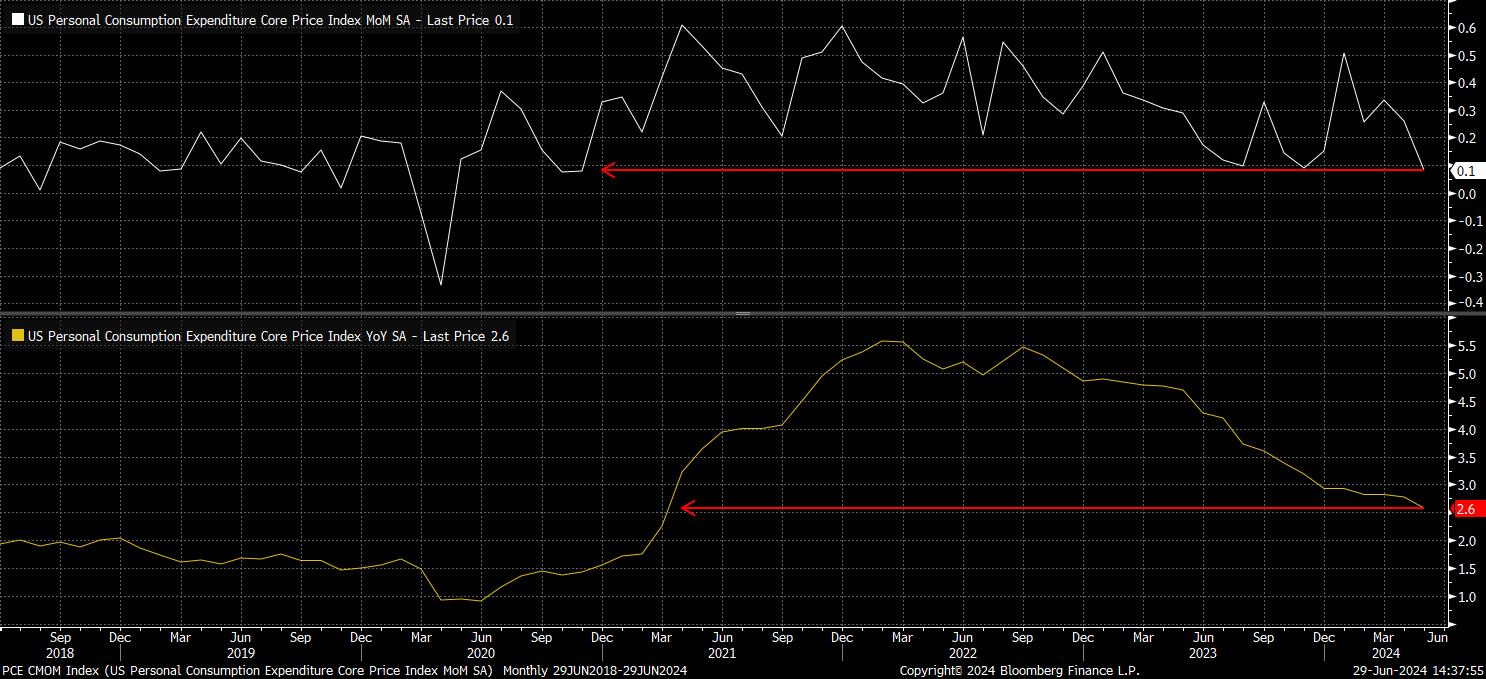
Supporting the case for the aforementioned September FOMC cut – which remains my own base case – was last week’s PCE data, by far the standout event on what was an otherwise light economic docket.
The report showed the core PCE deflator rising just 0.1% MoM in May, bang in line with consensus, and down from an upwardly revised 0.3% MoM rise a month prior. To two decimal places, the MoM core PCE figure was 0.08%, representing the slowest monthly increase in the Fed’s preferred inflation gauge since back in November 2020.
On a YoY basis, the PCE report was similarly welcome news to policymakers. Core PCE rose 2.6% YoY in May, the slowest pace since early-2021. Put together, this data should help to provide the FOMC with additional ‘confidence’ that the US economy continues on its path back towards 2% inflation, in line with the message portrayed in the most recent CPI report released earlier in the month.
Of course, ‘one swallow doesn’t make a summer’, hence policymakers will look for further confirmation of this disinflationary trend having become embedded before pulling the trigger on the first 25bp cut; the USD OIS curve continues to fully discount said move by November, albeit pricing a 2-in-3 chance that such a cut comes in September, while pricing a total of 40bp of cuts this year.
A handful of other notable US datapoints were released last week, though had little market-moving impact.
First quarter GDP was, as expected, revised 0.1pp higher to 1.4% on an annualised QoQ basis, confirming that the first three months of 2024 snapped a 6-quarter run of GDP having grown faster than 2%, and providing further evidence of the economy continuing to normalise, with both growth rates, and price pressures, continuing to ebb.
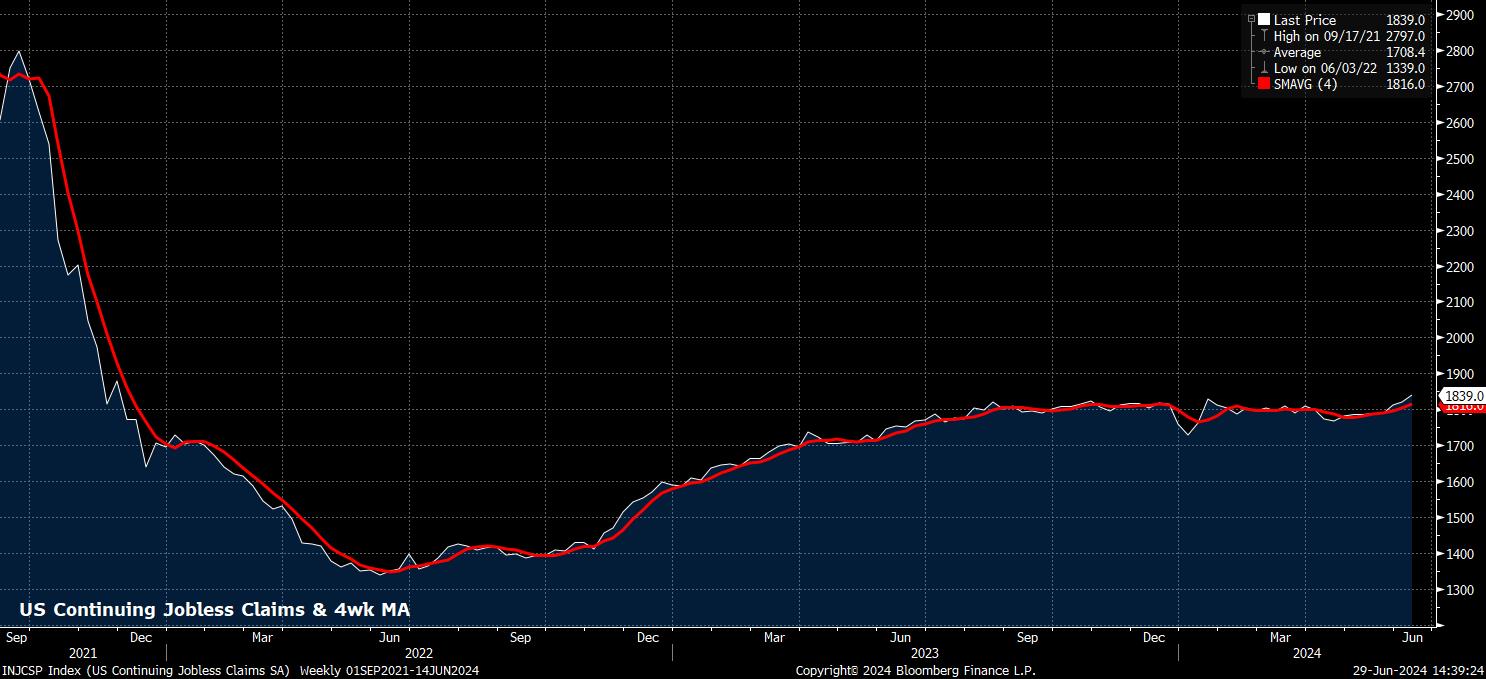
As economic momentum wanes a little, signs are continuing to emerge of cracks beginning to form in the labour market. Continuing jobless claims, for example, rose to 1.839mln in the week to 15th June, a considerable rise from the 1.821mln seen in the prior seven days, and the highest level since November 2021. With this data referencing the June nonfarm payrolls survey week, the soft claims print could introduce some downside risk for the NFP figure, due this Friday 5th July.
Outside of the United States, it was ‘down under’ where market participants got what was perhaps the most interesting development of the week.
Headline Australian CPI rose a chunky 4.0% YoY in May, above both estimates for a 3.8% YoY increase, and the prior 3.6% YoY rise. Clearly, this is a pace of inflation that remains well above the RBA’s target range, but also an inflation trajectory that is the opposite to that which said policymakers are seeking.
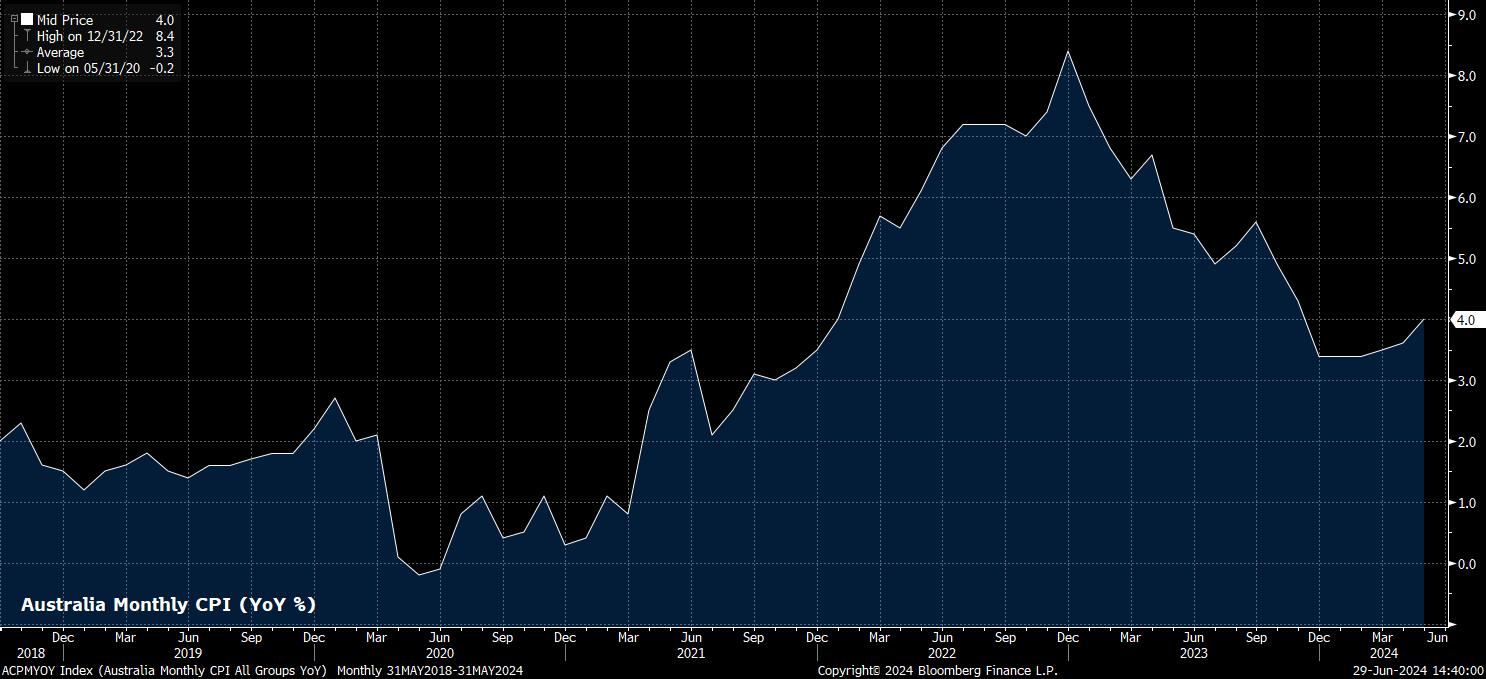
Naturally, the data inspired a hawkish market reaction, seeing the Aussie dollar end the week as the best performing G10 currency, and seeing Aussie rate futures hawkishly reprice, now discounting a roughly 50-50 chance that the RBA hike by the September meeting.
Q2 CPI on 31st July will likely be the key determinant of whether another hike is to be delivered, though such a move was discussed by the Board at the last meeting, with the policy statement noting that the Board aren’t “ruling anything in or out”. That said, even if the RBA are to move in the opposite direction to all other G10 central banks – bar the BoJ – this should not necessarily spark a substantial rally in the AUD; continuing risks stemming from China’s dismal economic performance, as well as a rather sluggish pace of domestic growth, should continue to act as headwinds.
The Week That Was – Markets
Speaking of Japan, it was here that perhaps last week’s biggest – or, maybe, only – major market narrative lay.
Once more, desks and IB chats have lit up with chatter about potential ‘yen-tervention’, with the MoF remaining concerned over ‘excessive’ and ‘one-sided’ moves in the JPY, as USD/JPY rose north of the 161 figure, for the first time since 1986.
As has been discussed often in these pages, it’s important to recall that the MoF are not necessarily concerned about the absolute level of the JPY, nor are they attempting to defend a specific spot USD/JPY price, when determining if intervention is necessary. Instead, focus is typically on both the nature of the move – is it speculative, or in line with fundamentals? – and the speed of said move.
On both of these facets, the criteria for intervention appear not to have yet been met. The BoJ’s glacial pace of policy tightening, coupled with last week’s chunky 14bp rise in benchmark 10-year Treasury yields, would always exert upward pressure on USD/JPY. Meanwhile, in terms of speed, USD/JPY – as of Friday’s close – traded just 6 yen above the 30-day low, well off the 10 yen spread seen in advance of the most recent intervention rounds (circled, below).
_2024-06-29_14-40-29.jpg)
Besides the aforementioned moves in both the AUD and the JPY, price action in G10 FX produced substantially more ‘noise’ than ‘signal’. Fundamentally, though, most majors remain within relatively tight ranges, with the 104 – 106.50 in the DXY continuing to hold firm, and likely to do so for some time to come, particularly with the prospect of a September Fed cut, and continued easing elsewhere in G10, continuing to grow.
That was also the general theme of the fixed income space last week, with the 14bp rise in benchmark 10-year yields, and 16bp rise in 30-year yields, largely a function of substantial selling pressure into the close on Friday. Most likely, this can be put down to month- and quarter-end flows, particularly after a round of solid auctions earlier in the week – 5s and 7s both stopped through the when issued, while 2s stopped on the screws.
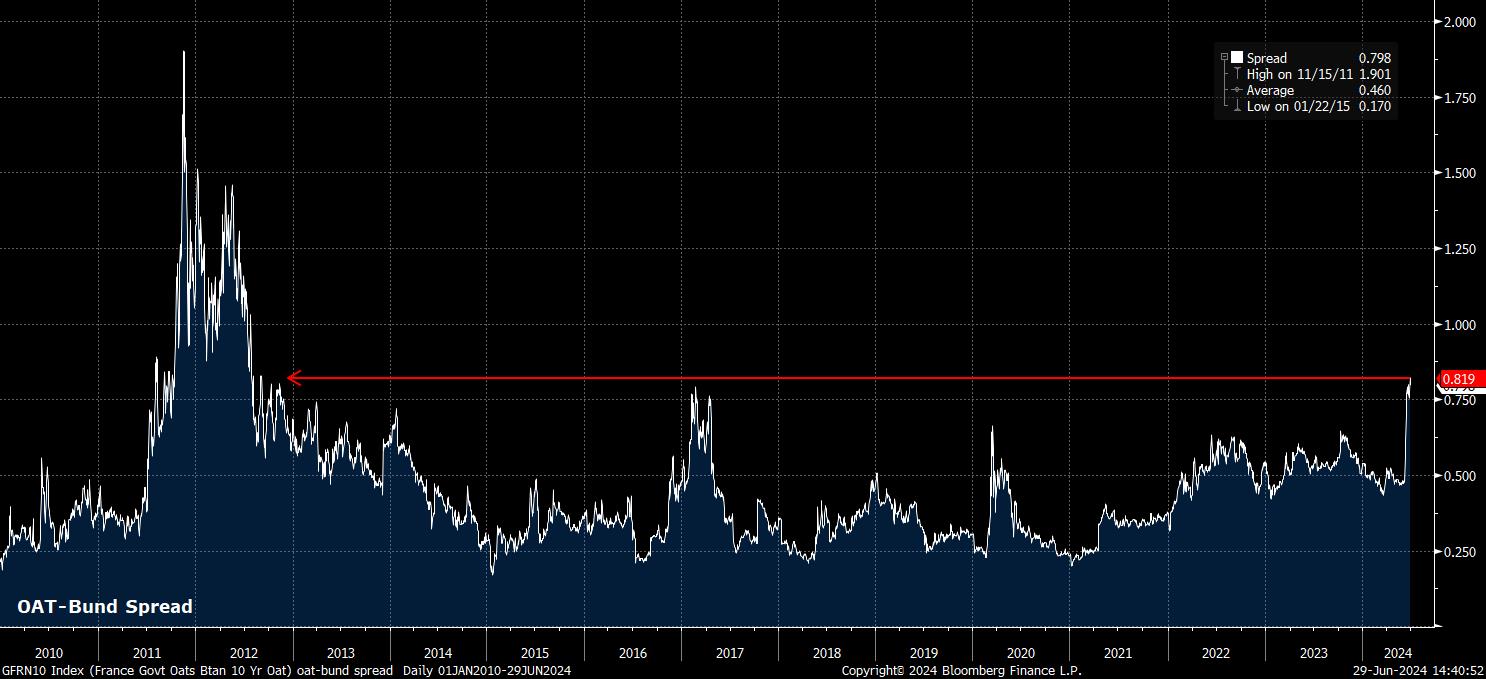
Of course, the same cannot be said for FI in the eurozone, where nerves persisted ahead of the first round of French legislative elections on Friday. OATs sold-off further into the weekend, taking the OAT-Bund spread north of 84bp, to fresh wides since 2012, while the CAC also stumbled, losing around 2% on the week, as participants left it until the last minute to de-risk ahead of the plebiscite, in which Le Pen’s ‘National Rally’ is set to come out on top.
In the equity space, meanwhile, and as noted above, the path of least resistance continues to lead to the upside, with both the S&P 500 and Nasdaq 100 notching their fourth straight weekly gains. It seems likely that this path will continue to be taken for the next couple of week at least, with participants now eyeing CPI on 11th July, and the start of Q2 earnings season on 12th July as the next key risks for equities – Friday’s jobs report can, likely, be shrugged off, barring a significant surprise, given its release on a day when most participants will be enjoying an extra-long Independence Day weekend.
Turning to commodities, price action was also relatively choppy.
Gold ended the week pretty much exactly where the yellow metal begun it, remaining in the broad $2,275/oz - $2,450/oz range that has now been in place for a couple of months, and looks set to remain so for the time being, particularly with ‘summer markets’ appearing to have now begun.
Front WTI, on the other hand, notched a third straight weekly advance, gaining around 1% over the last five trading days. Some may point to this being a sign of crude pricing an ever-greater geopolitical risk premium, particularly as the daily barrage of Middle East headlines appears to intensify, amid signs that Iran-backed Hezbollah are moving closer to conflict with Israel, in Lebanon.
The Week Ahead
Political developments are likely to be the market’s main focus in the week ahead, which is of course holiday-interrupted, owing to the US observing Independence Day on Thursday, seeing a raft of markets closed. This will also result in some early market closures on the Wednesday, while Friday is likely to be a day of thin volumes, and vastly reduced liquidity, as many make a long weekend out of the 4th of July celebrations.
Nevertheless, before those can begin, markets will have some electoral news to digest. Sunday brings the results of the first round in the ‘snap’ French legislative election called by President Macron after his party’s drubbing in European Parliament elections earlier in the month. While the new parliamentary makeup shan’t become clear until after the second round, next Sunday 7th July, markets will get an early indication as to how the legislative landscape will look after this Sunday’s results.
Naturally, this introduces significant downside gapping risk to both French, and European assets more broadly, particularly if Le Pen’s ‘National Rally’ appear on track for an absolute majority. The most market favourable outcome would likely be a Hung Parliament, resulting in a coalition led by the centre ground.
_eur_spot_2024-06-29_14-47-01.jpg)
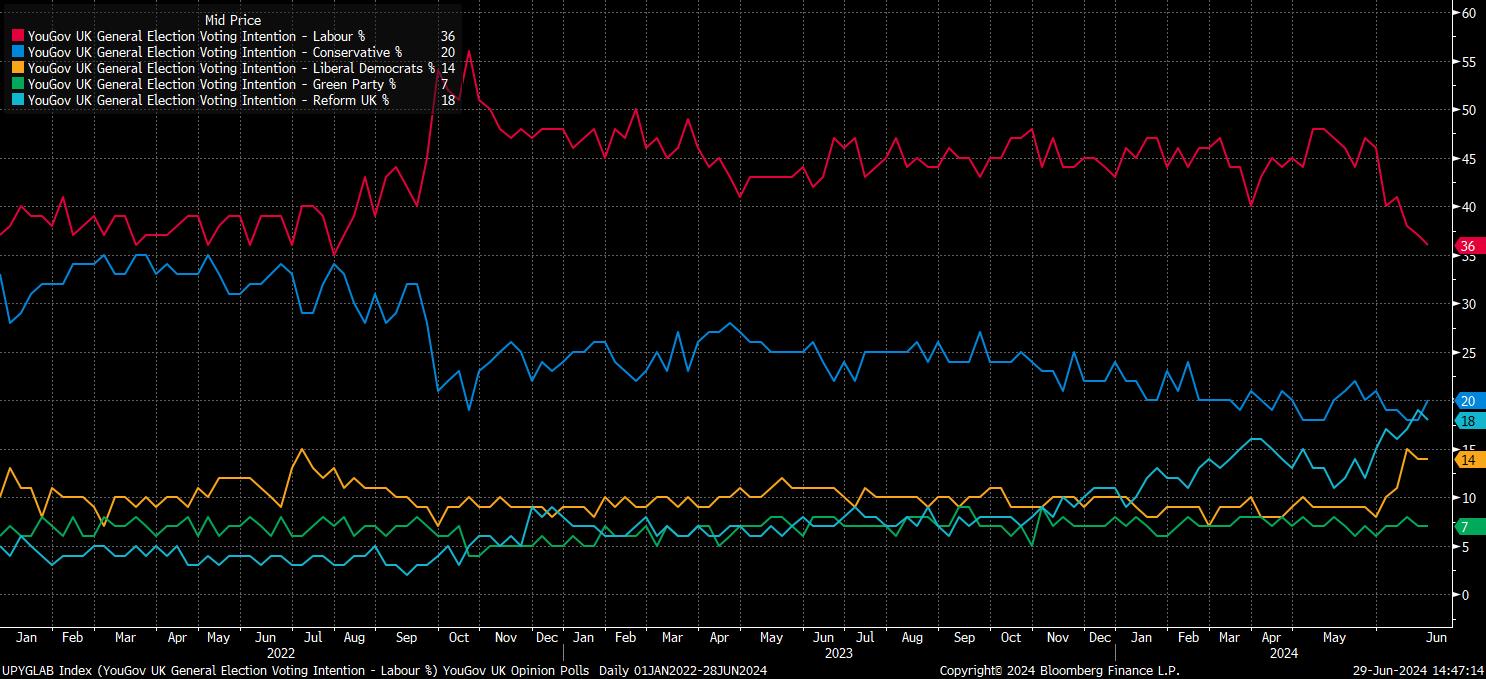
The week ahead also brings an election on this side of the Channel, though the result of the General Election appears all-but-certain at this stage, with Labour continuing to hold a roughly 20pt lead in opinion polling with less than a week to polling day.
A sizeable Labour majority, therefore, has already been priced by financial markets, which see little prospect for significant GBP vol over the election, with 1-week cable implieds trading at a paltry 6.25%, implying a move of +/- 90 pips over the entire trading week. Risks to the GBP, however, may be tilted somewhat to the downside, in the event of the election being closer than the triple-digit Starmer majority currently foreseen, though focus will likely move rapidly towards the new government’s fiscal plans, particularly with headroom severely limited, once the exit poll has been digested.
Away from the political sphere, this week’s data highlight stands as Friday’s US employment report, referencing June.
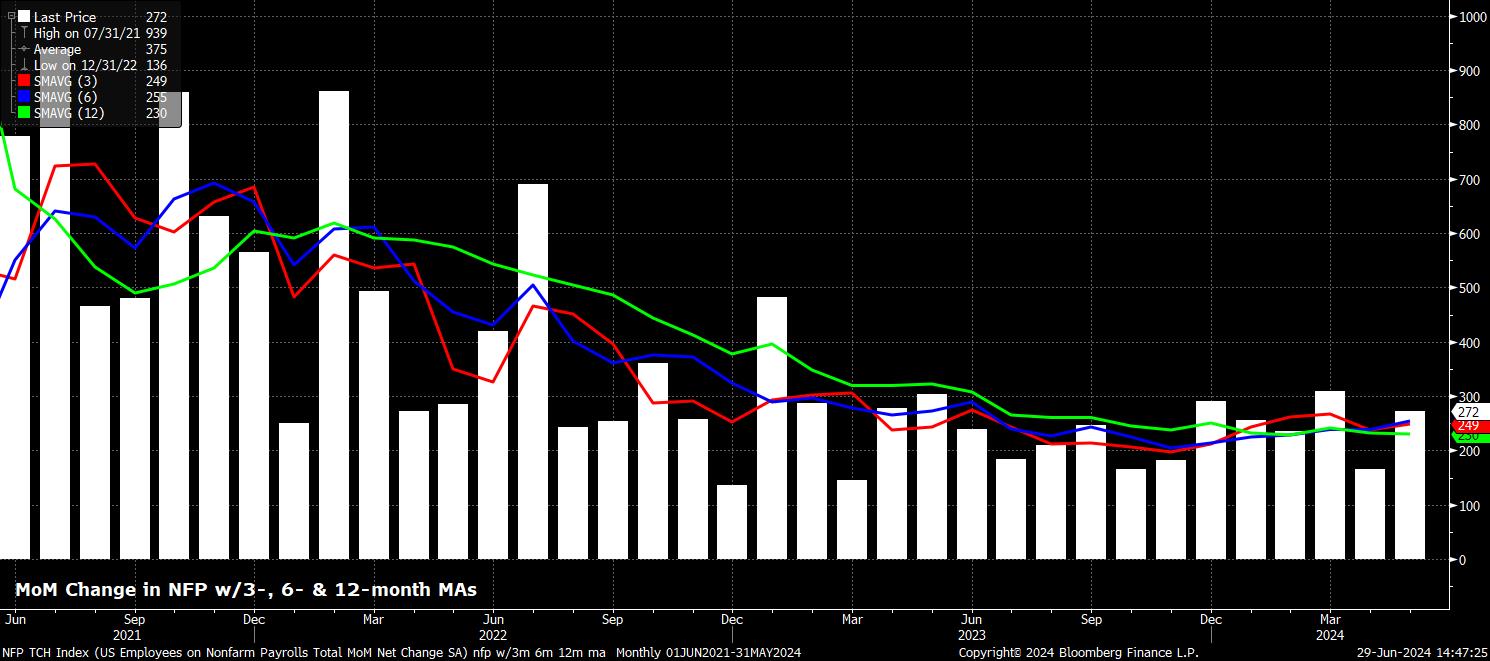
Headline nonfarm payrolls hare set to have risen +190k on the month, a slowdown from the +272k pace seen in May, and a pace that would be below both the 3-month average of job gains, and the ‘breakeven’ pace of job growth required for employment gains to keep pace with growth in the size of the labour force. Elsewhere, in the employment report, unemployment is seen steady at 4.0%, while average hourly earnings growth should cool to 0.3% MoM, from 0.4% MoM prior.
In any case, the policy implications of Friday’s jobs report are likely to be relatively limited. Clearly, the inflation side of the FOMC’s dual mandate continues to take precedence in determining the timing of the first rate cut, with Chair Powell having previously noted that only ‘unexpected’ labour market weakness would elicit a policy response. Market-related implications from the jobs data may also be somewhat more muted than usual, given the aforementioned Independence Day holiday.
Speaking of Chair Powell, remarks from him, along with ECB President Lagarde, will be keenly watched on Tuesday, though neither is likely to pre-commit to a policy path, with both instead still plumping for a data-dependent policymaking course. Both will be speaking at the ECB’s annual Sintra conference, with the week ahead bringing a whopping 14 separate engagements from ECB policymakers (oh, joy!), along with the release of minutes from the June FOMC (Weds) and ECB (Thurs) meetings.
While the Sintra conference is ongoing, markets will also receive their latest read on price pressures within the eurozone. Tuesday’s ‘flash’ CPI data is set to show headline CPI having cooled in June to 2.5% YoY, from a prior 2.6% YoY, while core CPI is also set to decline 0.1pp, to 2.8% YoY. This data shan’t be enough to push the ECB into back-to-back cuts at the July meeting, though should solidify the case for a further 25bp reduction at the September meeting, after the summer break.
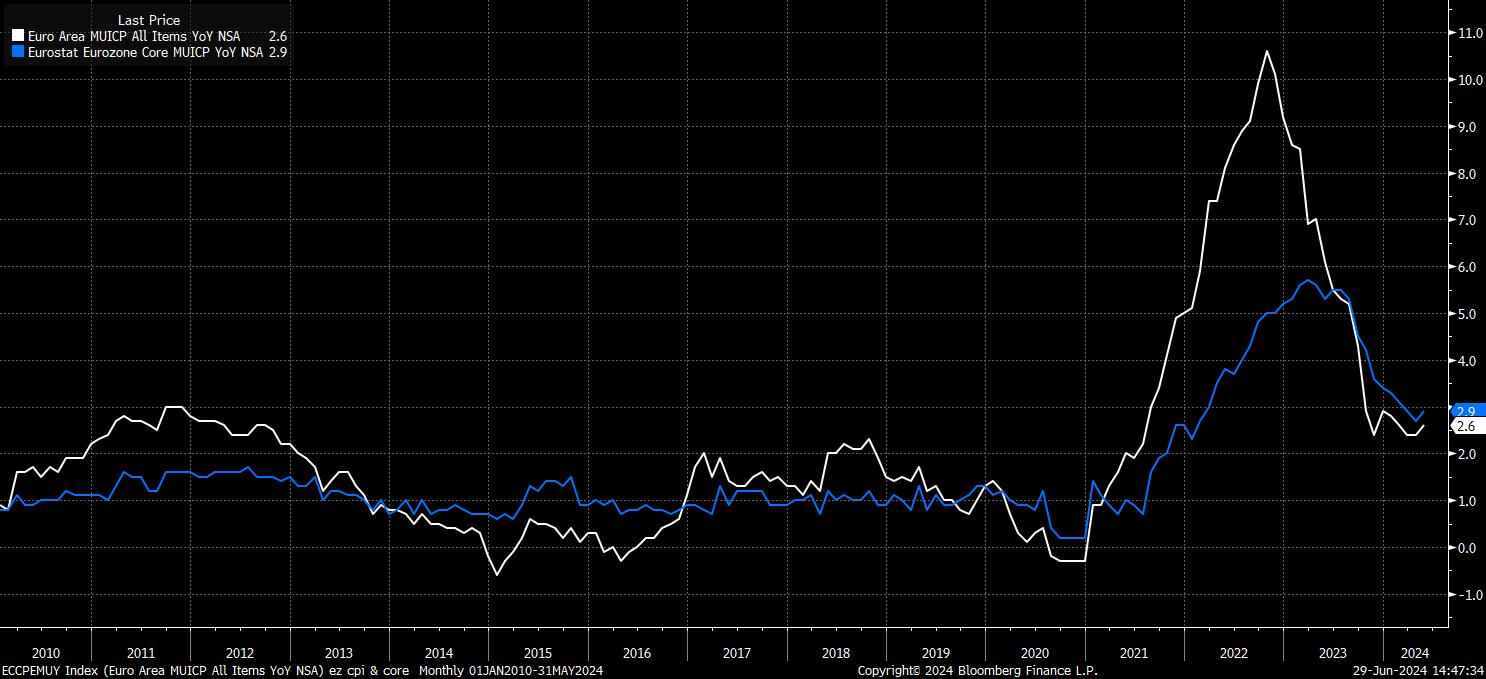
Besides that, market participants will have a plethora of PMI surveys to digest throughout the week, as is typical for the start of a new month. Said surveys will be closely parsed for further signs of economic momentum waning, in addition to the continued erosion of price pressures, while the US ISM gauges will, as always, be useful leading indicators for Friday’s payrolls print.
Wednesday’s US ADP employment change, however, will be anything but, having become something of a random number generator of late, and tending to bear little-to-no resemblance to the actual nonfarm payrolls print. The May JOLTS job openings figures can also be ignored when compiling your NFP sweepstake guess, though should show a further loosening in the labour market, with openings set to fall to 7.86mln, from 8.1mln in April.
Related articles
The material provided here has not been prepared in accordance with legal requirements designed to promote the independence of investment research and as such is considered to be a marketing communication. Whilst it is not subject to any prohibition on dealing ahead of the dissemination of investment research we will not seek to take any advantage before providing it to our clients.
Pepperstone doesn’t represent that the material provided here is accurate, current or complete, and therefore shouldn’t be relied upon as such. The information, whether from a third party or not, isn’t to be considered as a recommendation; or an offer to buy or sell; or the solicitation of an offer to buy or sell any security, financial product or instrument; or to participate in any particular trading strategy. It does not take into account readers’ financial situation or investment objectives. We advise any readers of this content to seek their own advice. Without the approval of Pepperstone, reproduction or redistribution of this information isn’t permitted.


