17 February 2020 - The ultimate week ahead playbook

Asian equities are mixed, with buying in the ASX 200 and Hang Seng, while the Nikkei 225 finds sellers, while USTs are down a basis point, while oil prices have failed to follow-through in the recent short-covering rally. There has been some deterioration in sentiment after a spike in coronavirus deaths post the change in the Chinese counting methodology, but the market hasn't responded too aggressively, and its concern lies with the upcoming data flow and the prospect of a slowdown in the Asian and European numbers.
The GBP has regained its composure in the wake of UK chancellor Sajid Javid resigning, as he is considered fiscally prudent, and his replacement (Rishi Sunak) is considered to be someone who will be happy to splash the cash if and when Boris commands. It’s the EUR which interests though, given the flows have ramped up with the single currency finding very few friends, as a carry continues to work well in this macro backdrop.
Bloomberg carry index
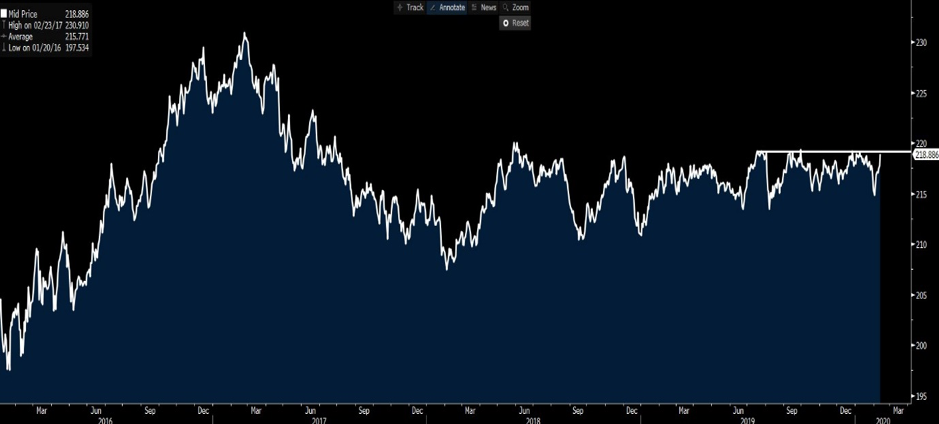
Source: Bloomberg
We’re seeing some strong trends in EURUSD, EURMXN, and EURCAD, with EURGBP also on the radar too with price pushing the December lows of 0.8275. For those with EUR exposures, the biggy comes in the shape of German and EU manufacturing next Thursday. If that comes in weak, and the market is already expecting a faster pace of contraction, then it will only add to the idea that the EUR is the weakest link. Given just how unloved the EUR is, if the data comes in even modestly above then we could see some covering of shorts, but unless price can close above the 5-day EMA I’d be leaning into this ST average to add.
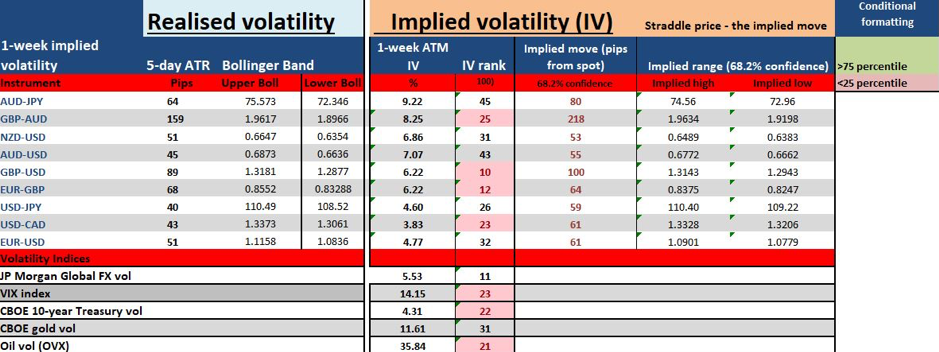
There are two videos I have put together that may be of interest. The first is the usual trader’s week ahead video (above), in which I focus on what’s worked in FX markets and how the markets are set up for the new week. I focus on the implied volatility in markets, that gives me an understanding of what the market is expecting from futures movement, which defines my risk profile and position sizing.
Weekly volatility matrix
In the second video below I focus more intently on the equity markets, after upbeat interest from clients to look at the DAX, Nasdaq and Dow. I’ve titled this “what can stop this equity juggernaut?”, and I hope this can give some insights into why we grind ever higher. If you’re trading indices this could be of interest.
The material provided here has not been prepared in accordance with legal requirements designed to promote the independence of investment research and as such is considered to be a marketing communication. Whilst it is not subject to any prohibition on dealing ahead of the dissemination of investment research we will not seek to take any advantage before providing it to our clients.
Pepperstone doesn’t represent that the material provided here is accurate, current or complete, and therefore shouldn’t be relied upon as such. The information, whether from a third party or not, isn’t to be considered as a recommendation; or an offer to buy or sell; or the solicitation of an offer to buy or sell any security, financial product or instrument; or to participate in any particular trading strategy. It does not take into account readers’ financial situation or investment objectives. We advise any readers of this content to seek their own advice. Without the approval of Pepperstone, reproduction or redistribution of this information isn’t permitted.