- Italiano
- English
- Español
- Français
- Italiano
- English
- Español
- Français
.jpg?height=93&quality=100)
Looking at the sea of red across global equity markets today, clearly shows risk sentiment has soured. Resurging cases of covid is making investors have flashbacks to previous lockdowns which could add to worries of economic growth slowdowns (Bank of America have downgraded their US growth forecasts from 7% to 6.5% for 2021). Add higher inflation into the mix and we have a toxic combination of stagflation. The VIX index a gauge of fear in the market is up almost 6 vols (33% increase) and most major bond markets have seen yields move dramatically lower – a sign of fleeing to safety.
DOW/US30:

The DOW sliced right through its 50-day SMA and is now right on its lower trend line of the ascending channel and horizontal support at 33.8k. A move below here would bring 33250 into play. The RSI has fallen below key support on previous price dips around 45. For price rallies my first target on the upside would be around the 50-day SMA and 21-day EMA around 34.4/5k, which is also the middle of the ascending channel.
DAX:
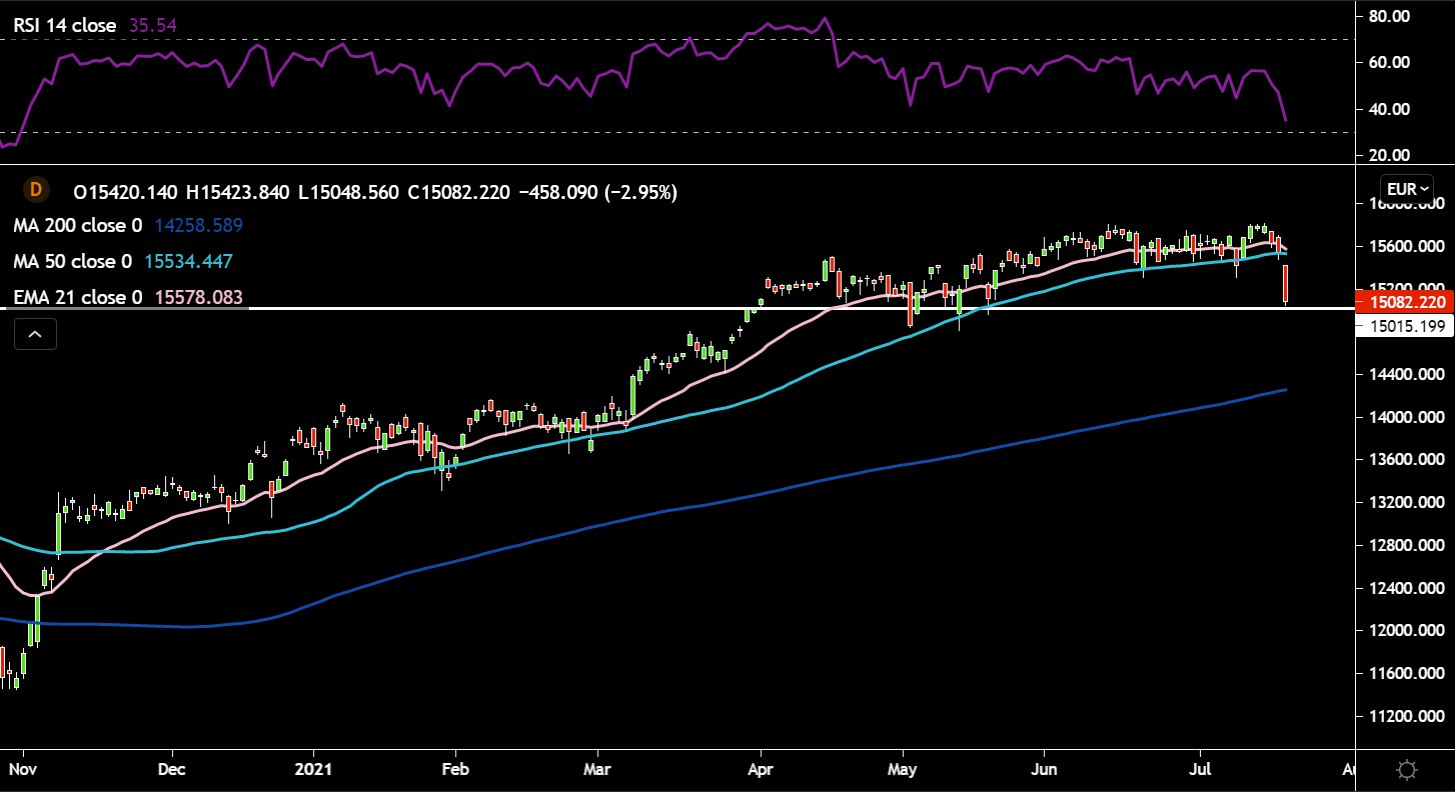
The DAX has fallen to a major price support level around 15k. The 21-day EMA looks like it wants to break lower through the 50-day SMA. The RSI is quickly approaching the oversold area, which may help stem deeper losses. The danger is below here the next major support is 1000 points lower around 14k. We could see a brief move below the horizontal support triggering some stops, but not falling much further like we saw in May. On the upside, 15500 would be an area of interest around the 50-day SMA and 21-day EMA.
Oil:
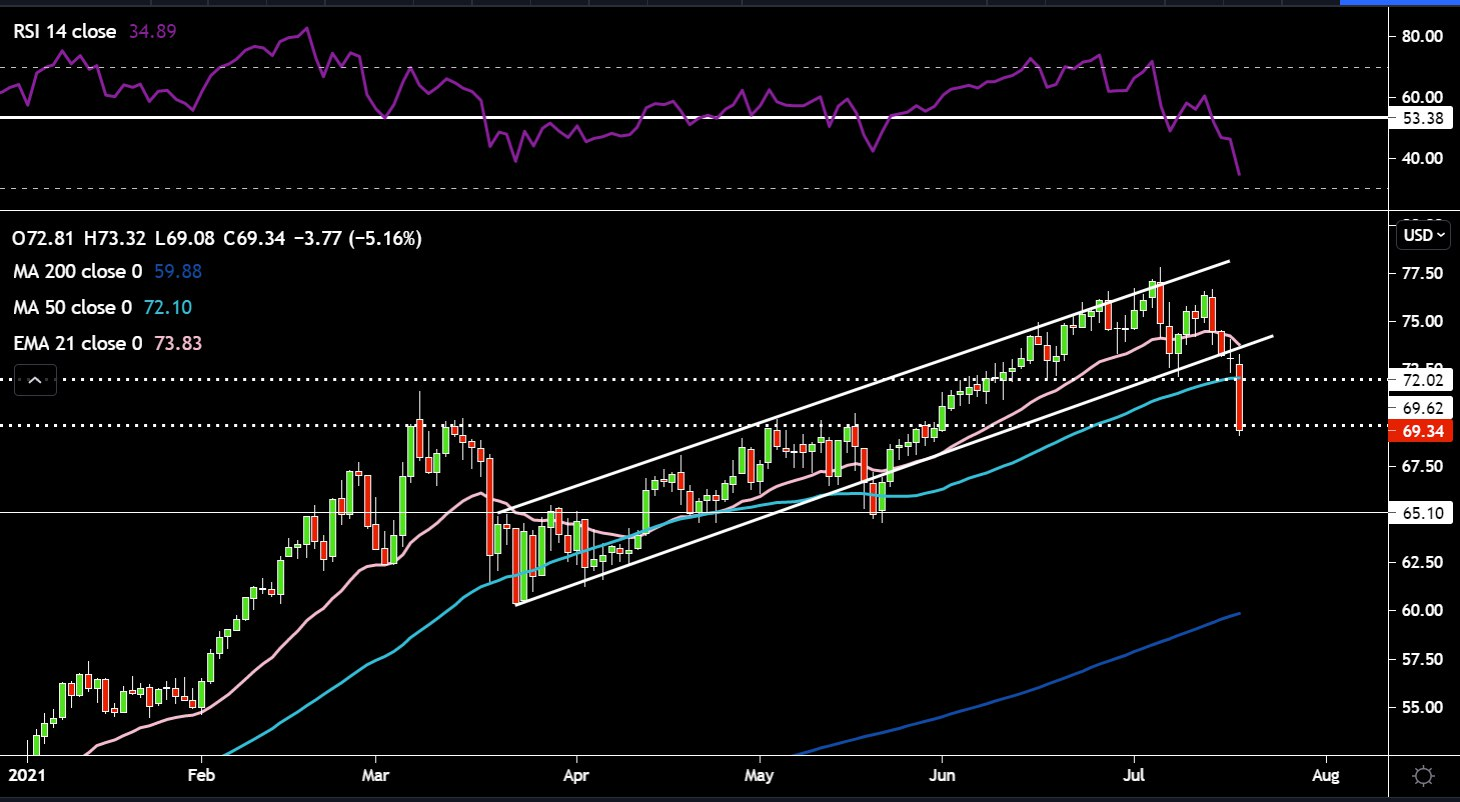
Oil has the double whammy of additional supply from the agreement sealed last night by OPEC+ as well as a stronger dollar and risk-off sentiment. There is severe technical damage on the charts as price broke through the ascending channel and sliced below the 50-day SMA. Price currently is sitting around the $70 mark. Below there, $65 becomes the next key support level. The RSI is near to oversold territory. On the upside $72 former support would be the first hurdle to be cleared for further gains.
Related articles
Iniziamo a fare trading?
Iniziare è facile e veloce. Con la nostra semplice procedura di apertura conto, bastano pochi minuti.
Pepperstone non dichiara che il materiale qui fornito sia accurato, attuale o completo e pertanto non dovrebbe essere considerato tale. Le informazioni, sia da terze parti o meno, non devono essere considerate come una raccomandazione, un'offerta di acquisto o vendita, la sollecitazione di un'offerta di acquisto o vendita di qualsiasi titolo, prodotto finanziario o strumento, o per partecipare a una particolare strategia di trading. Non tiene conto della situazione finanziaria o degli obiettivi di investimento dei lettori. Consigliamo a tutti i lettori di questo contenuto di cercare il proprio parere. Senza l'approvazione di Pepperstone, la riproduzione o la ridistribuzione di queste informazioni non è consentita.