- Italiano
- English
- Español
- Français
- Italiano
- English
- Español
- Français

The spreading virus threatens to knock economic activity in China, and it’s reasonable to expect Q1 GDP (released 17 April) will be considerably lower than previous forecasts. Disruption in China, the world’s second biggest economy and the largest oil importer, will have global consequences.
The disruption is unprecedented. The disease has already infected more than the official count during SARS, and never before have we seen such a large scale of cities in lockdown. Numerous countries including the USA, UK, and Australia are advising against travelling to China while airlines reduce or axe services.
To understand how forex and commodity markets are responding to the unknown, here are five charts you should be across: AUDJPY, Gold (XAUAUD), USDCNH, XTIUSD, CN50.
AUDJPY
A weakening Aussie dollar and strengthening safe haven JPY makes this forex pair an attractive instrument. It’s considered a proxy of global risk appetite.
The pair has had more pronounced moves than popular JPY crosses (such as USDJPY) in the last week, and gapped lower on Monday’s open, displaying its sensitivity to the newsflow around coronavirus.
Consumer spending and travel within China is slowing as people take precautionary measures and stay home, not to mention around 50 million people are effectively in quarantine in their own cities.
Services make up 54.1% of the Chinese economy, so reduced travel and spending as millions of people stay indoors will weigh on the Chinese economy. More so than it did in 2002 during the SARS outbreak, when services comprised just 42% of the economy.
Q1 GDP was forecast for 5.9% but we can expect this to print a whole percentage point lower.
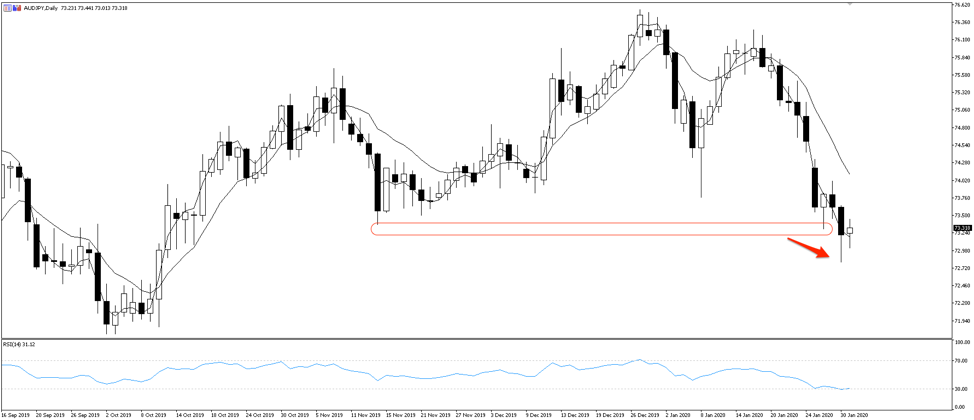
Trading around 73.350, AUDJPY tested this level in November and it now looks like a market that wants to move lower. The pair will be sensitive to newsflow and will need little encouragement to break support here.
Gold
Investors flee to gold when the mood is risk-off. This time though, I want you to consider gold in terms of the Australian dollar (XAUAUD) instead of the typical XAUUSD trade.
If you’re trading XAUUSD, you might be trading two instruments moving in the same direction. For the best result, you want to be trading instruments moving in opposite directions. And amid coronavirus risk, XAUAUD could be the golden trade.
AUD is closely tied to the Chinese yuan (CNH). If CNH moves lower, as it did markedly on early coronavirus fears, AUD will drop with it. In fact, we found a very strong relationship of a shared move when measuring AUD and CNH against the USD: a correlation coefficient of 0.912 over the last year. Digging deeper, we found a coefficient of determination of 0.832: that’s 83.2% of the variation in AUD as explained by CNH over the past twelve months.
When CNH moves, AUD has followed with a 91.2% correlation
If coronavirus cannot be contained and spreads further, investors will further unwind risk and move to gold. At the same time, the Chinese currency will come under more strain, hence pushing AUD lower against the precious metal.
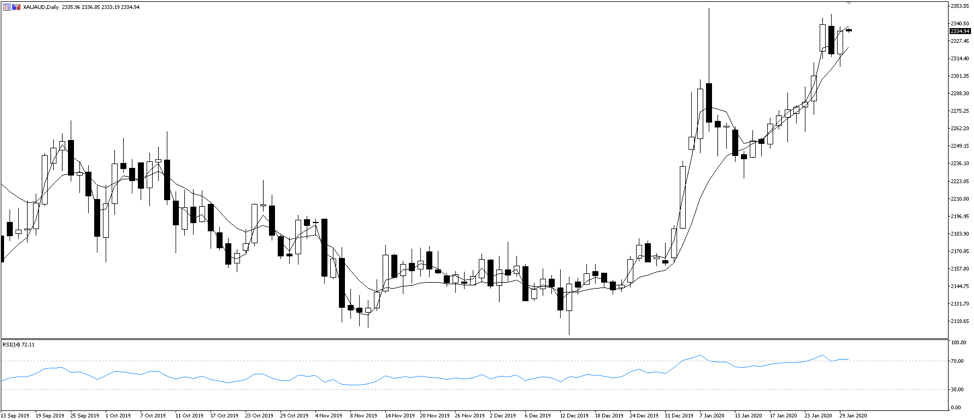
XAUAUD is trading at record highs, whereas XAUUSD has not hit record highs since 2012.
USDCNH
USDCNH has been trading neatly lower in a channel since its trade war highs in early September. The risk proxy forex cross was trading at the 6.85 level, a five month low, just two weeks ago, until the coronavirus outbreak weakened the Chinese yuan and pushed the pair higher.
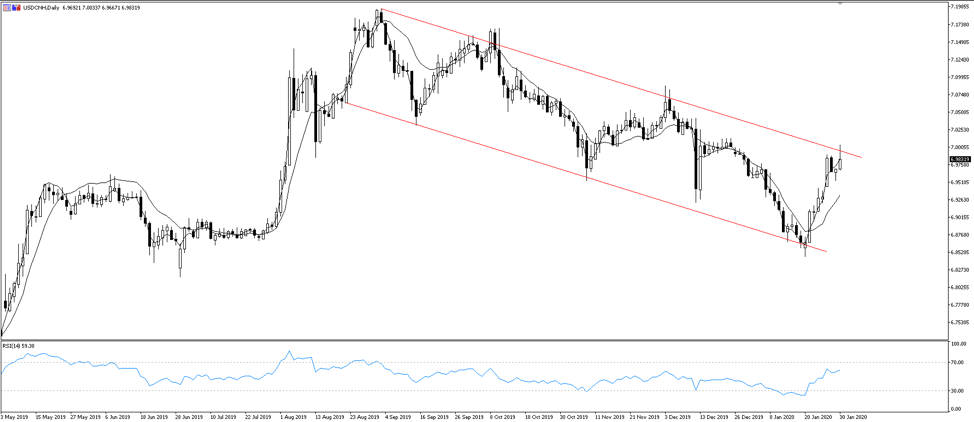
The yuan briefly tested the top of the channel overnight Thursday and weakened past the 7 level for the first time this year.
When the Chinese markets open again on Monday morning, we might see the People’s Bank of China pump a lot of liquidity into the markets to keep short-term borrowing costs down. In theory, this should weaken CNH further (USDCNH up), trading above 7 USD. But, if the liquidity injection is seen as a positive for growth, it could unexpectedly strengthen the currency (USDCNH down).
Newsflow on the virus will also continue to dictate how CNH moves. Improvement and the currency strengthens; failure to maintain the virus and it weakens.
WTI crude (XTIUSD)
China is the world’s largest importer of oil, and the coronavirus outbreak caused serious panic just as the Chinese New Year break was about to begin. As the virus spread, holidaymakers began to rethink some of their planned 3 billion trips during the celebrations. The affected regions were forbidden from making trips. Currently twelve cities are in lockdown. That’s 50 million people with limited movement.
Movement in and out of China has sharply tapered off. British Airways has suspended all flights to China, while United Airlines is operating on a significantly reducing schedule, citing a decline in demand.
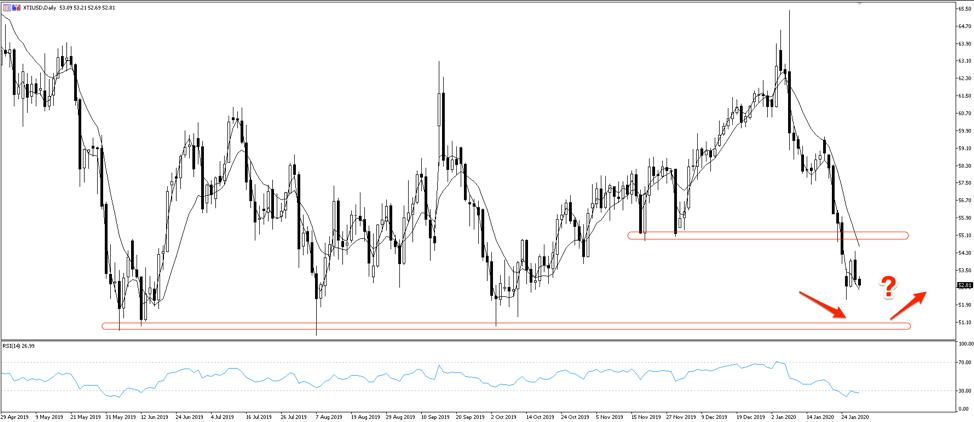
Reduced travel on such a scale is a considerable blow to oil demand. Last week’s 7.4% price drop saw oil close through long-term resistance at 55.00. It’s rebounded since this week’s 52.18 low, but don’t think the calm means the storm is over. The outlook depends on how long people withhold travel, especially if the virus spills out of China where it remains mostly concentrated.
WTI is trading 13% lower today (30 January) than at the beginning of the year. OPEC and its allies are reportedly considering deeper supply cuts if prices continue to push lower. Oil traders should therefore be looking at the next long-term resistance level 50.70, a strong buy zone over the last twelve months.
CN50
Even though the Chinese stock market is restricted to mainland residents, you can access 50 of China’s largest companies through the FTSE A50 (CN50), an index hosted on the Hong Kong stock exchange. CN50 futures are trading while the Chinese stock market is closed for the new year break.
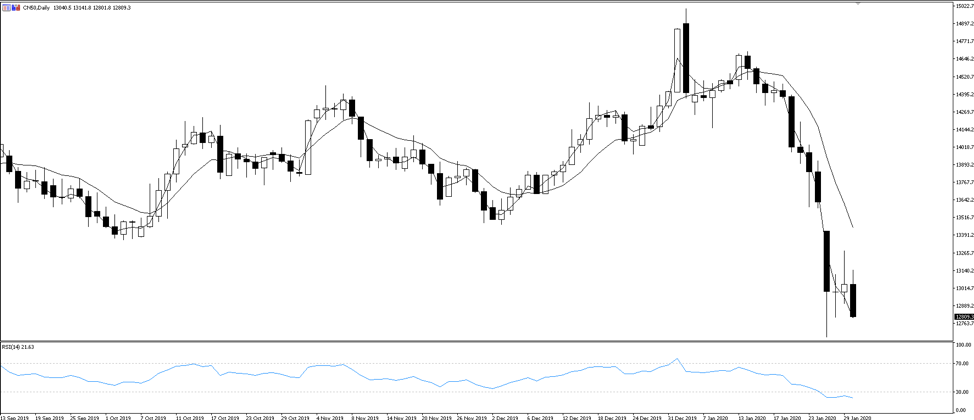
CN50 futures are down 1.7% today as more and more questions are asked and raised about the potential economic fallout, and Q1 GDP figures are revised down. The panic is reflecting in the news-sensitive stock markets.
We won’t see January consumer data for several weeks, so the exact fallout will be unknown for some time. The Hang Seng Index (HK50) came back online yesterday after the holiday break and opened almost 800 points lower, reflecting the newsflow.
Iniziamo a fare trading?
Iniziare è facile e veloce. Con la nostra semplice procedura di apertura conto, bastano pochi minuti.
Pepperstone non dichiara che il materiale qui fornito sia accurato, attuale o completo e pertanto non dovrebbe essere considerato tale. Le informazioni, sia da terze parti o meno, non devono essere considerate come una raccomandazione, un'offerta di acquisto o vendita, la sollecitazione di un'offerta di acquisto o vendita di qualsiasi titolo, prodotto finanziario o strumento, o per partecipare a una particolare strategia di trading. Non tiene conto della situazione finanziaria o degli obiettivi di investimento dei lettori. Consigliamo a tutti i lettori di questo contenuto di cercare il proprio parere. Senza l'approvazione di Pepperstone, la riproduzione o la ridistribuzione di queste informazioni non è consentita.