- Italiano
- English
- Español
- Français
Trader thoughts - broad de-risking offering the bears a gift

Traders have shunned risk and bought volatility and the broad market flow has been centred towards USD longs. USDCNH has been a close focus, and the cross-rate pushes above 6.8600 and the highest level since Sept 2020 – let’s see how Asia trades this today, but it wouldn’t surprise to see modest downside before another push higher.
EURUSD has been the crowd favourite and there have been few reasons to be long EUR, other than intraday pockets of mean reversion – while the EUR will become ever more sensitive to anything that remotely resembles ‘good' news, the investment case for EU assets is incredibly underwhelming – EU Nat Gas and electricity prices pushing up 13% a piece has all the talk yesterday as the bull run continues and even though water levels in the Rhine have risen, thanks to Mother Nature. Selling rallies seem to be the trade du jour in EURUSD, and I’d be watching for the reaction and behaviour into 0.9952 through Asia, as desks look to tweak a progressively short EUR position.
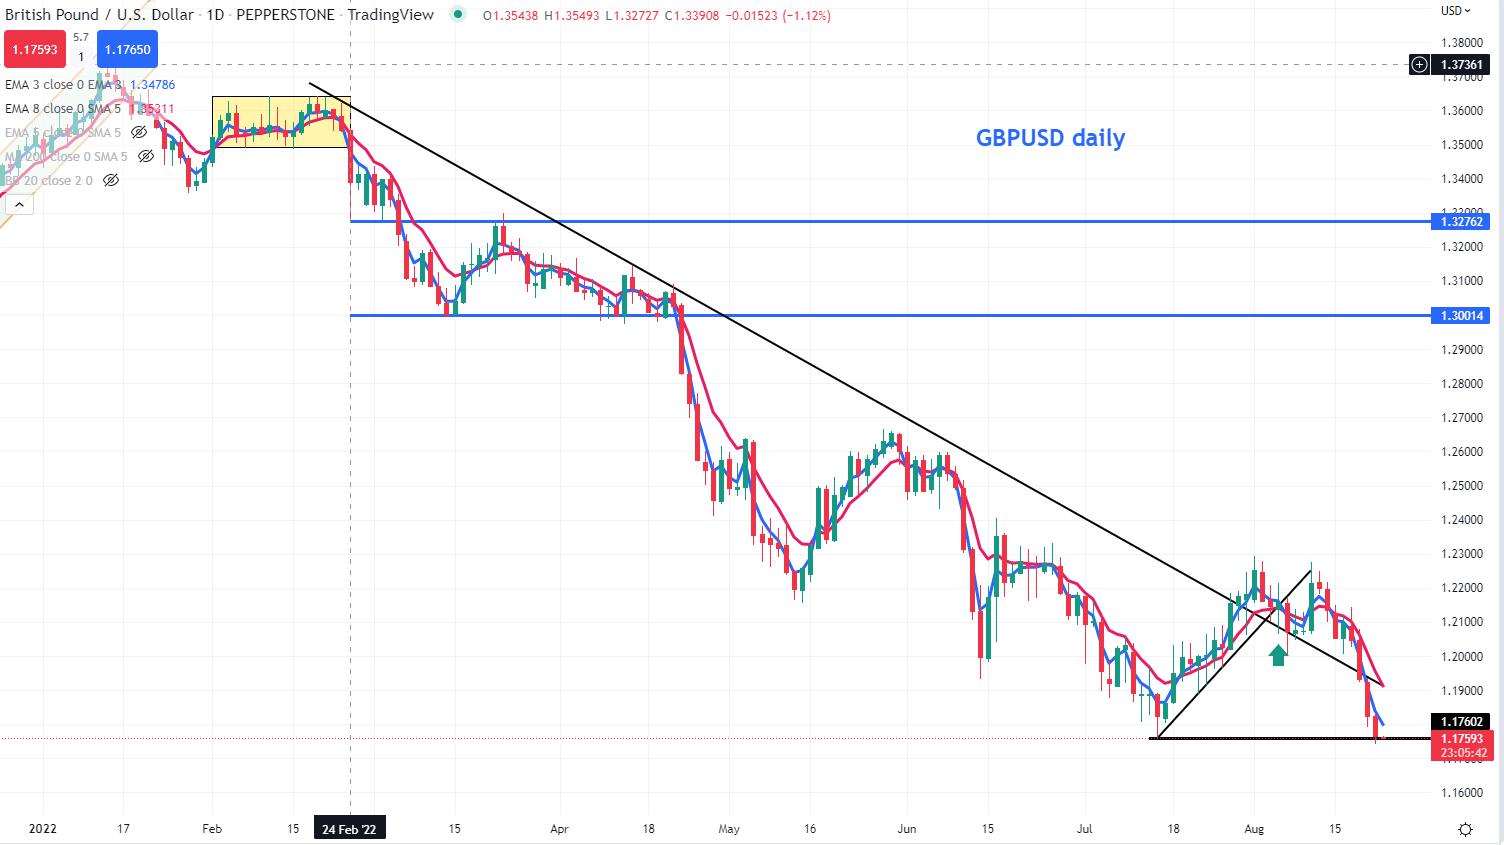
GBPUSD is sitting bang on the July swing low, and it feels very heavy indeed – retail traders cry ‘oversold’ and clients are now skewed as long in GBPUSD as I’ve seen for a while – granted, client skew is a melting pot of differing views and behaviours – some holding for seconds, others for weeks, but 75% of open held long is a decent skew. Forecasts of UK CPI hitting 18% in 2023 are a GBP negative, as this is where we see the negative feedback loop to growth and the breakdown of the social fabric.
EU energy markets aside, the moves higher in US Treasury yields has traders de-risking into Jackson Hole – the USD is the default hedge against equity drawdown, although we’ve seen some buyers of the US volatility index which has pushed above 25%. US and EU equity markets push further lower, and a mix of summer volumes (poor liquidity), a general lack of buyers and increased short positioning have seen 2% moves across the board, with the NAS100 the weakest link. The rise in US Treasury yields are fuelling a fire. Eyeing the US500, we see price at the lower limits of the regression channel (2 std deviations), so if the move higher since 16 June is to hold then it needs to bounce today, or the trend is over, and we will see far more balanced two-way opportunity- it feels like traders are already sensing this anyhow.
Daily chart of SpotCrude
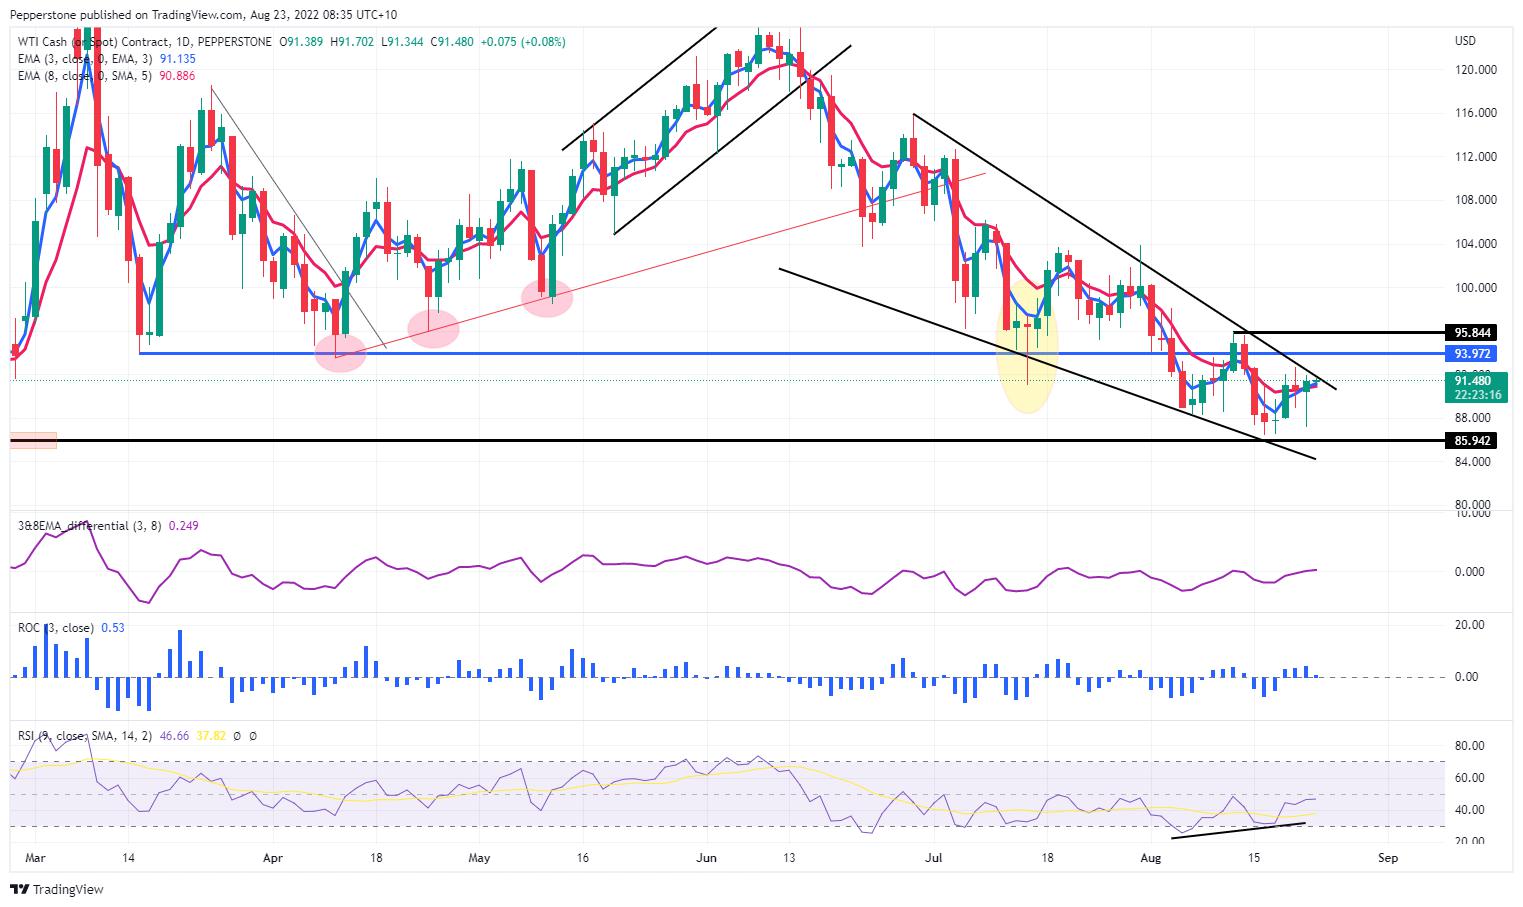
In commodities, we see decent vol in SpotCrude, with price being supported into $87.15 on comments from the Saudis of looking to tighten output as poor liquidity and high volatility result in disconnections between crude futures and fundamentals. I see the daily chart working in a bullish wedge and the bullish divergence seems to be playing out to the topside. Crude bulls really need a break of $92.69 to get this moving in that direction.
Gold has struggled again, and benefited the shorts – a stronger USD has naturally impacted but US real rates continue to push higher – XAUEUR is holding in fairly well, obviously a function of EUR weakness, but it again highlights that while most just keep it simple and trade gold in USD terms (XAUUSD), we can max out the P&L effect by buying gold in the perceived weakest currency, and short in the strongest. Staying in the precious metal scene, palladium is the weakest link here, trading over 5% lower on the day and eyeing a downside break of support at 1992.
Looking ahead – more of the same. Watching EU energy market, US bond yields and hedging/de-risking flows. Manufacturing and service PMIs from Aus, UK, EU and US may get some focus but are unlikely to cause any lasting gyrations.
Related articles


Pepperstone non dichiara che il materiale qui fornito sia accurato, attuale o completo e pertanto non dovrebbe essere considerato tale. Le informazioni, sia da terze parti o meno, non devono essere considerate come una raccomandazione, un'offerta di acquisto o vendita, la sollecitazione di un'offerta di acquisto o vendita di qualsiasi titolo, prodotto finanziario o strumento, o per partecipare a una particolare strategia di trading. Non tiene conto della situazione finanziaria o degli obiettivi di investimento dei lettori. Consigliamo a tutti i lettori di questo contenuto di cercare il proprio parere. Senza l'approvazione di Pepperstone, la riproduzione o la ridistribuzione di queste informazioni non è consentita.