- Italiano
- English
- Español
- Français
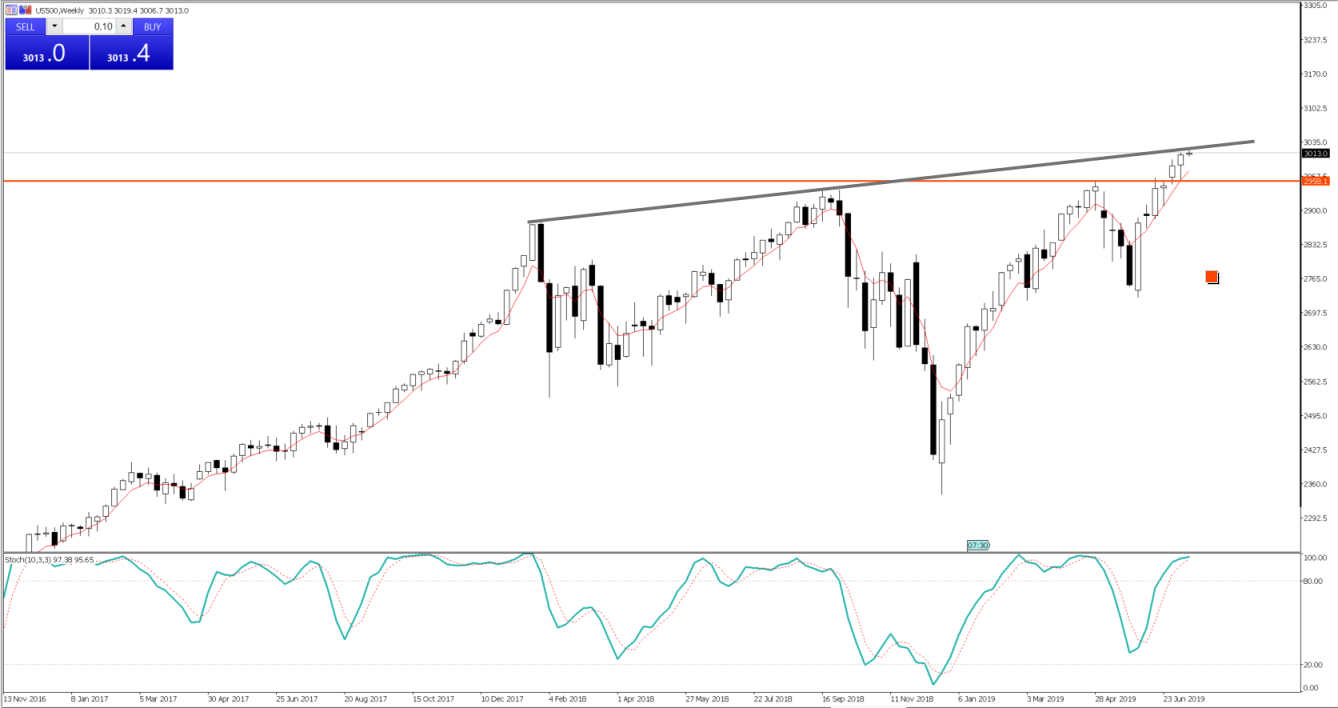 One chart I always keep an eye on is the spread between high-yield credit
and US treasuries (white line). This is a great indicator of sentiment and
accepted risk, as the narrower the spread, the greater demand for high-yield
bonds over the risk-free rate (US government bonds). There’s an old saying
that equities always follow credit, and that’s unlikely to the change anytime
soon. However, at this juncture, while credit spreads aren’t giving any
glaring sell signal for equity, there’s a growing divergence suggesting the
rally in the S&P 500 may be maturing.
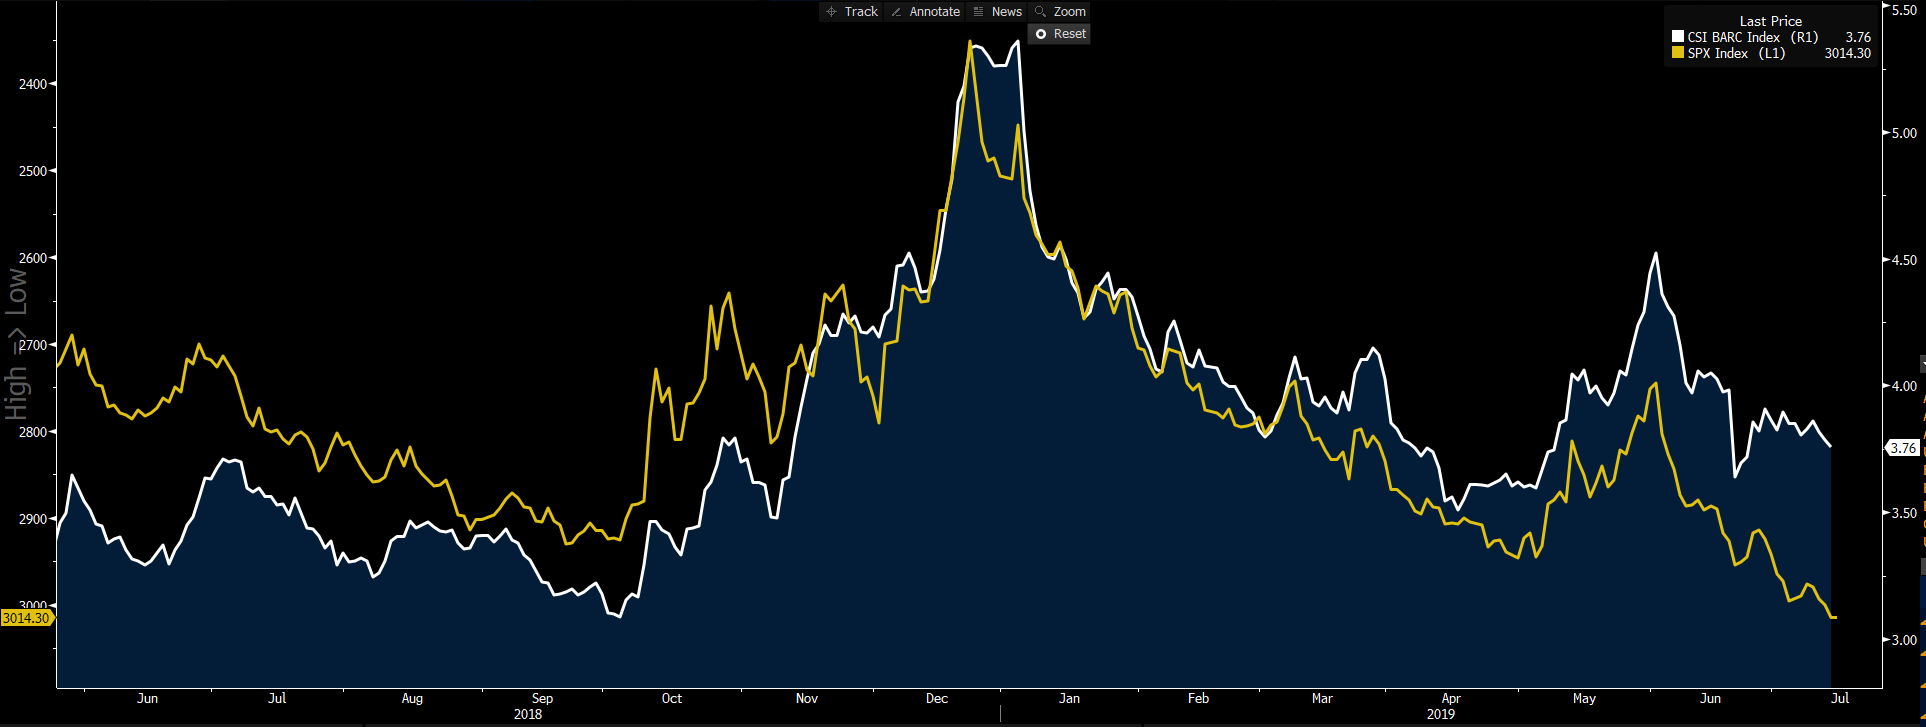 "Source: Bloomberg"
US retail sales the central event risk
As we roll into US trade, we also have to focus on US retail sales (due 22:30 AEST) and industrial production (23:15 AEST). The retail sales print is a potential volatility event, and, as always, we look to see the outcome relative to expectations of 0.2% MoM. Economists often look at the retail “control group” element, which is the group of goods used directly into the GDP calculation. This number is expected to grow at 0.3% should we see the USD become more sensitive to this, as a beat may see slight revisions to the Q2 GDP estimate, where the market currently believes Q2 GDP is closer to 1.8% and down from the 3.1% pace of growth seen in Q1.
It should also affect the rates market, which is now pricing a 25% chance of a 50bp cut in the July FOMC meeting. This pricing feels fair as the Federal Reserve should cut, but the recent data argues for 25bp. The argument is, though, if the Fed cuts by 50bp, then they can try and run their economy red hot as they try and get in front of the curve.
Are we pricing in too much easing from the Fed?
If I look at market pricing for end-2019, we see 64bp of cuts (from the Fed) priced in, which effectively dwarfs the expected easing seen from other central banks. Granted, we’ve already seen a response from the Reserve Bank of Australia and Reserve Bank of New Zealand, and the Fed is yet to start its easing cycle. But given what we’ve seen of late from the US data, I question if 64bp (central banks tend to work in 25bp increments) looks a punchy call.
The USD index daily needs work
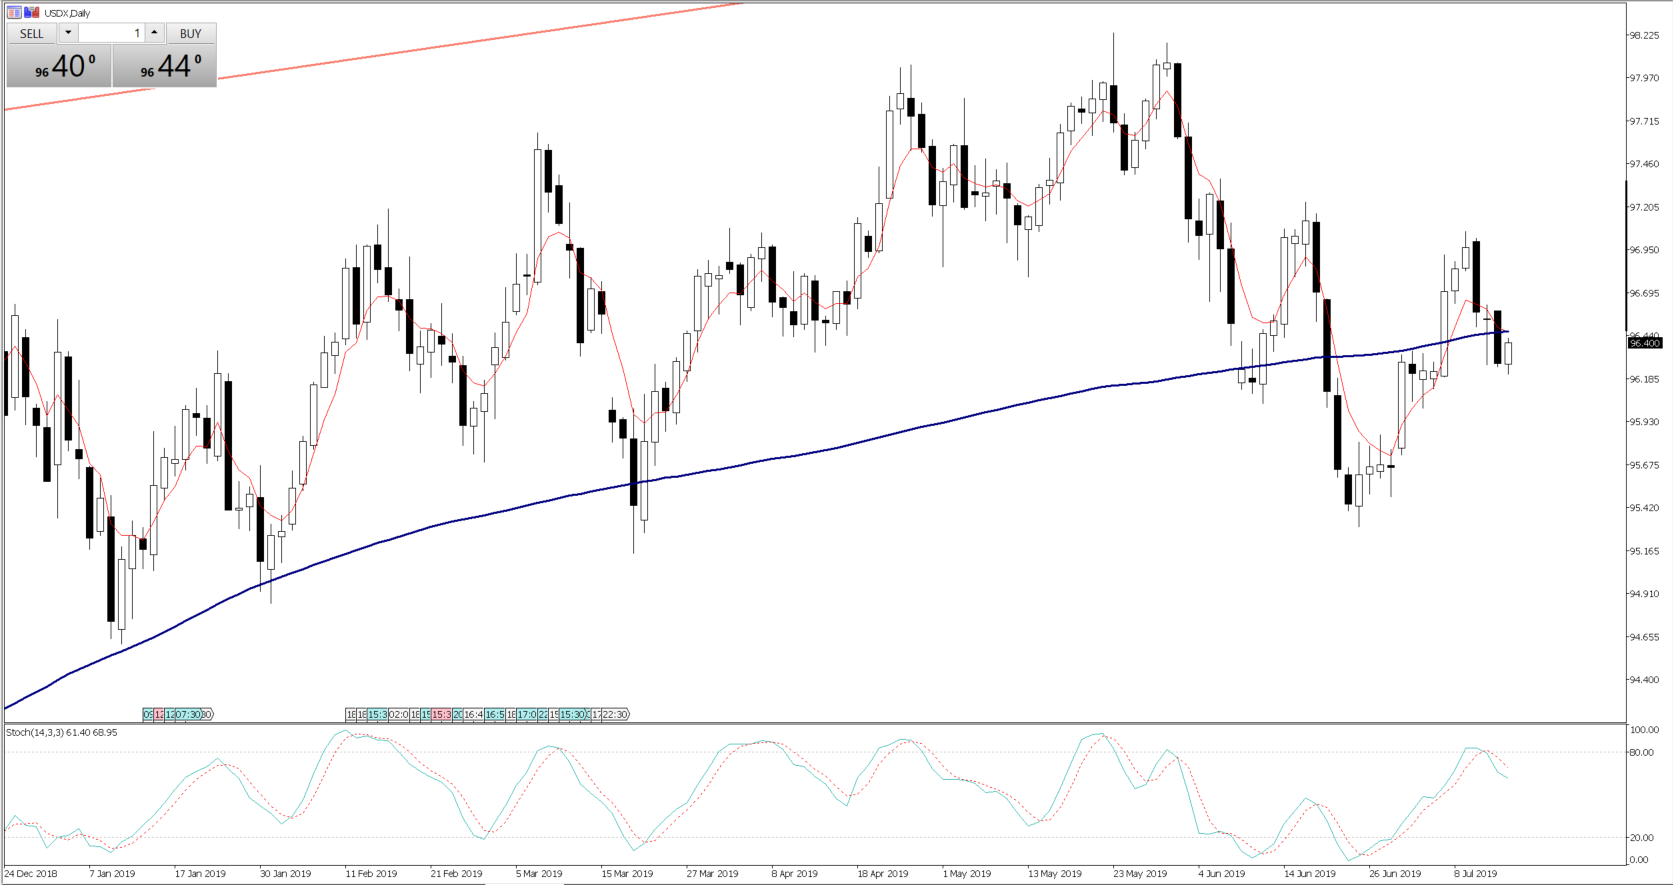 The EUR offers a 57% weighting on the USDX, which is a basket of currencies
weighted against the USD. So, if we refocus away from the EUR and drill down
into the moves over the past five days across G10 FX, we can see that the NZD
and AUD are performing quite admirably versus the USD.
 "Source: Bloomberg"
China data has boosted sentiment
Yesterday’s China economic data has helped sentiment, with a sizable beat in the June industrial production, retail sales and fixed-asset investment prints. The Q2 GDP print came in at 6.2%, which was in line with expectations. Liquidity has also been in play, with the People’s Bank of China conducting CNY200b in one-year loans at 3.3%. Chinese equities saw modest love to the numbers, and are down a touch today. But in FX markets, the setups in NZD and AUD look interesting.
AUDUSD grinding higher
AUDUSD tends to get the lion’s share of attention in the AUD pairings. This won’t surprise, and there seems to be growing interest here again. The daily chart needs more work before we can truly turn bullish, and, anyhow, being bullish this pair never feels right, largely as the cost of carry means hedge funds are unwilling to be long. That said, with 24bp of cuts priced for the rest of 2019, it's hard to see rates pricing in any more than this. We may have to wait until November and the Melbourne Cup before the next move from the RBA.
Indeed, today's RBA minutes (from the July meeting), which have detailed they’ll cut rates further if needed, go some way to justifying this pricing structure.
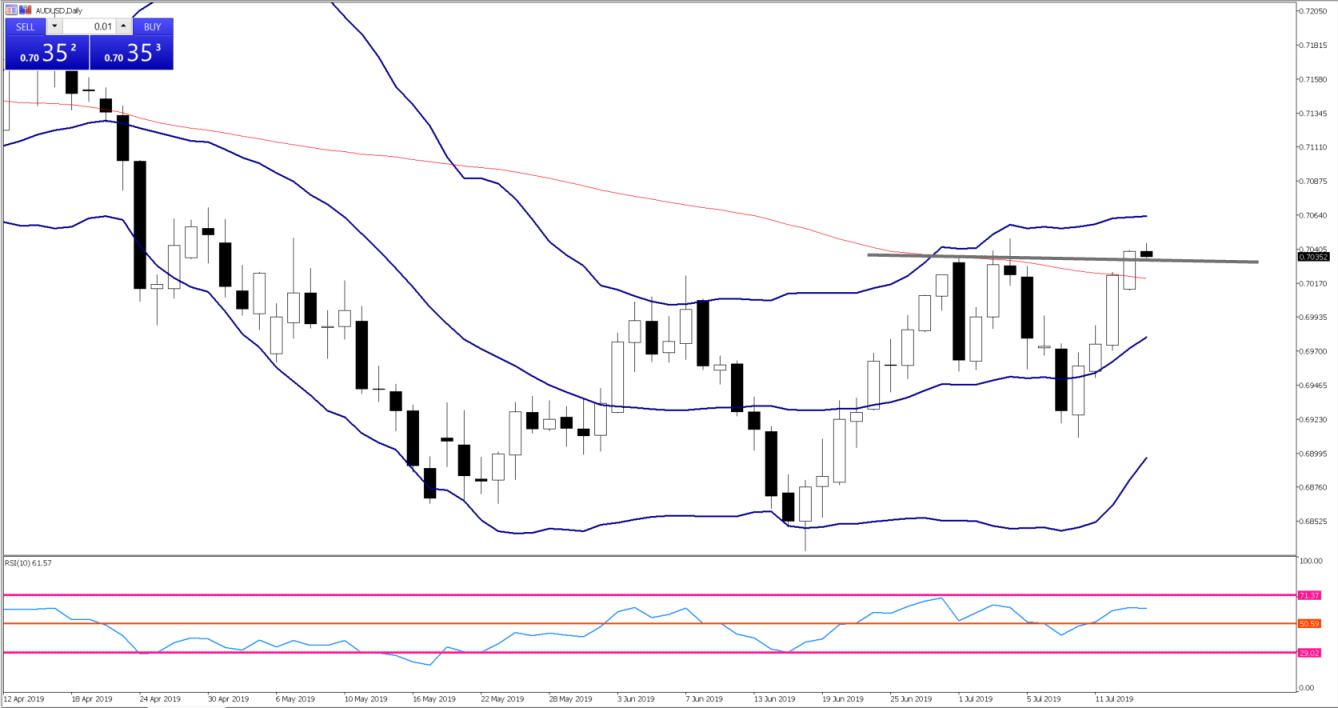
Price is grinding higher and sits at the top of the multi-month range. A clean break of 0.7050 offers a potential move into the 0.7100-to-0.7150 area. However, with AUDUSD weekly implied volatility just so low, impulsive moves just aren’t expected. This has strong considerations for risk and position sizing.
We can see that the market sees, with a 90% confidence level, that price shouldn’t get any higher than 0.7130 over the coming five days. We can also see options traders anticipate any downside move confined to 0.6957, with a 90% confidence level. That implied volatility read takes into account Thursday’s Aussie jobs report, where the consensus expects to see 9,000 net jobs created, with the unemployment rate remaining at 5.2%. Good numbers here, and the market will pare back rate cut expectations and cover AUD shorts.
NZDUSD also working well
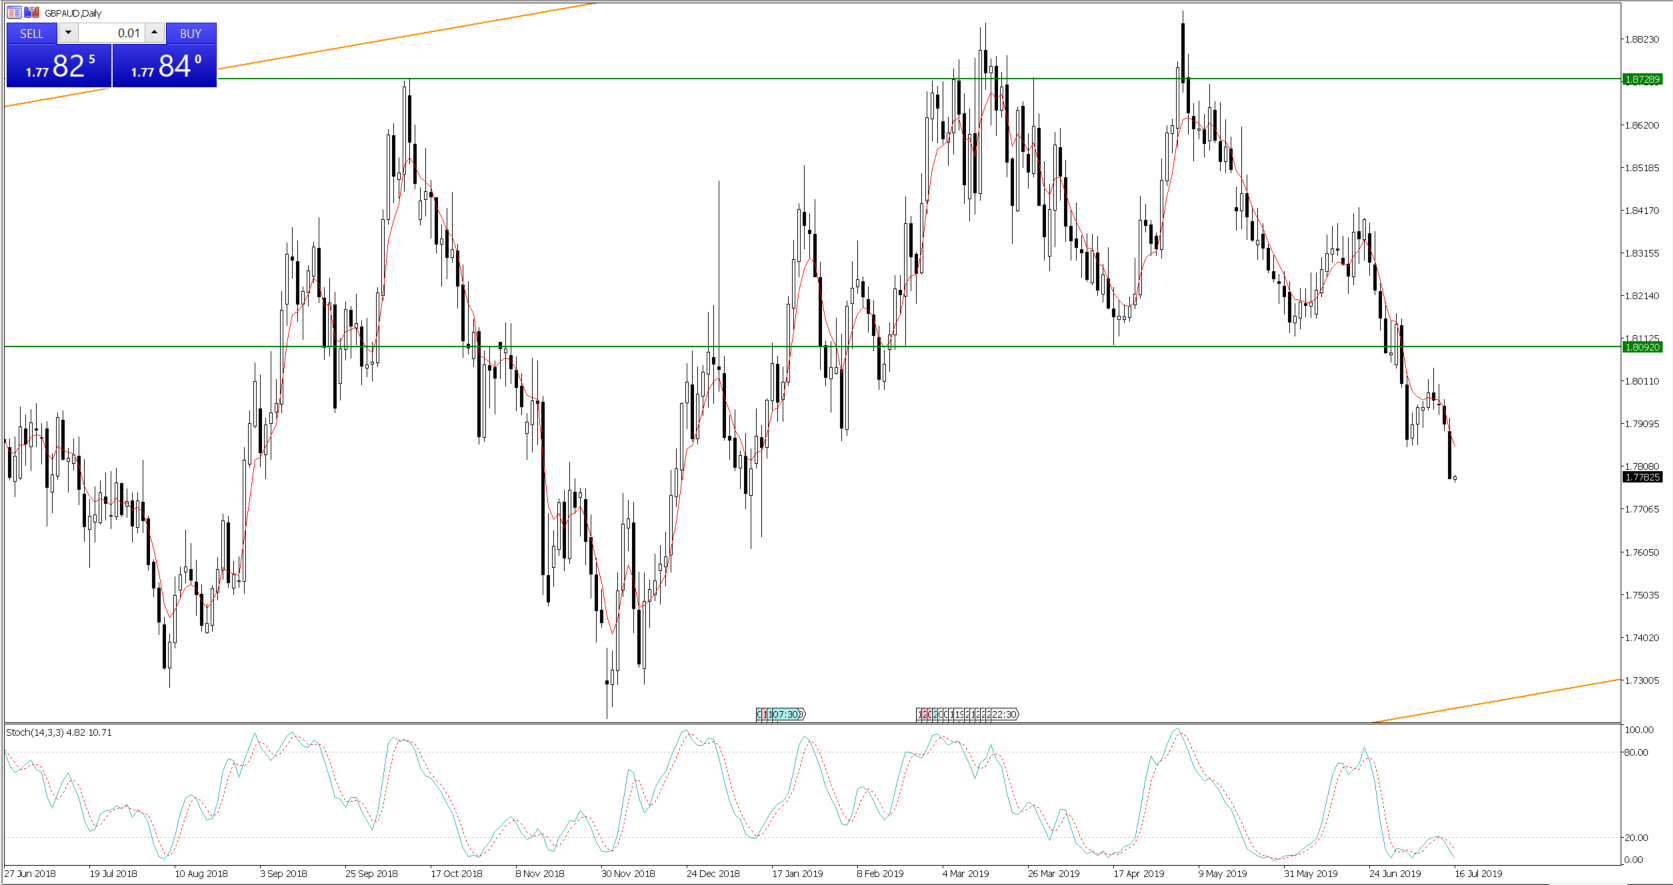
NZDUSD is threatening to convincingly break through the June highs, and traders are questioning if they chase the move should we see a firm breakout. Flip the chart to EURNZD or GBPNZD (or EURAUD/GBPAUD), though, and this is where we’re seeing the big moves, as order book dynamics take hold, with the buyers staying clear and the sellers having an easy time of pushing price lower.
Pepperstone non dichiara che il materiale qui fornito sia accurato, attuale o completo e pertanto non dovrebbe essere considerato tale. Le informazioni, sia da terze parti o meno, non devono essere considerate come una raccomandazione, un'offerta di acquisto o vendita, la sollecitazione di un'offerta di acquisto o vendita di qualsiasi titolo, prodotto finanziario o strumento, o per partecipare a una particolare strategia di trading. Non tiene conto della situazione finanziaria o degli obiettivi di investimento dei lettori. Consigliamo a tutti i lettori di questo contenuto di cercare il proprio parere. Senza l'approvazione di Pepperstone, la riproduzione o la ridistribuzione di queste informazioni non è consentita.
