Vix Volatility Index
Volatility dictates broad market conditions, it is the heart of the market environment in which we, as traders, operate, and is as important whether utilising a discretionary or algorithmic strategy. One of the best-known measures of implied volatility is the Cboe volatility index, or the VIX Index, which we're now offering to clients.
What exactly is the ‘VIX index’?
The VIX index is essentially a measure of the expected movement in the S&P 500 and like any options implied volatility, the VIX index is quoted as an annualised standard deviation percentage. Where the level of the VIX index is derived from the pricing of S&P 500 options with expiry’s ranging between 23 and 37 days, and then weighted to create a rolling 30-day implied volatility.
To complicate matters somewhat, while the various S&P 500 options expiry equates to a rolling 30-day expiry, the quote you see is actually an expression of the expected percentage movement, higher or lower, in the S&P 500, from the current underlying price over the coming 12 months (or annualised). What’s more, we know the market holds a 68.2% level of confidence that price will not exceed that degree of movement.
In layman’s terms, if the VIX index is trading at 20 (%), the market is effectively pricing a 20% move higher or lower over the coming 12 months.
Traders can then take that annualised number and perform some basic calculations to understand the expected move in the underlying index (in this case the S&P 500) over a defined period, such as a day or a week. This is the great thing about the options market – it is based on math and offers quantifiable insights as to the anticipated move and the degree of confidence, through any period that options are written.
Translating annualised to daily moves
Options traders understand that volatility is equal to the square root of time (SQOT). So, if we want to know the daily expected move, we first need to understand the number of trading days in a year and calculate the square root of that number. If we want a weekly move, we compute the square root of the number of trading weeks in a year and so on.
Calculate the implied daily move in the S&P 500 from the VIX index
- VIX index = 20% (annualised move in the S&P 500)
- Square root of time = 15.9 (SQRT/252)
- Daily move = 1.25% (20/15.9 = 1.25).
To get the weekly implied move, we divide 20 by 7.07 (7.07 being the – i.e. there are 50 trading weeks in a year). The implied weekly move in the S&P 500 is 2.8%.
So, if the S&P 500 is trading at 3300 and the VIX index commands a 20 (annualised) volatility, the daily implied move would be 1.25%. Subsequently, we then know the market is expecting a 41.3 point move lower or higher (3300/1.25%), giving the index an implied 82.6-point range (with a 68.2% level of confidence or one standard deviation).
The market can often be incorrect in their assumptions of expected movement, which is the essence of why traders buy and sell volatility. However, being able to quantify how the market (and market makers) feel about moves in price, can be incredibly powerful. Even for those not trading S&P 500 options per se and perhaps trading the underlying S&P 500, or another US equity index (such as the US30 or NAS100), or even another asset class altogether.
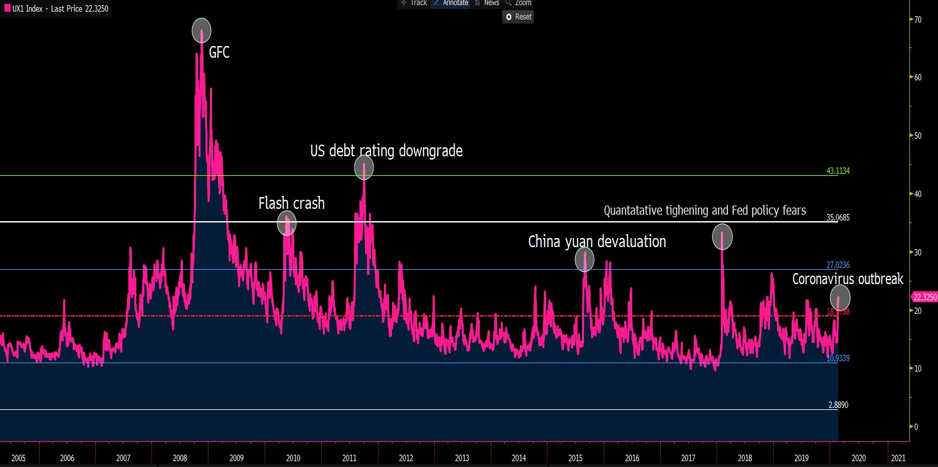
Remember volatility is directionally agnostic and does not predict future direction and the VIX index can rise if the S&P 500 is appreciating or declining at a rapid pace. That said, as the many case studies in market panic show, we generally see the VIX index spike higher in periods of uncertainty and S&P 500 index drawdown, which is why many call the VIX index the ‘fear index’.
Using the VIX effectively as a tool for trading
- Trade the VIX index directly – when you understand what the VIX represents and can calculate the expected movement in the underlying S&P 500, you can take a view whether that level of volatility is too high or perhaps not high enough. If you buy the index you are speculating that there will be even greater movement in the S&P 500, with traders paying higher prices for options on the index. If you sell the VIX index, you are making a play that volatility will subside, and calmer conditions are due.
- Using the VIX to manage risk - If we can understand the expected move in the S&P 500, then we can use this to guide our stop loss and achieve correct position sizing. For example, if I trade using daily charts and tend to hold positions for periods of between a day to two weeks - if the VIX index implies a daily move of 1.25%, then I run a high risk of being stopped out if I leave a stop loss 0.3% from the market. In this case, running a wider stop loss and subsequently reducing my position size would be prudent.
- How the VIX affects the trading strategy – in periods of lower volatility we often see traders looking to be paid to be in positions, with ‘carry’ (current income) working effectively. In FX, a low VIX index tends to see higher-yielding currencies, such as the MXN outperform, while higher-yielding equities will find buyers. In higher vol periods, we see carry trades unwound quickly and the funding currencies – the JPY, the CHF and even the EUR - outperforming. In higher vol periods, we see traders rush to quality and defensive assets such as US Treasury’s, gold and to companies with predictable earnings, such as staples or utilities. While we see better-shorting opportunities more broadly in growth and cyclical equities.
- Get an edge for your EA (expert advisor) - Understand the market environment – If your EA holds its edge in periods of low vol, sideways trending markets, then a high VIX index could mean your EA may perform poorly – so you may lower the position size, or even turn it off temporarily. Conversely, if your EA thrives in periods of higher vol, then you can have increased confidence and a positive expectancy. By using the VIX as a guide to assess expected market conditions it can give you real confidence in the environment in which your EA operates in.
Understand the VIX index
While news agencies will often quote changes in the VIX (cash) index, traders cannot actually trade or get direct exposure to this index, as it is an aggregation of multiple S&P 500 options prices. Pepperstone, therefore, offers the rolling front-month VIX futures, which are liquid, efficient and heavy traded, and adjust this price by a fair value weighting to create a tradeable cash index for clients. Client positions are hedged in the underlying VIX futures market.
Frequently Asked Questions
Pepperstone doesn’t represent that the material provided here is accurate, current or complete, and therefore shouldn’t be relied upon as such. The information provided here, whether from a third party or not, isn’t to be considered as a recommendation; or an offer to buy or sell; or the solicitation of an offer to buy or sell any security, financial product or instrument; or to participate in any particular trading strategy. We advise any readers of this content to seek their own advice. Without the approval of Pepperstone, reproduction or redistribution of this information isn’t permitted.