- English
- 简体中文
- 繁体中文
- ไทย
- Tiếng Việt
- Español
- Português
- لغة عربية
- Монгол хэл
Understanding the UK 100 (FTSE 100)
UK 100
The UK 100 – also known as the FTSE 100, FTSE, Footsie, or more formally the Financial Times Stock Exchange 100 Index – is a market-cap weighted that tracks the share prices of the largest companies listed on the London Stock Exchange (LSE). Launched in the mid-1980s, it replaced the FT30 as the primary benchmark for UK company performance.
While the FTSE 100 includes the LSE's largest listed firms by market cap, these are primarily internationally-focused companies generating most of their revenue overseas. Hence, the UK 100 has developed a reputation for being a poor barometer of how the UK economy may be performing, while having also gained a close inverse correlation with the value of the GBP, since overseas revenues repatriated to GBP increase in value as the currency declines.
Stock market trading for the cash index occurs between 8:00 AM and 4:30 PM London time on all UK working days, with the close of trade followed by an auction, after which, at 4:35pm, the index’s closing value is published. Out of cash hours, the index trades via futures contracts, as well as (Contracts for Difference) CFDs derived from the aforementioned contract.
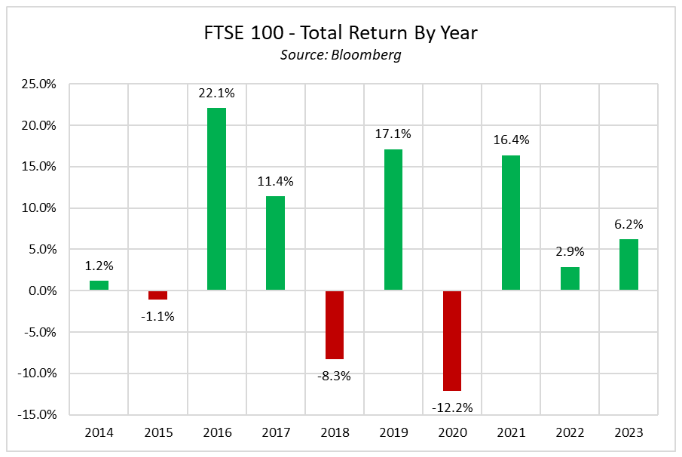
Stock indices like the FTSE 100 offer valuable insights into market movements. As the below shows, the UK 100 has significantly underperformed global peers of late, with the index’s value-heavy nature causing it to largely miss out on the AI- and tech-driven rally that has driven global equities substantially higher in recent years. As always, past performance is no reliable indicator of future results.
At the time of writing, the weightings of individual UK 100 constituents are as follows:
Stock | Weighting as of 01/10/2024 |
ASTRAZENECA PLC | 8.86% |
BP PLC | 3.71% |
GSK PLC | 2.89% |
RIO TINTO PLC | 2.57% |
GLENCORE PLC | 2.50% |
LONDON STOCK EXCHANGE GROUP PLC | 2.25% |
LLOYDS BANKING GROUP PLC | 2% |
BARCLAYS PLC | 2.00% |
EXPERIAN PLC | 1.61% |
RECKITT BENCKISER GROUP PLC | 1.41% |
ANGLO AMERICAN PLC | 1.40% |
3I GROUP PLC | 1.39% |
ASHTEAD GROUP PLC | 1.17% |
TESCO PLC | 1.12% |
SSE PLC | 0.98% |
IMPERIAL BRANDS PLC | 0.89% |
STANDARD CHARTERED PLC | 0.78% |
LEGAL & GENERAL PLC | 0.66% |
AVIVA PLC | 0.65% |
INTERCONTINENTAL HOTELS GROUP PLC | 0.61% |
SAGE GROUP PLC | 0.52% |
BT GROUP PLC | 0.42% |
INTERTEK GROUP PLC | 0.39% |
ADMIRAL GROUP PLC | 0.38% |
AUTO TRADER GROUP PLC | 0.34% |
CENTRICA PLC | 0.34% |
SEVERN TRENT PLC | 0.33% |
MARKS & SPENCER GROUP PLC | 0.32% |
DS SMITH PLC | 0.30% |
INTERMEDIATE CAPITAL GROUP PLC | 0.28% |
WHITBREAD PLC | 0.26% |
THE BERKELEY GROUP HOLDINGS PLC | 0.25% |
KINGFISHER PLC | 0.25% |
PERSIMMON PLC | 0.24% |
J SAINSBURY PLC | 0.24% |
IMI PLC | 0.23% |
M&G PLC | 0.22% |
HARGREAVES LANSDOWN PLC | 0.20% |
UNITE GROUP PLC | 0.18% |
ENTAIN PLC | 0.17% |
SCHRODERS PLC | 0.16% |
DARKTRACE PLC | 0.12% |
FRESNILLO PLC | 0.05% |
FRASERS GROUP PLC | 0.04% |
ASTRAZENECA PLC | 8.86% |
BP PLC | 3.71% |
GSK PLC | 2.89% |
RIO TINTO PLC | 2.57% |
GLENCORE PLC | 2.50% |
LONDON STOCK EXCHANGE GROUP PLC | 2.25% |
LLOYDS BANKING GROUP PLC | 1.80% |
BARCLAYS PLC | 2% |
EXPERIAN PLC | 1.61% |
RECKITT BENCKISER GROUP PLC | 1.41% |
ANGLO AMERICAN PLC | 1.40% |
3I GROUP PLC | 1.39% |
The material provided here has not been prepared in accordance with legal requirements designed to promote the independence of investment research and as such is considered to be a marketing communication. Whilst it is not subject to any prohibition on dealing ahead of the dissemination of investment research we will not seek to take any advantage before providing it to our clients.
Pepperstone doesn’t represent that the material provided here is accurate, current or complete, and therefore shouldn’t be relied upon as such. The information, whether from a third party or not, isn’t to be considered as a recommendation; or an offer to buy or sell; or the solicitation of an offer to buy or sell any security, financial product or instrument; or to participate in any particular trading strategy. It does not take into account readers’ financial situation or investment objectives. We advise any readers of this content to seek their own advice. Without the approval of Pepperstone, reproduction or redistribution of this information isn’t permitted.