- English
- 简体中文
- 繁体中文
- ไทย
- Tiếng Việt
- Español
- Português
- لغة عربية
- Монгол хэл
AUS 200 Explained: Key Facts About Australia's Top Stock Market Index
AUS 200
The AUS 200 – also known as the S&P/ASX 200, AXJO or AU200– is a critical benchmark for Australian markets (Australian shares). It's a float-adjusted market capitalization-weighted index, meaning the influence of each of the 200 largest companies listed on the Australian Securities Exchange (ASX) is reflected by their market capitalisation, with adjustments made for freely available shares. Together, these stocks account for over 80% of the entire Australian equity market’s market capitalisation.
The index was first calculated in March 2000, with a value of 3133, which at the time was equivalent to the value of the ‘All Ordinaries’ index, the oldest Australian equity index, comprised of the largest 500 listed securities on the ASX.
Being a cap-weighted index, the larger the market capitalisation of a stock within the AUS 200, the greater its contribution to the total value of the overall index. In order to be eligible for inclusion in the index, a stock must be listed on the ASX, as well as having a significant daily trading volume.
Market participants closely watch the AUS 200 as a barometer of the Australian economy's health. Its performance can be influenced by various factors, including decisions by central banks regarding rate cuts and overall economic conditions.
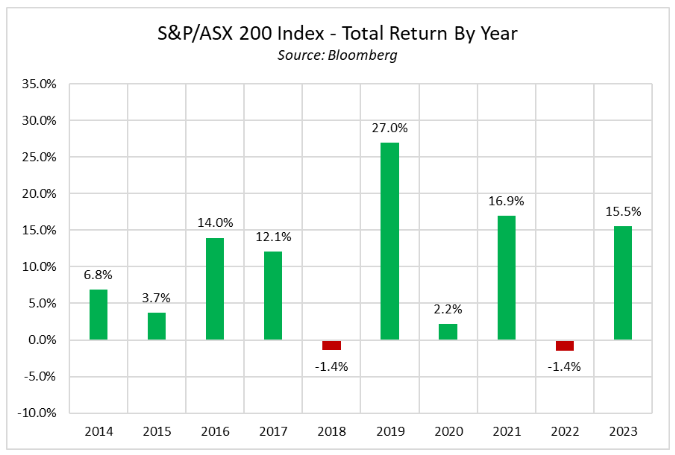
Recent performance, on a total return basis for the AUS 200, though not a firm predictor of future results, is shown below.
In terms of index weightings, the top 50 largest stocks are as follows.
Stock | Weighting as of 01/10/2024 |
TRANSURBAN GROUP | 1.66% |
QBE INSURANCE GROUP LIMITED | 1.12% |
COCHLEAR LIMITED | 0.96% |
BRAMBLES LIMITED | 0.92% |
XERO LIMITED | 0.81% |
WISETECH GLOBAL LIMITED | 0.72% |
APA GROUP | 0.41% |
MINERAL RESOURCES LIMITED | 0.39% |
SEEK LIMITED | 0.33% |
EVOLUTION MINING LIMITED | 0.31% |
STEADFAST GROUP LIMITED | 0.29% |
WORLEY LIMITED | 0.29% |
TELIX PHARMACEUTICALS LIMITED | 0.22% |
RELIANCE WORLDWIDE CORPORATION LIMITED | 0.17% |
SANDFIRE RESOURCES LIMITED | 0.17% |
FLIGHT CENTRE TRAVEL GROUP LIMITED | 0.16% |
DOWNER EDI LIMITED | 0.14% |
AMP LIMITED | 0.14% |
ARB CORPORATION LIMITED | 0.14% |
PREMIER INVESTMENTS LIMITED | 0.13% |
BLOCK, INC. | 0.13% |
VAULT MINERALS LIMITED | 0.11% |
ARCADIUM LITHIUM PLC | 0.09% |
CAPRICORN METALS LTD | 0.08% |
NICKEL INDUSTRIES LIMITED | 0.08% |
CHARTER HALL RETAIL REIT | 0.08% |
EAGERS AUTOMOTIVE LIMITED | 0.08% |
INGENIA COMMUNITIES GROUP | 0.08% |
WAYPOINT REIT | 0.08% |
ARENA REIT | 0.07% |
NRW HOLDINGS LIMITED | 0.06% |
CENTURIA CAPITAL GROUP | 0.06% |
DATA#3 LIMITED | 0.05% |
SITEMINDER LIMITED | 0.05% |
HELIA GROUP LIMITED | 0.04% |
CHARTER HALL SOCIAL INFRASTRUCTURE REIT | 0.04% |
LIFESTYLE COMMUNITIES LIMITED | 0.04% |
FLETCHER BUILDING LIMITED | 0.03% |
TRANSURBAN GROUP | 1.66% |
QBE INSURANCE GROUP LIMITED | 1.12% |
COCHLEAR LIMITED | 0.96% |
BRAMBLES LIMITED | 0.92% |
XERO LIMITED | 0.81% |
WISETECH GLOBAL LIMITED | 0.72% |
APA GROUP | 0.41% |
MINERAL RESOURCES LIMITED | 0.39% |
SEEK LIMITED | 0.33% |
EVOLUTION MINING LIMITED | 0.31% |
STEADFAST GROUP LIMITED | 0.29% |
The material provided here has not been prepared in accordance with legal requirements designed to promote the independence of investment research and as such is considered to be a marketing communication. Whilst it is not subject to any prohibition on dealing ahead of the dissemination of investment research we will not seek to take any advantage before providing it to our clients.
Pepperstone doesn’t represent that the material provided here is accurate, current or complete, and therefore shouldn’t be relied upon as such. The information, whether from a third party or not, isn’t to be considered as a recommendation; or an offer to buy or sell; or the solicitation of an offer to buy or sell any security, financial product or instrument; or to participate in any particular trading strategy. It does not take into account readers’ financial situation or investment objectives. We advise any readers of this content to seek their own advice. Without the approval of Pepperstone, reproduction or redistribution of this information isn’t permitted.