What is forex trading and how does it work?
Forex trading is the exchange of currencies in the global market, aiming to profit from fluctuations in exchange rates. Traders buy or sell currency pairs based on market analysis, using platforms to execute trades.
Written by: Ioan Smith | Expert Financial Writer
What is forex trading?
Forex trading, or foreign exchange trading, is the global marketplace for buying and selling currencies. Over 70 currency pairs are traded globally in forex with traders exchanging pairs such as EUR/USD, GBP/USD or JPY/USD aiming to profit from changes in exchange rates. It operates 24/5, allowing trading on currency value fluctuations based on economic factors, news, and market trends.
Forex trading is not all about learning “how” to trade. One of the most important overlooked factors which can impact profits and losses is “when” to trade. A trader must identify the right time to enter and exit trades. The right move at the right time can positively impact the overall trading experience. The importance of market hours in forex trading cannot be overstated.
The Forex market remains active 24 hours a day but with more than a few passages of low to no activity. There are four major forex market sessions with some overlapping. Trading activity during the overlapping sessions is usually at its peak as compared to regular activity. The busiest trading sessions and time zones to trade in are between the London and New York sessions.
Generally accepted Forex session times (using UTC):
- Sydney 2100-0600 (UTC +10 hours)
- Tokyo 0000-0900 (UTC +9 hours)
- London 0700-1600 (UTC +1 hour)
- New York 1200-2100 (UTC -4 hours)
Profits and losses rely on the volatility and liquidity of the market, so a trader can enhance profit margins by understanding the market sessions. Different market sessions provide versatility in choosing trading hours. Thus a trader can determine the best time to trade according to trading goals and preferences. The Sydney session gives traders a good and brief idea about the potential weekly trading direction. The Sydney session overlaps with the Tokyo session for a few hours, which results in peak activity and high volatility. The Tokyo session overlaps with the end of the Sydney session and the start of the London session. During this session, market volatility and liquidity are on the higher side, which provides new opportunities for traders. During the London session trading volume is significant, and market activity is very high as this session overlaps with two of the most important forex market sessions. The London session overlaps the end of the Tokyo session and the start of the New York session. The New York session is the most active and significant session of all. Its activity affects pricing, volatility, and liquidity globally. Most traders trade in overlapping sessions to benefit from the different conditions each trading session provides.
How does forex trading work?
Forex trading works by buying one currency and selling another simultaneously in the foreign exchange market. Here's a simplified breakdown:
- Currency Pairs: Trading involves buying one currency and selling the other currency pair (e.g. EUR/USD).
- Exchange Rates: The rate at which one currency is exchanged for another determines the profit or loss.
- Market Orders: Market or limit orders placed to buy or sell currencies at current or specified prices.
- Execution: Orders are executed via a trading platform, and traders monitor positions to manage risks and profits.
- Leverage: Leverage controls larger positions with a smaller amount of capital, amplifying both potential gains and losses.
- Technical Analysis: Traders use technical analysis (charts, indicators) and fundamental analysis (economic data, news) to make informed decisions.
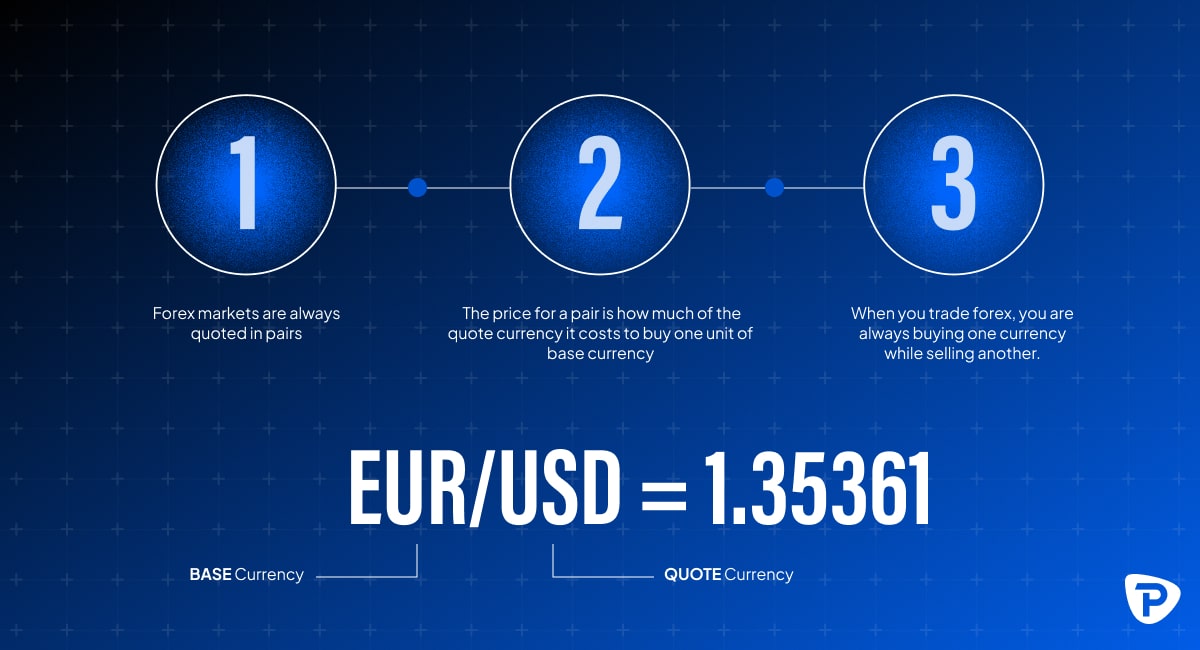
What is a forex pair?
A forex pair is the quotation of two currencies in the foreign exchange market, representing their relative fair value. The first currency is the base currency, and the second is the quote currency.
What are the base and quote currencies?
As mentioned above, in a forex pair the base currency is the first currency listed and is the one being bought or sold. The quote currency is the second currency and represents how much of it is needed to purchase one unit of the base currency. For example, in the EUR/USD pair, EUR is the base currency, and USD is the quote currency. If the EUR/USD pair is quoted at 1.1100, it means 1 EUR can be exchanged for 1.11 USD. In USD/JPY, the base currency is USD, and the quote currency is JPY. If the pair is quoted at 144.00, it means 1 USD can be exchanged for 144.00 JPY.
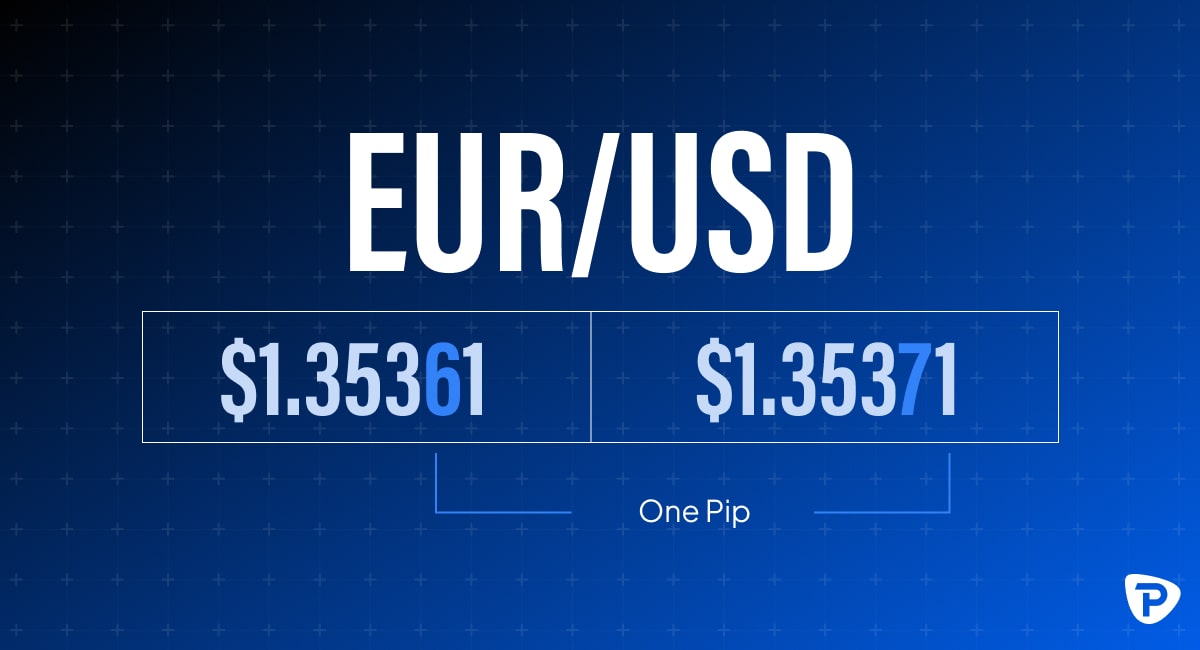
What is a PIP in forex?
A PIP, or "Percentage In Point," is the smallest unit of price movement in forex trading. It typically represents the fourth decimal place in a currency pair's quote (0.0001). For example, in the EUR/USD pair, a movement from 1.1050 to 1.1051 equals one PIP. PIPs help measure profit and loss and standardise changes in currency values.
- If the EUR/USD moves from 1.1075 to 1.1085, that’s an increase of 10 pips.
- If the EUR/USD moves from 1.1085 to 1.1075, that’s a decrease of 10 pips.
- The exception to this rule is the Japanese Yen (JPY), which is quoted to two decimal points:
- If the USD/JPY moves from 144.20 to 144.40, that’s an increase of 20 pips.
- If the USD/JPY moves from 144.05 to 143.95, that’s a decrease of 10 pips.
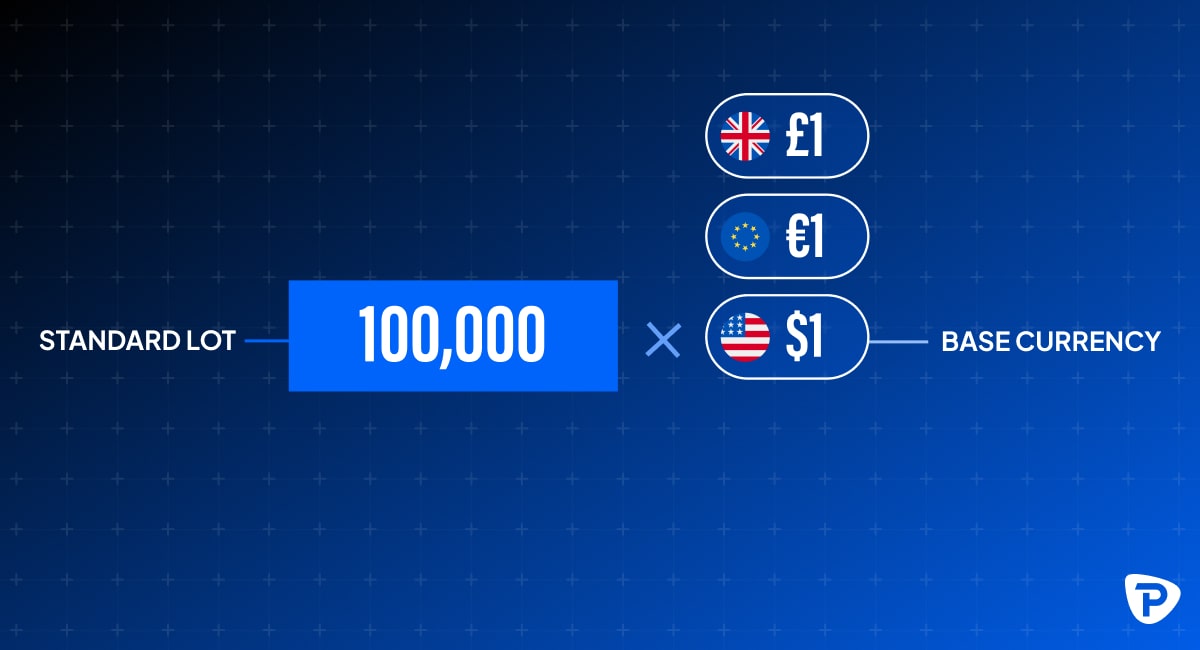
What is a lot in forex trading?
In forex trading, a lot is a standardised unit of measurement for the amount of currency being traded. There are four main types of lots:
- Standard lot: A standard lot represents 100,000 units of the base currency. For example, if you buy EUR/USD at an exchange rate of 1.1076, one standard lot would be worth $110,760 (100,000 × 1.1076).
- Mini lot: A mini lot represents 10,000 units of the base currency. Using the same EUR/USD example, a mini lot would be worth $11,076 (10,000 × 1.1076).
- Micro lot: A micro lot represents 1,000 units of the base currency. In this case, one micro lot for EUR/USD would be worth $1,107.60 (1,000 × 1.1076).
- Nano lot: A nano lot represents 100 units of the base currency. For EUR/USD, one nano lot would be worth $110.76 (100 × 1.1076). This size is often used by beginner traders or those managing very small accounts.
How lot sizes affects pip value
Using a 100,000-unit (standard) lot size here are examples on how it affects the pip value:
- USD/JPY at an exchange rate of 144.90: (.01 / 144.90) x 100,000 = $6.90 per pip
- USD/CHF at an exchange rate of 1.1791: (.0001 / 1.1791 x 100,000 = $8.48 per pip
In cases where the U.S. dollar is not quoted first, the formula is slightly different:
- EUR/USD at an exchange rate of 1.1080: (.0001 / 1.1080) x 100,000 = 9.03 x 1.1080 = $9.9999 rounded up will be $10 per pip
- GBP/USD at an exchange rate of 1.3170: (.0001 / 1.3170) x 100,000 = 7.59 x 1.3170 = $9.9999 rounded up will be $10 per pip.
Brokers may have a different convention for calculating pip values relative to lot size but will advertise what the pip value is for the currency being traded at any given time. As the market moves, so will the pip value depending on the currency being traded.
What are the benefits of forex trading?
Forex trading offers several benefits:
- 24-Hour Market: Operates around the clock, allowing trading at any time during weekdays.
- High Liquidity: Major currency pairs are highly liquid, making it easy to enter and exit positions. Daily trading volumes exceed $7 trillion, making it the most liquid financial market in the world. This allows for easy trade execution and minimal price slippage.
- Leverage: Allows control of larger positions with a smaller amount of capital, potentially increasing profits but also losses.
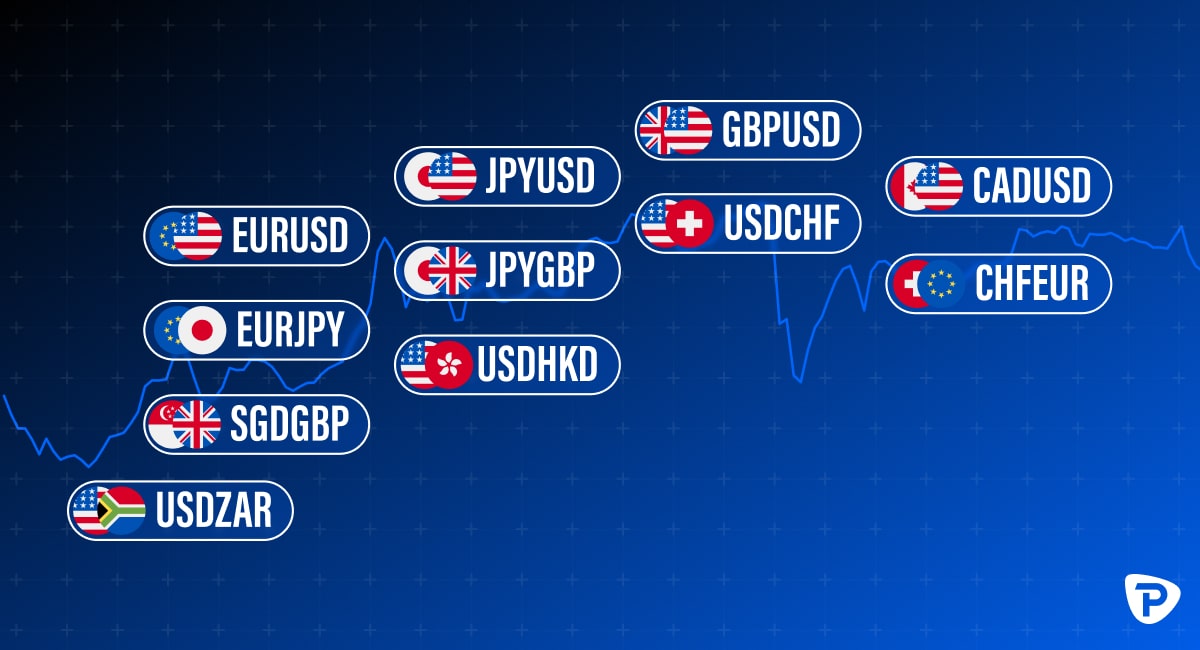
- Diverse Opportunities: Access to global markets and a variety of currency pairs provides numerous trading opportunities:
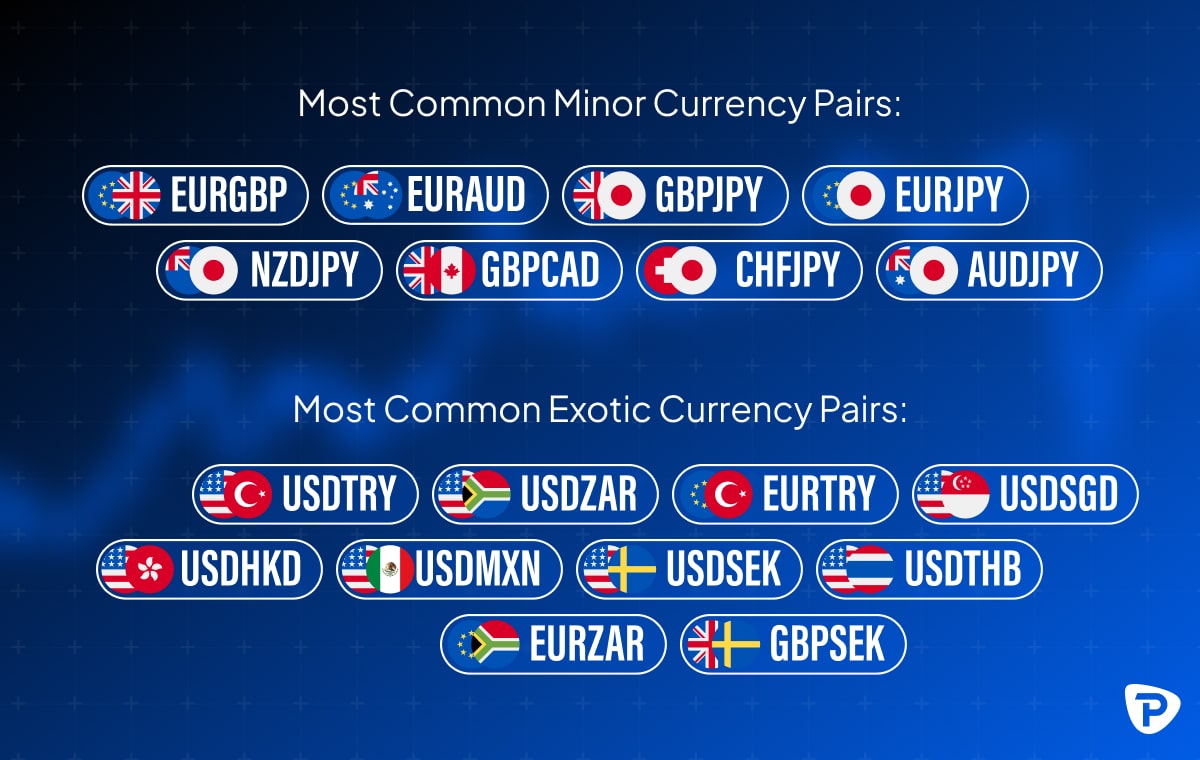
Most Common Minor Currency Pairs:
- EUR/GBP: Euro/British Pound
- EUR/AUD: Euro/Australian Dollar
- GBP/JPY: British Pound/Japanese Yen
- EUR/JPY: Euro/Japanese Yen
- NZD/JPY: New Zealand Dollar/Japanese Yen
- GBP/CAD: British Pound/Canadian Dollar
- CHF/JPY: Swiss Franc/Japanese Yen
- AUD/JPY: Australian Dollar/Japanese Yen
Most Common Exotic Currency Pairs:
- USD/TRY: U.S. Dollar/Turkish Lira
- USD/ZAR: U.S. Dollar/South African Rand
- EUR/TRY: Euro/Turkish Lira
- USD/SGD: U.S. Dollar/Singapore Dollar
- USD/HKD: U.S. Dollar/Hong Kong Dollar
- USD/MXN: U.S. Dollar/Mexican Peso
- USD/SEK: U.S. Dollar/Swedish Krona
- USD/THB: U.S. Dollar/Thai Baht
- EUR/ZAR: Euro/South African Rand
- GBP/SEK: British Pound/Swedish Krona
Minor pairs involve major currencies not paired with the USD, while exotic pairs include a major currency paired with one from a smaller or emerging economy.
- Low Transaction Costs: Typically, forex trading involves low or no commission fees, with costs embedded within the bid/ask spread.
- Accessibility: Many online platforms like TradingView offer easy access and user-friendly interfaces for traders of all levels.
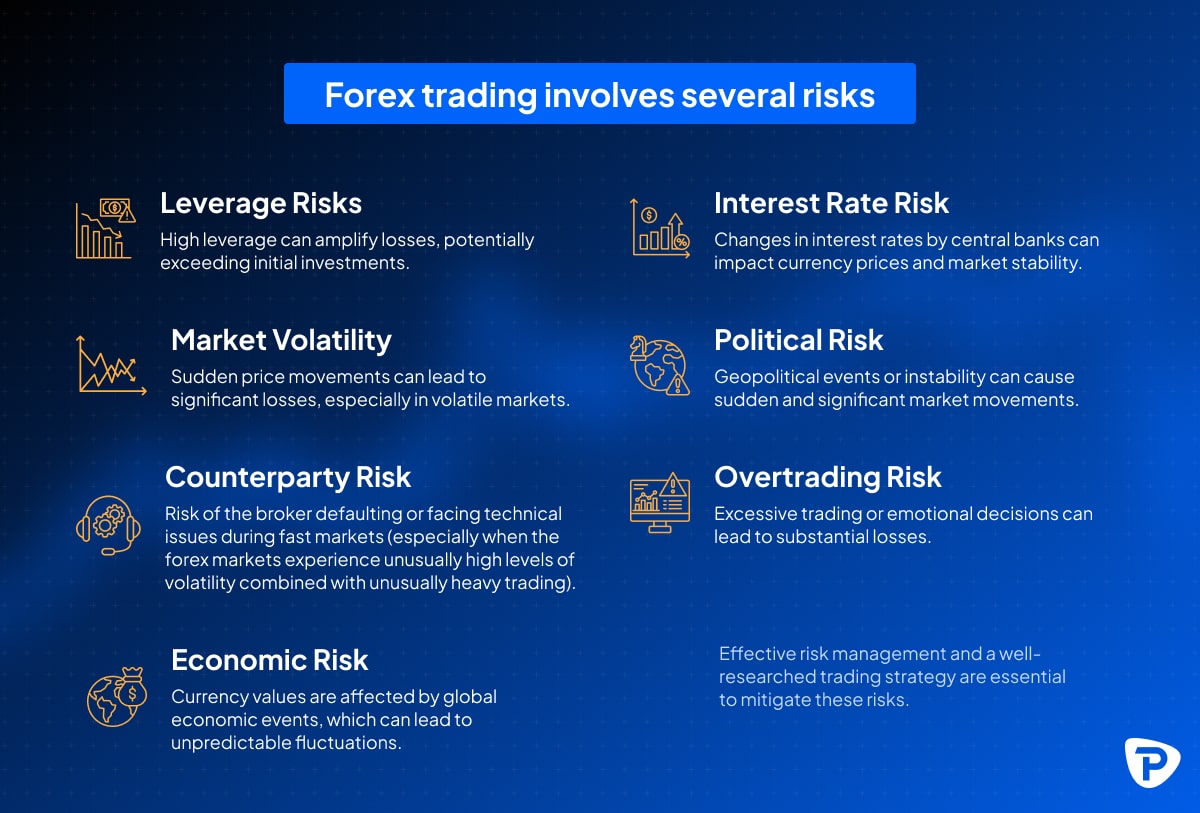
What are the risks of forex trading?
Forex trading involves several risks:
- Leverage Risk: High leverage can amplify losses, potentially exceeding initial investments.
- Market Volatility: Sudden price movements can lead to significant losses, especially in volatile markets.
- Counterparty Risk: Risk of the broker defaulting or facing technical issues during fast markets (especially when the forex markets experience unusually high levels of volatility combined with unusually heavy trading).
- Economic Risk: Currency values are affected by global economic events, which can lead to unpredictable fluctuations.
- Interest Rate Risk: Changes in interest rates by central banks can impact currency prices and market stability.
- Political Risk: Geopolitical events or instability can cause sudden and significant market movements.
- Overtrading Risk: Excessive trading or emotional decisions can lead to substantial losses.
Effective risk management and a well-researched trading strategy are essential to mitigate these risks.
What moves the forex market?
The forex market is influenced by several key factors:
- Economic Indicators: Reports such as GDP, employment data, inflation rates, and manufacturing output impact currency values. Strong economic performance typically strengthens a currency.
- Central Bank policies / Interest Rates: Actions and statements by central banks, including quantitative easing or monetary tightening, impact currency value. Higher interest rates typically attract foreign investment, boosting a currency's value, while lower rates can weaken it.
- Geopolitical Events: Political stability, elections, and geopolitical tensions can cause significant market movements. Brexit is a key example of a geopolitical event impacting forex trading. The UK's decision to leave the EU caused significant volatility in the GBP, with its value fluctuating sharply based on negotiation outcomes, political developments, and economic forecasts related to the exit process.
- Market Sentiment: Traders’ perceptions and psychological factors, including market rumours and news, influence currency movements.
- Trade and Capital Flows: Changes in trade balances and foreign investment levels can affect currency supply and demand. A trade surplus increases demand for a nation's currency, strengthening it, while a deficit weakens it. Similarly, high foreign investment inflows boost a currency's value, whereas outflows can lead to depreciation.
- Global Events: Natural disasters, pandemics, and major international events can create volatility in the forex market. The Covid-19 pandemic heightened forex market volatility, with currencies fluctuating due to economic uncertainty, lockdowns, and shifts in global trade. Safe-haven currencies like the USD and JPY initially surged, while others weakened. Central banks' stimulus measures and interest rate cuts further influenced currencies, creating both risks and opportunities for traders.

What is key forex terminology I need to know?
- Position: An open trade in the market.
- Leverage: Borrowed funds to control a larger position.
- Margin: The required amount to open and maintain a leveraged position.
- Pips: The smallest price movement in a currency pair.
- Exchange Rate: The price at which one currency is exchanged for another.
- Base Currency: The first currency in a pair, being bought or sold.
- Quote Currency: The second currency in a pair, used to value the base currency.
- Bid: The price at which you can sell a currency.
- Ask: The price at which you can buy a currency.
- Spread: The difference between the bid and ask price.
- Major Pairs: The most traded currency pairs, including USD.
- Exotic Pairs: Currency pairs that include one major currency and one from a developing economy.
- Stop-Limit Order: An order to buy or sell once a specific price is reached, but only within a set limit.
- Stop-Loss Order: An order to close a trade automatically at a set price to limit losses.
How do I start forex trading?
To start forex trading, consider the following steps:
Education: Learn the basics of forex trading, including terminology, strategies, and market dynamics.
- Choose a reliable broker: Select a reputable forex broker with good reviews, low spreads, and strong customer support.
- Open a trading account: Register for a trading account with the chosen broker, choosing the account type that suits required needs.
- Deposit funds: Fund the account with an affordable amount to risk.
- Download trading platform: Install the broker’s trading platform (like MetaTrader 4 or 5) for executing trades and analysing the market.
- Develop a trading plan: Create a strategy based on technical and fundamental analysis, including risk management rules. Consider finding a trading mentor to help you develop your trading plan.
- Start trading: Begin with demo trading to practice without risking real money. Once confident, start trading with real funds.
- Monitor and adjust: Continuously review trades, stay informed about market news, and adjust strategy as required.
What does a forex broker do?
A forex broker like Pepperstone acts as an intermediary between traders and the foreign exchange market. Key functions include:
- Market Access: Provides a platform for traders to buy and sell currency pairs.
- Order Execution: Facilitates the execution of buy and sell orders in the market.
- Leverage: Offers leverage, allowing traders to control larger positions with smaller amounts of capital.
- Spreads and Commissions: Earns revenue through spreads (the difference between bid and ask prices) and/or commissions.
- Market Data: Supplies real-time market quotes, charts, and news.
- Account Management: Manages trading accounts, including deposits, withdrawals, and account settings.
- Customer Support: Provides assistance with trading issues, account management, and technical support.
- Education and Tools: Offers educational resources, trading tools, and analysis to help traders make informed decisions.
Forex Trading FAQs
Is forex trading 24-hours?
Forex trading operates 24 hours a day, five days a week. The market opens on a Monday morning in Sydney and closes on Friday evening in New York, allowing for continuous trading across different global financial centres. This around-the-clock availability accommodates various time zones and trading schedules.
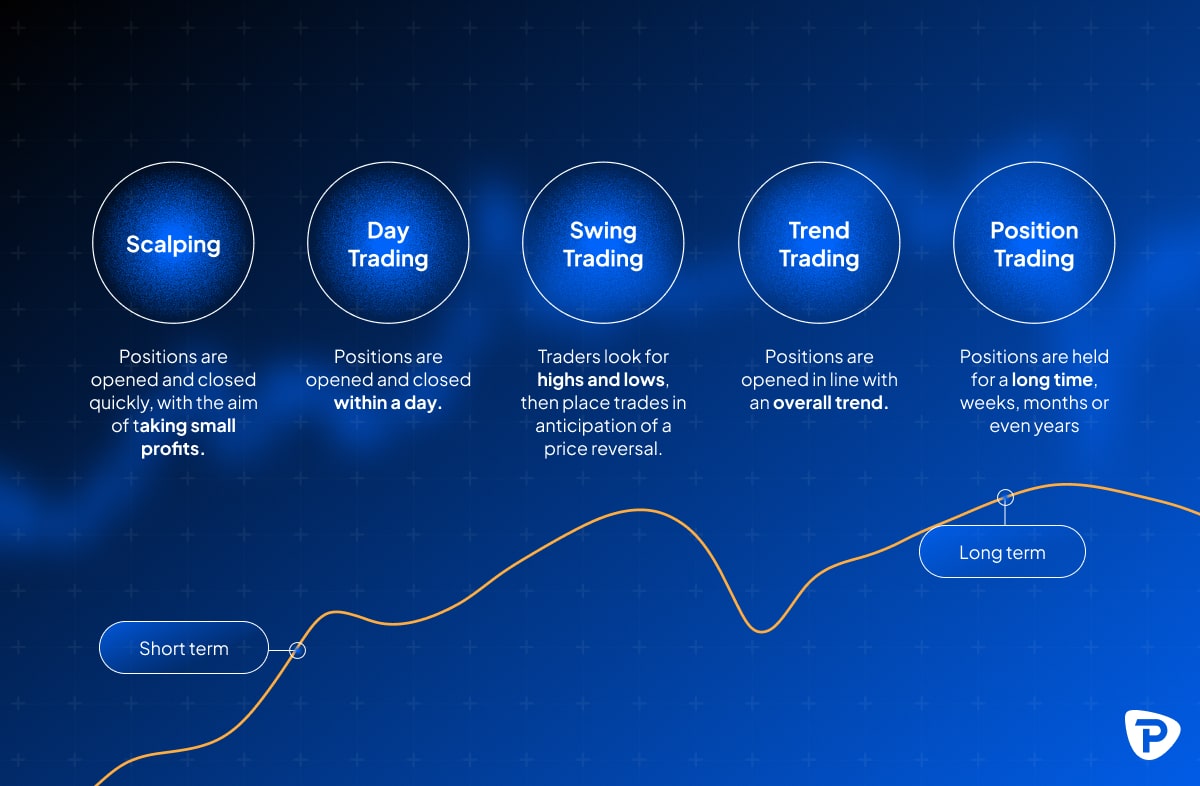
What are different strategies for forex trading?
- There are several common forex trading strategies to consider:
- Day trading: Buying and selling currencies within the same trading day to capitalise on short-term price movements.
- Swing trading: Holding positions for several days or weeks to benefit from expected market swings or trends.
- Scalping trading: Making numerous small trades throughout the day to capture tiny price changes and accumulate small profits. Frequent trading does increase transaction costs, and small market moves can quickly reverse, leading to losses that can outweigh the intended profits.
- Trend trading: Identifying and trading in the direction of the prevailing market trend, using indicators like moving averages.
- Range trading: Trading within a defined price range by buying at support levels and selling at resistance levels.
- Breakout trading: Entering trades when the price breaks out of a defined range or pattern, anticipating a significant price move in the prevailing direction.
- Carry trading: Exploiting the difference between interest rates of two currencies, by buying the currency with a higher interest rate and selling the one with a lower rate.
- Position trading: Taking long-term positions based on fundamental analysis and broader market trends, holding trades for weeks to months.
- News trading: Making trades based on economic news releases and their expected impact on currency prices.
- Technical analysis: Using charts and technical indicators to predict future price movements based on historical data and patterns.
How do forex traders make money?
Forex traders make money by capitalising on the fluctuations in currency exchange rates. They do so by adopting the following strategies:
- Buy Low, Sell High (long): Traders buy a currency pair when they expect its value to rise and sell when they anticipate a drop, benefiting from the difference between buying and selling prices
- Risk: Market conditions can change unexpectedly, leading to losses if the currency pair falls instead of rising.
- Sell High, Buy Low (short): Traders sell a currency pair when they expect the base currency to fall, then buy it back later when they predict a reversal, aiming to take advantage of price changes.
- Risk: If the currency increases in value instead of falling, traders may face significant losses when repurchasing the currency.
- Leverage: Using leverage, traders control larger positions with smaller capital, which can magnify both positive and negative outcomes.
- Risk: While leverage can amplify gains, it also increases exposure to losses, potentially leading to a margin call or loss of the entire trading account.
- Interest Rate Differentials: In carry trading, traders focus on the interest rate difference between two currencies, buying one with a higher rate and selling one with a lower rate.
- Risk: Sudden changes in interest rates or currency depreciation can negate potential gains, leading to losses.
- Arbitrage: This strategy involves exploiting price discrepancies of the same currency pair across different markets or brokers.
- Risk: Price gaps may close rapidly, and transaction costs or delays in execution can erode potential profits.
- Swing and Trend Trading: Traders analyse market trends and price movements, entering and exiting trades based on short-term or long-term market behaviour, aiming to capture favourable price changes.
- Risk: Market trends may reverse unexpectedly, resulting in unanticipated losses if trades are not managed properly.
What are the basic forex signals?
Basic forex signals are tools or indicators used to identify potential trading opportunities. Some key types to consider:
- Moving Averages: Averages over specific periods (e.g. 50- and/or 200-day) that smooth out price data to identify trends and potential reversal points.
- Relative Strength Index (RSI): Measures the speed and rate of change of prices to identify overbought or oversold conditions.
- MACD (Moving Average Convergence Divergence): A trend-following momentum indicator that shows the relationship between two moving averages of a currency pair.
- Bollinger Bands: Consists of a middle band (moving average) and two outer bands (usually 2 standard deviations) that indicate volatility and potential price levels for reversals.
- Trendlines: Lines drawn on charts to connect significant highs or lows, helping to identify the direction and strength of a trend.
- Support and Resistance Levels: Horizontal lines marking price levels where the currency pair has historically had difficulty moving above (resistance) or below (support).
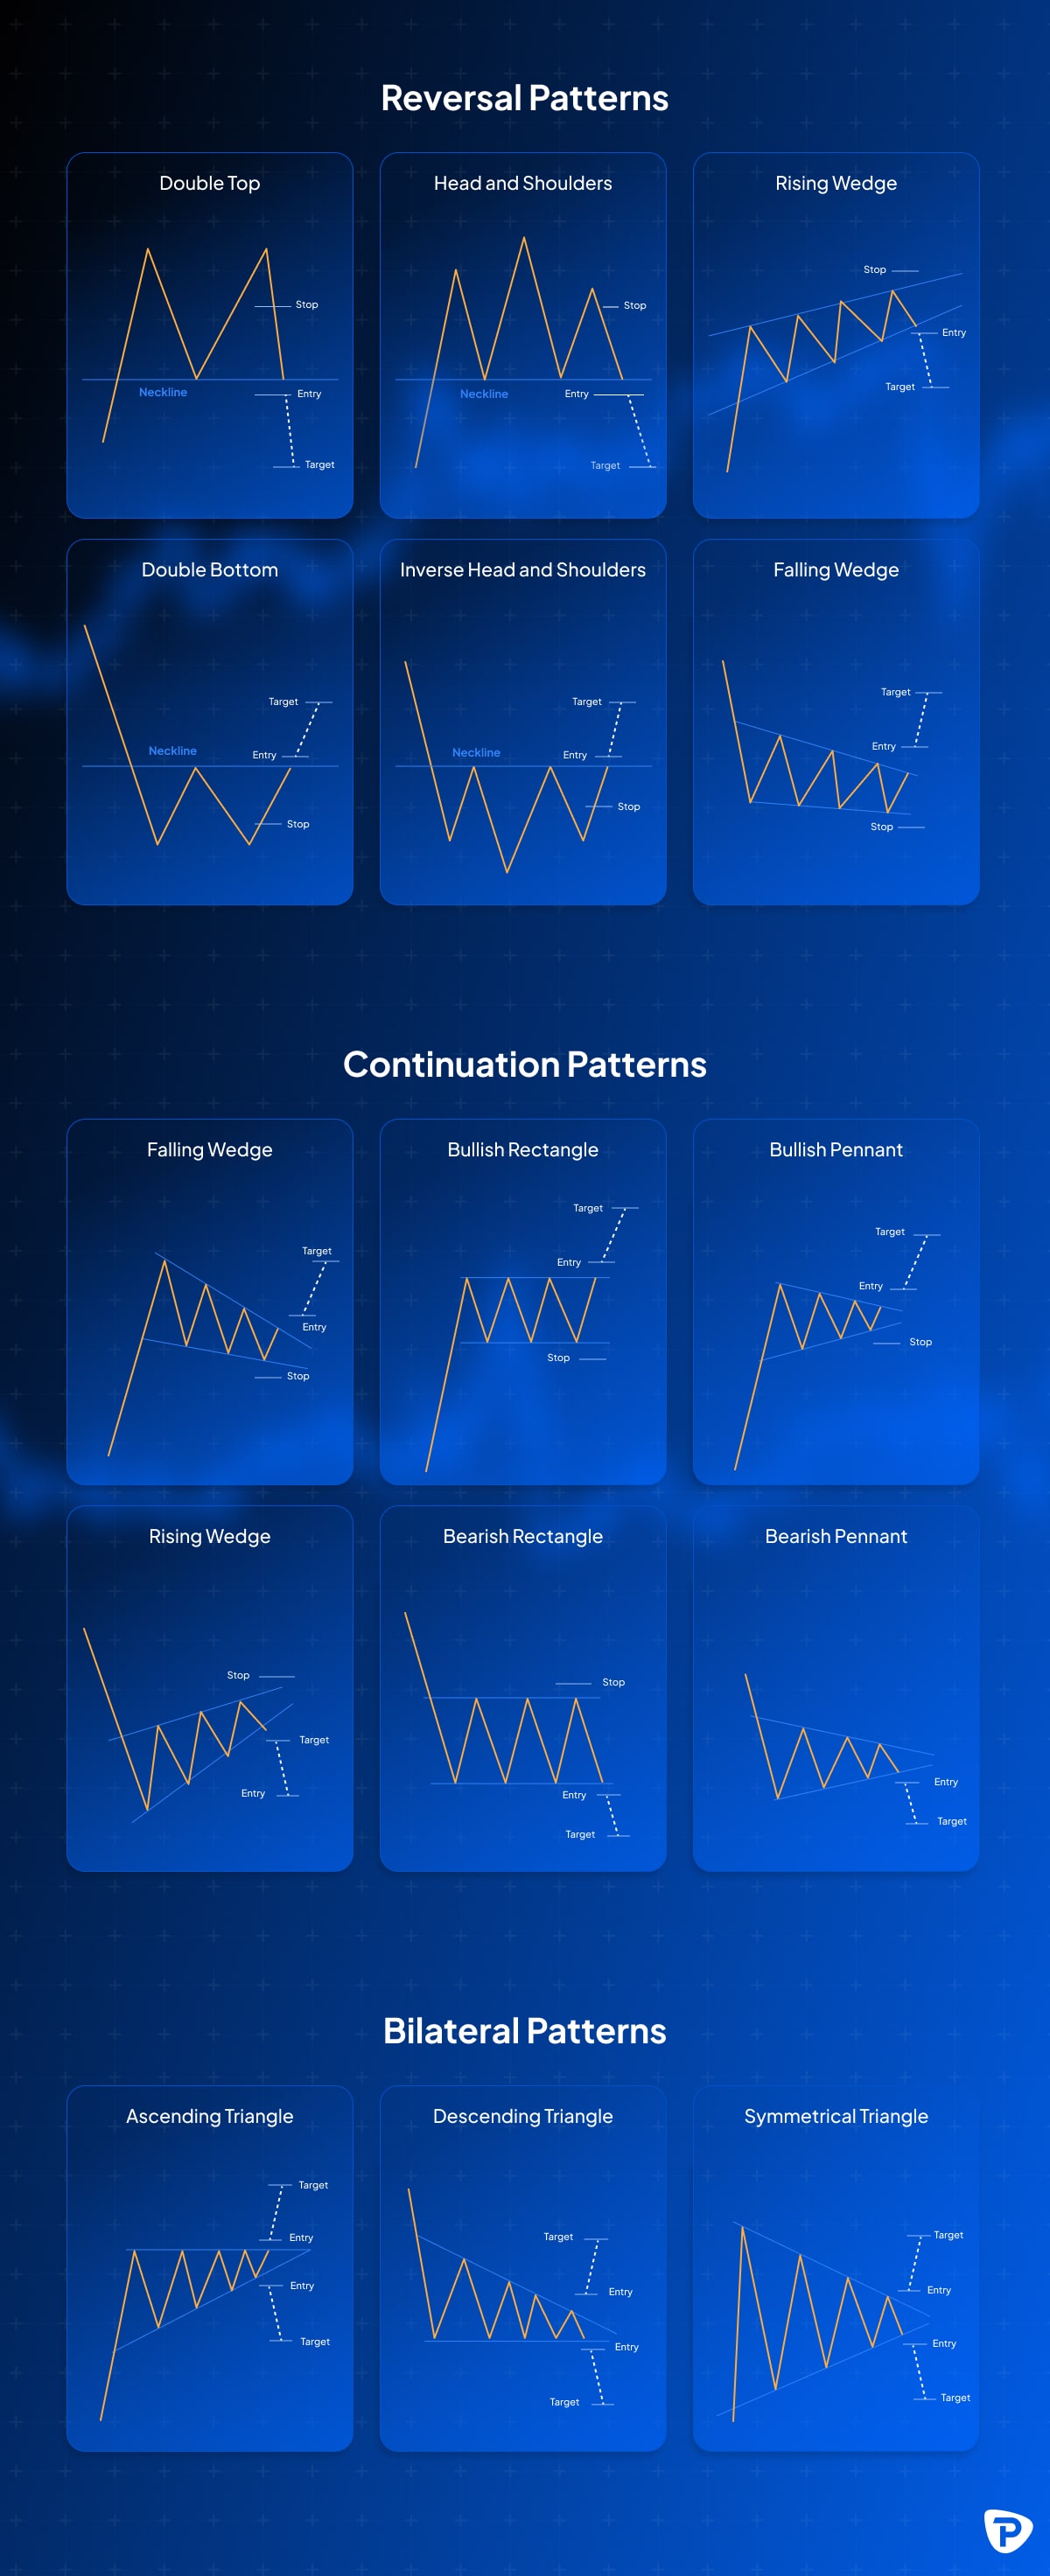
- Chart Patterns: Formations like head and shoulders, double tops/bottoms, and triangles that indicate potential market trends and reversals. (see below)
The material provided here has not been prepared in accordance with legal requirements designed to promote the independence of investment research and as such is considered to be a marketing communication. Whilst it is not subject to any prohibition on dealing ahead of the dissemination of investment research we will not seek to take any advantage before providing it to our clients.
Pepperstone doesn’t represent that the material provided here is accurate, current or complete, and therefore shouldn’t be relied upon as such. The information, whether from a third party or not, isn’t to be considered as a recommendation; or an offer to buy or sell; or the solicitation of an offer to buy or sell any security, financial product or instrument; or to participate in any particular trading strategy. It does not take into account readers’ financial situation or investment objectives. We advise any readers of this content to seek their own advice. Without the approval of Pepperstone, reproduction or redistribution of this information isn’t permitted.