CFDs are complex instruments and come with a high risk of losing money rapidly due to leverage. 80% of retail investor accounts lose money when trading CFDs with this provider. You should consider whether you understand how CFDs work and whether you can afford to take the high risk of losing your money.
- English
- 简体中文
- 繁体中文
- ไทย
- Tiếng Việt
- Español
- Português
- لغة عربية

This announcement was not only large, but well-timed, coinciding with the weekly unemployment claims which came in at a staggering 6.6 million workers filing for unemployment.
As at the date of this article, unemployment in America now stands at 22 million. While all these record setting numbers have been coming through, we are now in America’s company earning season, with early indicators showing an incredibly mixed bag of results. The question remains that with so much uncertainty, which are the best currencies and commodities to trade, and how do you trade them?
Donald Trump announces plan to re-open the economy
Donald Trump plans to re-open the American economy sooner rather than later, with his administration giving guidance to America’s governors last night that they can start to think about re-opening, possibly even before the previously pencilled in date of the 1st of May.
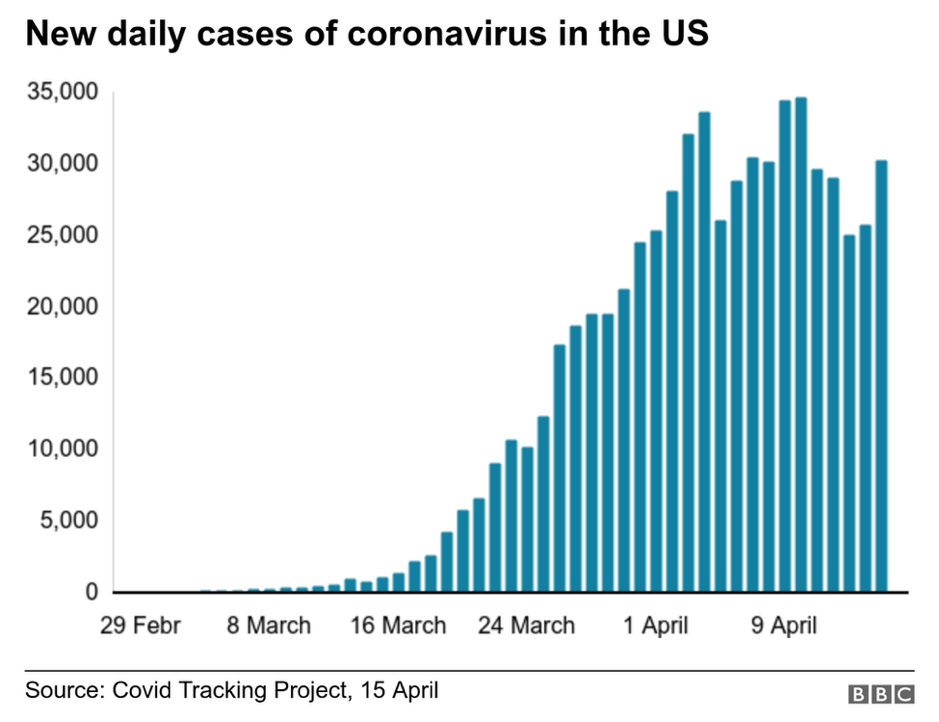
With the daily cases beginning to slow, (as seen in the chart below) the plan is to get Americans back to work as soon as possible, as the current economic damage is obviously severe. This announcement sent the S&P 500 up a further 3% last night, with a movement of money into RISK on assets. Below we will look at some key areas to watch as technical traders on WTI Crude, EURUSD and USDJPY.
Historic OPEC deal but weak crude?
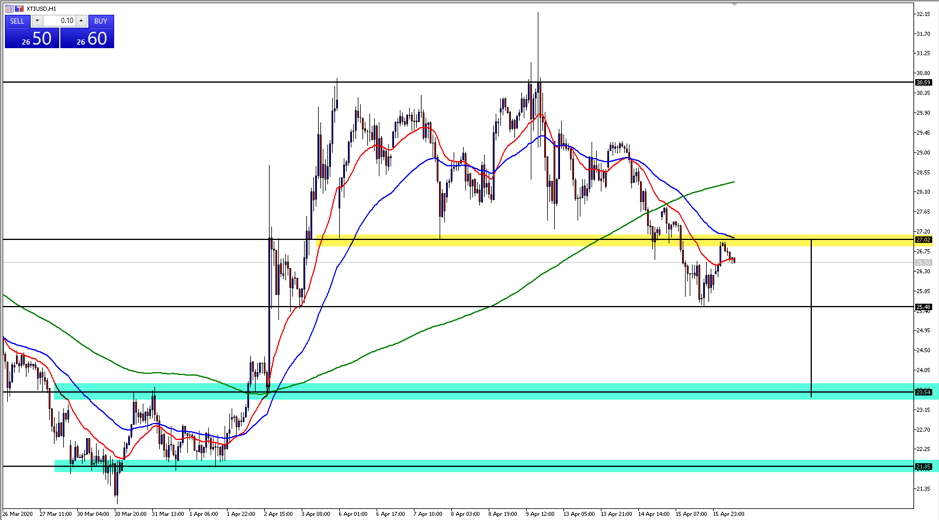
The chart above shows WTI crude’s wild ride over the last few weeks. With lows at $21.00 and highs at $32.00, crude’s percentage daily changes are mind boggling. The historic OPEC deal that was struck did little to convince the market that oil should be going up, with weak demand due to the global shutdowns driving prices lower.
From a technical perspective, the $27.00 a barrel level (highlighted in yellow) has provided a key level of support on the 1-hour chart. This level is now acting as a role reversal zone, where $27.00 becomes a resistance point, making it an especially important level for traders to monitor. Another close below the lows of $25.40 would expose the two previous points of support highlighted in green at $23.54 and $21.85 as the next potential target.
EURUSD breaks through a key trendline
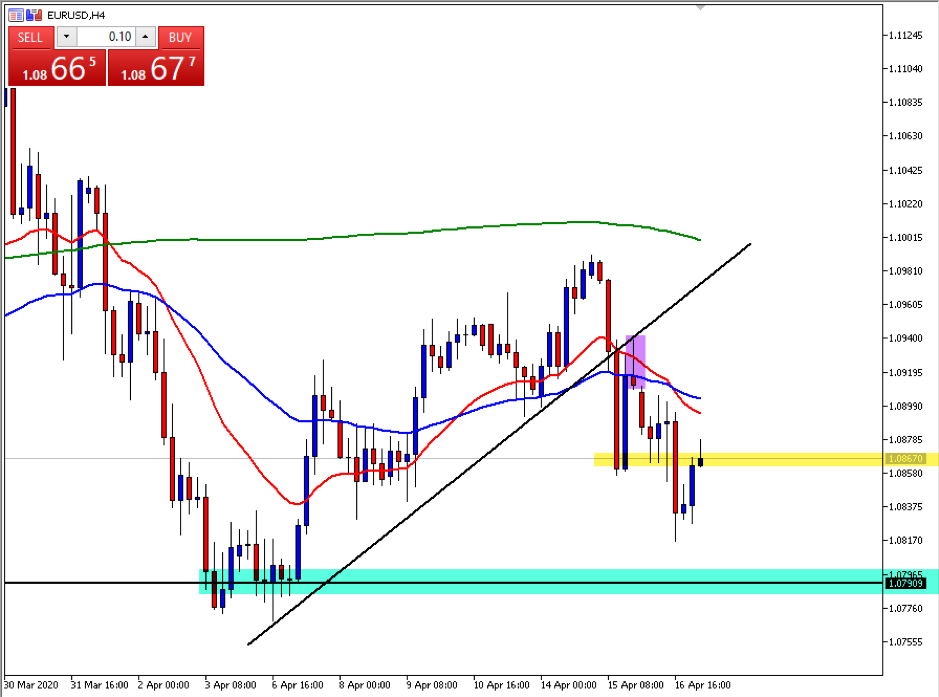
The chart above shows a trendline that was broken on the EURUSD on the 15th of April when price moved below 1.09200. This break was quickly followed by a rally that pushed price back into the trendline which acted as a role reversal area, where previous support became resistance.
What is interesting about this chart is the candle that forms after this rally, (highlighted in purple) where a shooting star candle has formed, indicating bearish sentiment. The price action that followed this candle has been amazing, with a close below the 1.08670 lows, (highlighted in yellow) and then a retest of the zone which we are currently seeing. The next level of support is at the 1.07900 area highlighted in green.
USDJPY finds support at the 1.07 zone
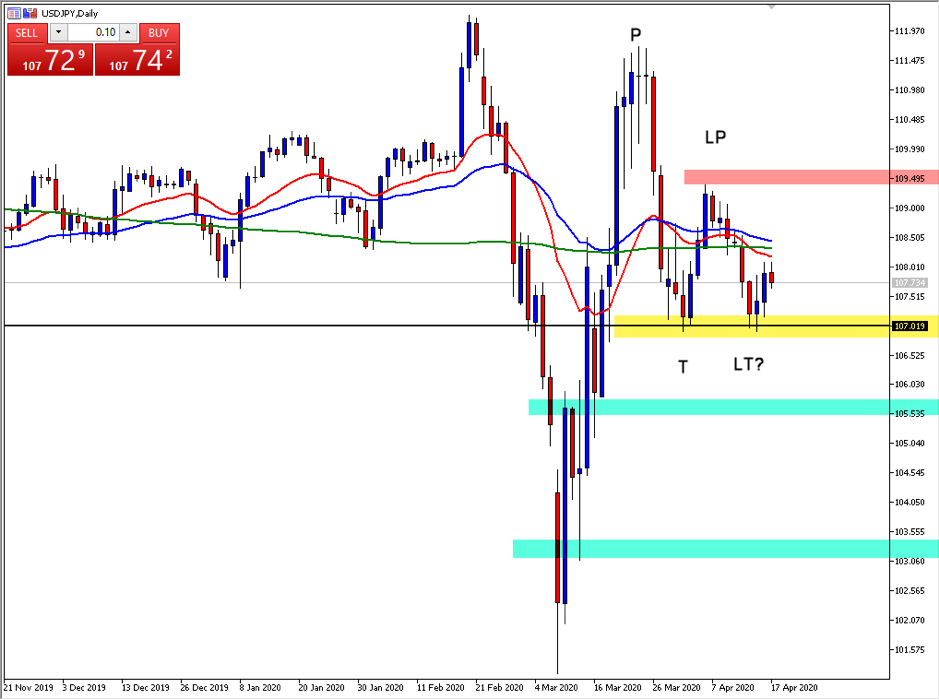
The chart above shows the USDJPY finding support at the 1.0700 area highlighted in yellow. The interesting thing about this zone is that it can be viewed two ways from a technical standpoint. If price was to continue to bounce up from the 1.0700 zone and break through the area highlighted in red at 1.0950, a double bottom pattern formation would have occurred, and this would give traders a clear signal that the market is potentially bullish on the daily timeframe.
However, if price closed below the 1.0700 area on the daily timeframe, we may see the two zones highlighted in green become the next areas of support. This price action would form a lower trough on the charts and signal a change of trend on the daily timeframe from the previous bullish momentum.
Trading through uncertainty, volatility and unprecedented stimulus
One thing everyone can agree on is that the outbreak of COVID-19 is causing major economic harm to all nations in lockdown. The problem for traders is trying to figure out how long this may last, and whether the current economic stimulus packages are too little or too large to support the global economy.
It remains to be seen on these matters but at times when the Volatility Indicator (VIX) is above 20, it can be beneficial to move your current trading strategy to a shorter timeframe, as moves are quick and sharp. Generally, it is scalpers and day traders who tend to perform better during these periods, and it’s certainly worth adapting your trading expectations to the current market conditions.
Ready to trade?
It's quick and easy to get started. Apply in minutes with our simple application process.
The material provided here has not been prepared in accordance with legal requirements designed to promote the independence of investment research and as such is considered to be a marketing communication. Whilst it is not subject to any prohibition on dealing ahead of the dissemination of investment research we will not seek to take any advantage before providing it to our clients.
Pepperstone doesn’t represent that the material provided here is accurate, current or complete, and therefore shouldn’t be relied upon as such. The information, whether from a third party or not, isn’t to be considered as a recommendation; or an offer to buy or sell; or the solicitation of an offer to buy or sell any security, financial product or instrument; or to participate in any particular trading strategy. It does not take into account readers’ financial situation or investment objectives. We advise any readers of this content to seek their own advice. Without the approval of Pepperstone, reproduction or redistribution of this information isn’t permitted.