- English
- 简体中文
- 繁体中文
- ไทย
- Tiếng Việt
- Español
- Português
- لغة عربية

Data review
China’s official Manufacturing PMI in February plummets to a record low of 35.7 from 50 the previous month due to the coronavirus outbreak. It’s far worse than the medium estimation (45) and even lower than the numbers during the GFC.
Manufacturing PMI (white) and non-Manufacturing PMI (yellow)
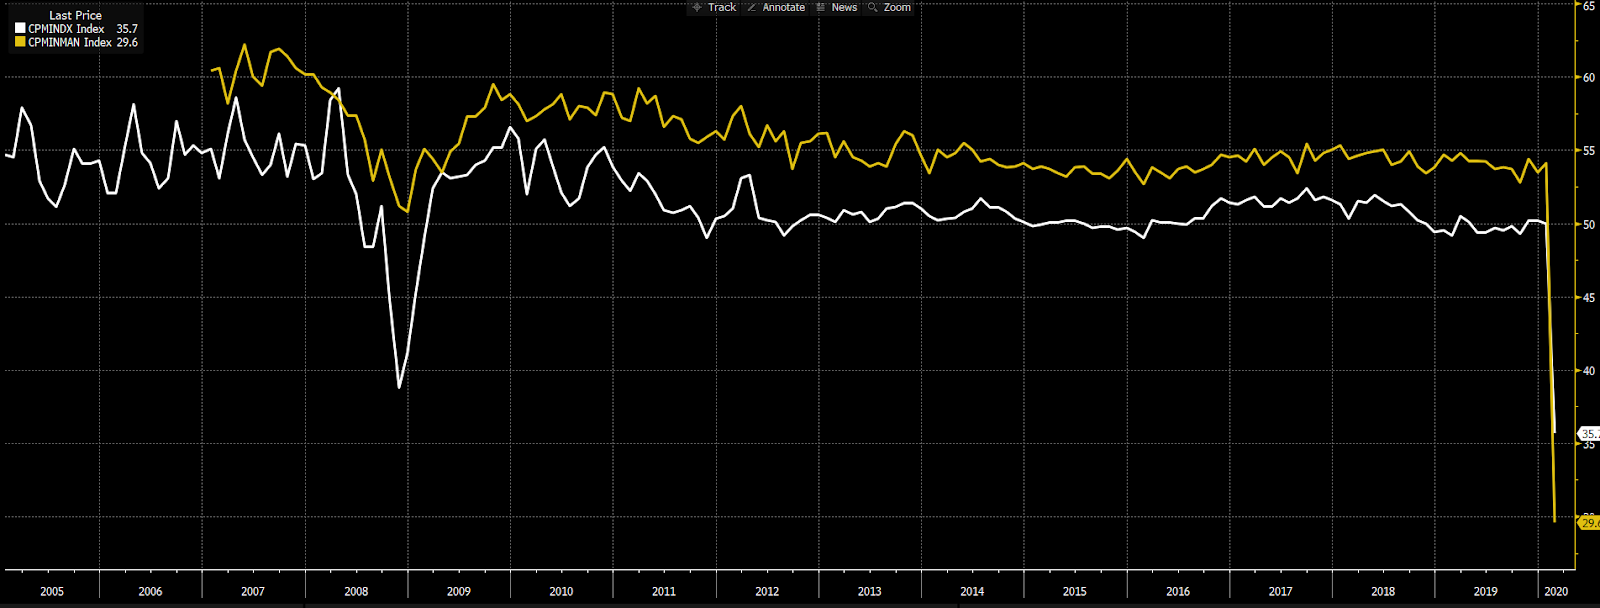
Source: Bloomberg
All subcomponents fell sharply, with output (27.8 vs 51.3 in January) and new orders (29.3 vs 51.4) contributing the most as they are a combined 55% weight in the calculation. Despite all industries have fallen into contraction territory, food processing and pharmaceutical manufacturing outperformed other industries.
Non-Manufacturing PMI in February printed at 29.6, nearly half of the previous 54.1 and well below the lowest estimation (42) and GFC figures.
Caixin China Manufacturing PMI released Monday also sits at a record low of 40.3. Caixin PMI includes only 430 small-to-medium companies in the sample, while China’s official PMI is based on a survey of 3000 large companies spread across 31 manufacturing industries.
Regional and global impact
The virus outbreak has been largely disrupting supply chains due to travel restriction, shuttered business and increasing delayed shipment. The fallout can be clearly seen in the Manufacturing data from South Korea (yellow), Japan (purple), Taiwan (red), and Vietnam (green).
Manufacturing PMIs in Asia
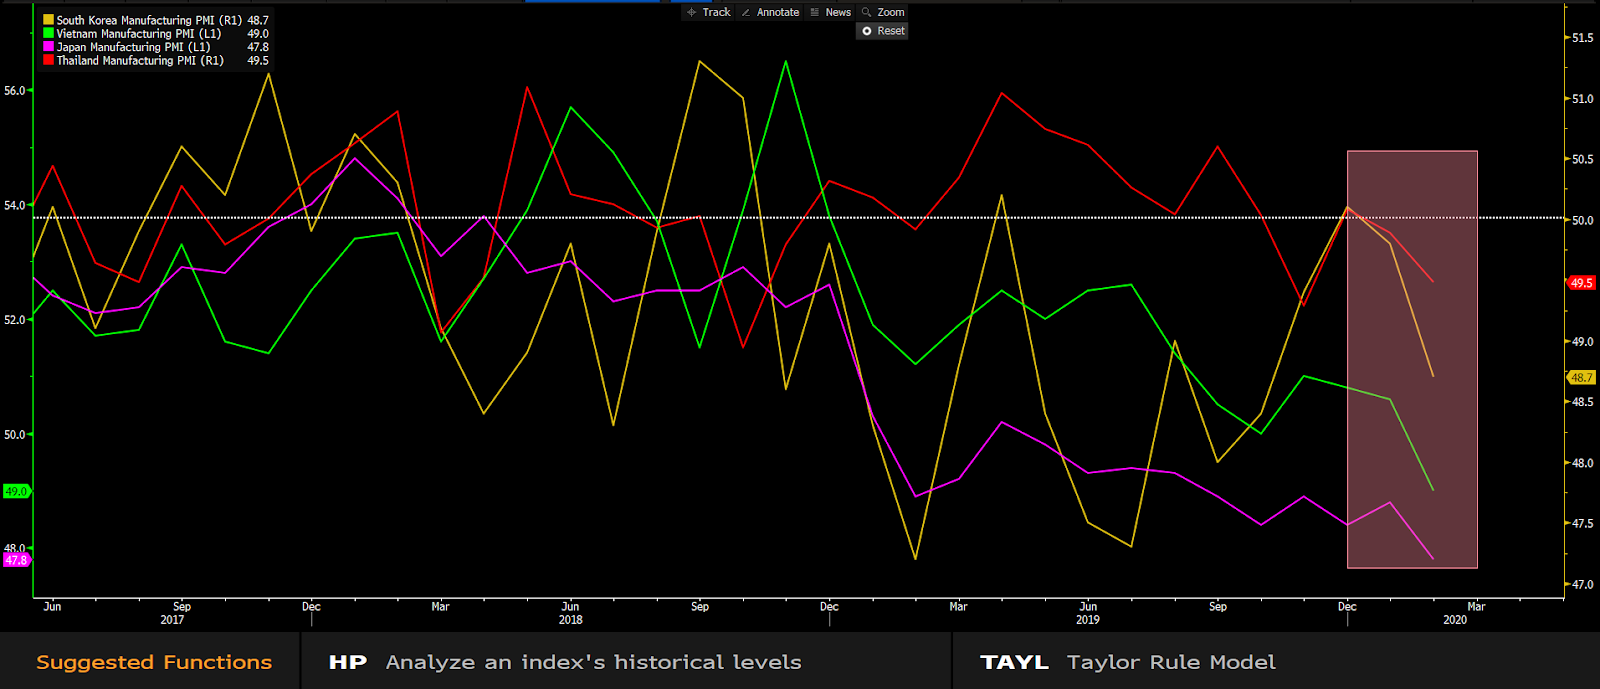
Source: Bloomberg
The economic impact is not only confined to Asia. The JPMorgan Global Manufacturing PMI in February fell 3.2 points to 47.2, suggesting that global economies may face the biggest risk since the global financial crisis, perhaps even worse.
OECD has cut global growth in 2020 to 2.4% from 2.9%, which would be the weakest numbers since 2009.
Impacts on financial markets
Chinese markets on Monday seemed to ignore these poor numbers, with the offshore yuan (USDCNH) further strengthening to 6.96 per dollar and the benchmark index CSI 300 up by 3.29%.
The recent broad USD weakness has lent support to CNH, which has rallied in all trading sessions last week and is now firmly trading below the 7 handle. On the other hand, the daily reference price of onshore yuan (USDCNY) was set at 6.9811 yesterday, the strongest level since middle February.
We have also seen a very bullish daily candlestick from CN50, an alternative investment of mainland China’s stock market. CN50 is now testing the 50% retracement level, with the RSI developing above 50. The February high of 13984 will be the immediate challenge, but on currency price action and technical set-up, the trading bias is for higher levels in the near-term.
CN50 daily chart
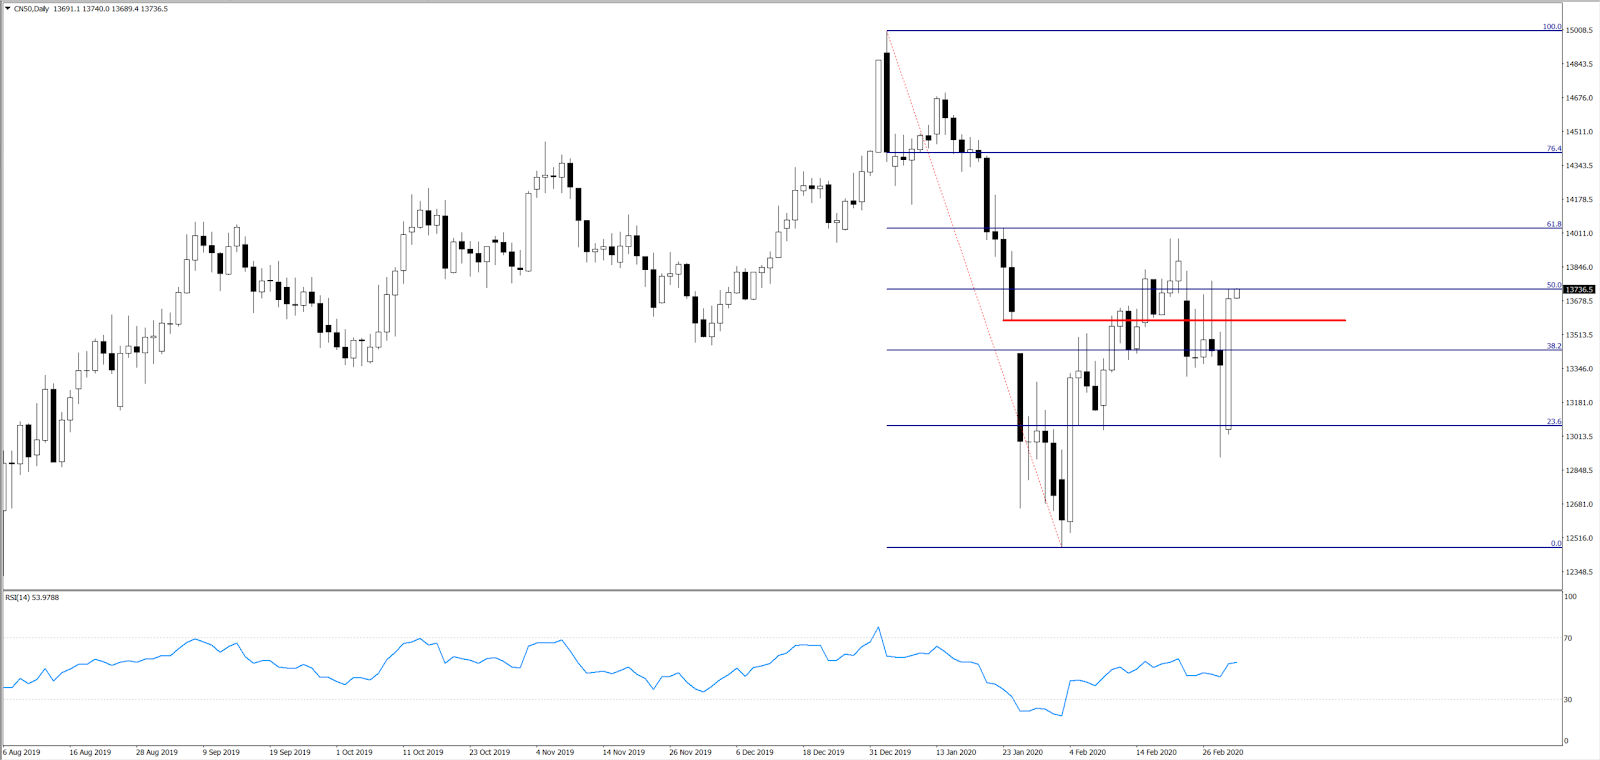
Source: MT4
As the covid-19 virus stabilises across China and the expectation of massive stimulus measures boost confidence, the stock market is reflecting positive sentiment with expectations of a potential strong rebound in the following months. The potential synchronised easing actions by global central banks (like the Fed, BoJ and BoE) are fuelling the rally.
Since the yield spread between China and the US is picking up, yuan-related assets might appeal at the moment.
Ready to trade?
It's quick and easy to get started. Apply in minutes with our simple application process.
The material provided here has not been prepared in accordance with legal requirements designed to promote the independence of investment research and as such is considered to be a marketing communication. Whilst it is not subject to any prohibition on dealing ahead of the dissemination of investment research we will not seek to take any advantage before providing it to our clients.
Pepperstone doesn’t represent that the material provided here is accurate, current or complete, and therefore shouldn’t be relied upon as such. The information, whether from a third party or not, isn’t to be considered as a recommendation; or an offer to buy or sell; or the solicitation of an offer to buy or sell any security, financial product or instrument; or to participate in any particular trading strategy. It does not take into account readers’ financial situation or investment objectives. We advise any readers of this content to seek their own advice. Without the approval of Pepperstone, reproduction or redistribution of this information isn’t permitted.