- English
- 简体中文
- 繁体中文
- ไทย
- Tiếng Việt
- Español
- Português
- لغة عربية
April 2024 CPI Recap: Welcome Relief For The FOMC

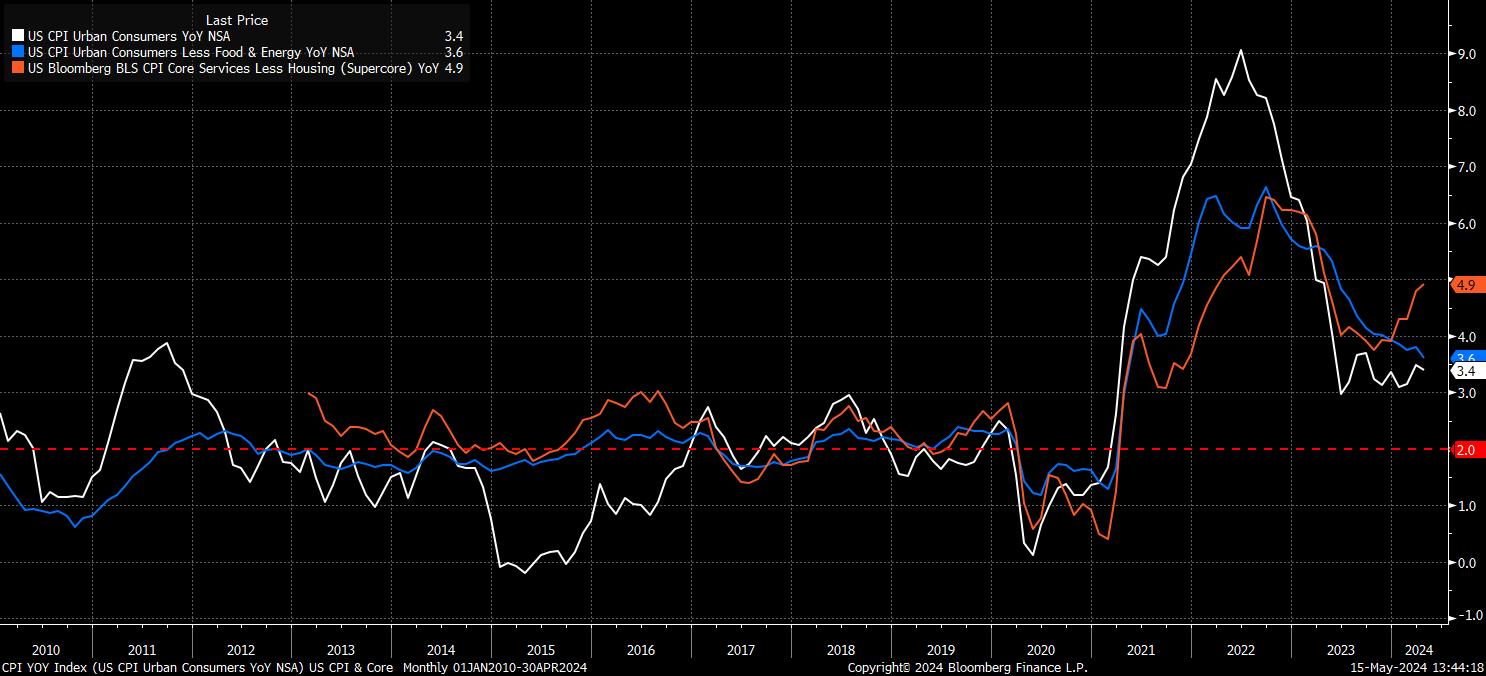
Headline CPI rose by 3.4% YoY in April, bang in line with consensus expectations, and a downtick from the 3.5% YoY pace seen a month prior – snapping a run of three consecutive hotter than expected headline inflation prints.
Meanwhile, core CPI – excluding the volatile food and energy components – rose by 3.6% YoY, also bang in line with expectations, while representing the lowest annual core inflation print since May 2021. Removing further volatile components to produce the ‘supercore’ metric (aka core services ex housing), however, may take some shine off the easing in price pressures shown elsewhere, with the aforementioned figure rising to 4.9% YoY, from 4.8% prior, its highest level in a year.
Increasingly, however, the MoM CPI metrics have attracted more attention than the annual figures, particularly as FOMC members place greater weight on the 3- and 6-month annualised inflation metrics as a more accurate gauge of underlying price pressures. Although, of course, policymakers continue to use the PCE inflation data, due on 31st May, as the yardstick against which progress towards the 2% target is measured.
Headline CPI rose 0.3% MoM last month, a touch below the 0.4% monthly rise notched in March, while core prices also rose 0.3% MoM in April, in line with expectations, and a touch cooler than the 0.4% pace seen a month prior. Annualising the above figures produces the below:
- 3-month annualised CPI: 4.6% (prior 4.6%)
- 6-month annualised CPI: 3.7% (prior 3.2%)
- 3-month annualised core CPI: 4.1% (prior 4.5%)
- 6-month annualised core CPI: 4.0% (prior 3.9%)
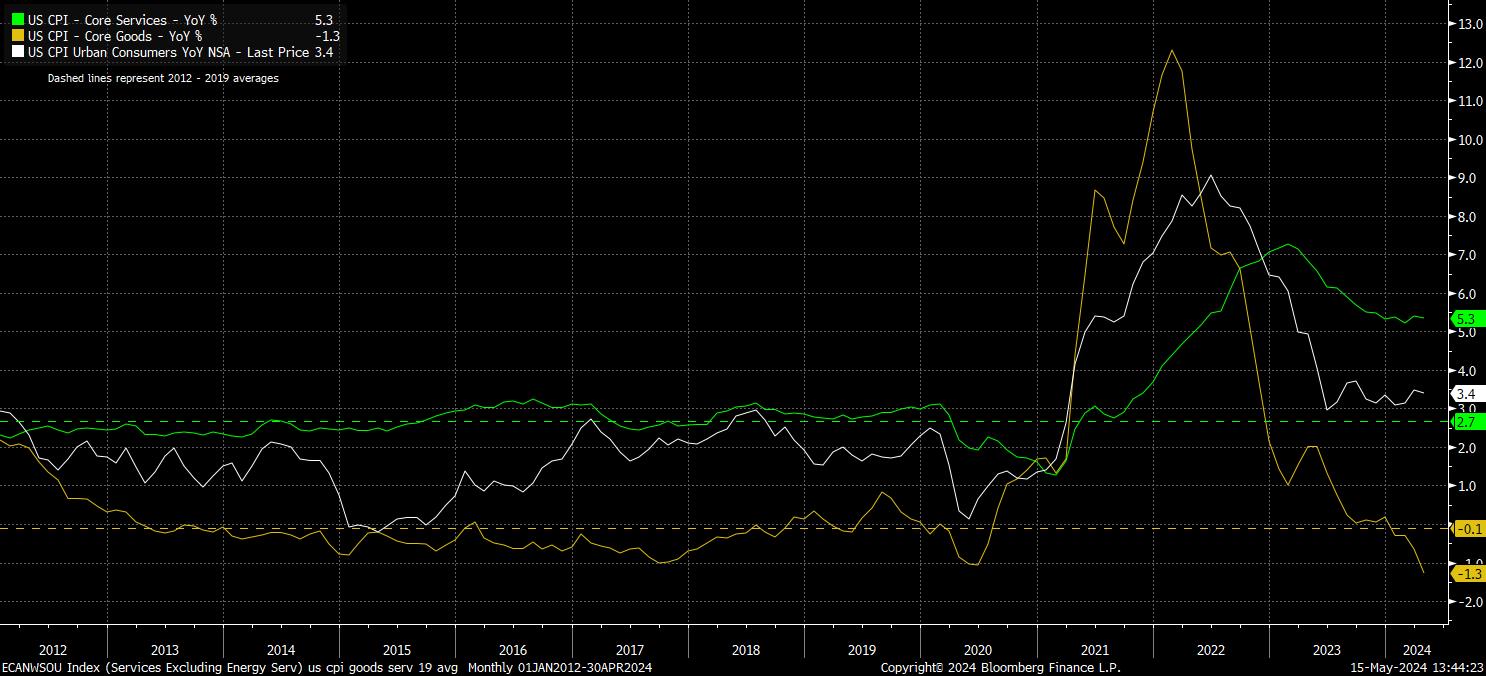
Digging somewhat deeper into the inflation figures, on an MoM basis, it was again goods prices which drove much of the cooling in price pressures, though food prices remaining flat on an MoM basis also provided a disinflationary impulse.
On this note, however, it will likely please policymakers to have seen core services inflation tick 0.1pp lower to 5.3% YoY last month, though the quickening pace of core goods deflation remains the primary driver of progress back towards the 2% target. Continued disinflation in services prices, hence, remains the key for further progress back to target, and thus ultimately unlocking the door to the first Fed cut.
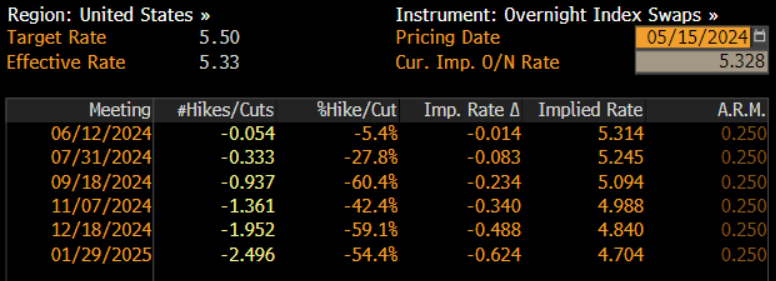
Speaking of which, the USD OIS curve repriced marginally in a dovish direction in the aftermath of the CPI report, with money markets now assigning a roughly 90% chance to a 25bp cut at the September meeting, compared to around 80% pre-release. Over the year as a whole, the curve now prices just under 50bp of cuts, broadly in line with where the updated dot plot, due at the June FOMC, should show the year-end median expectation.
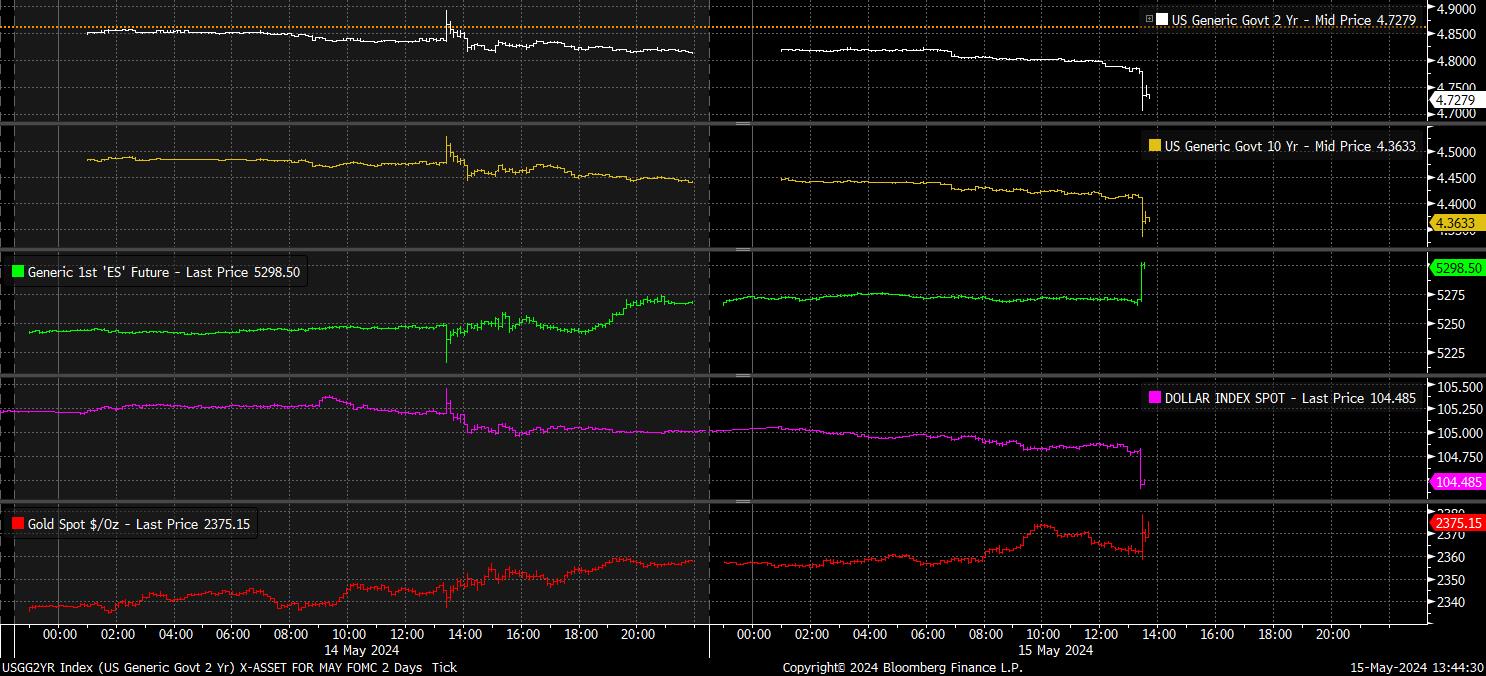
Elsewhere, markets experienced a knee-jerk dovish reaction as the data dropped, albeit one which was relatively contained, given three of the four metrics – besides the headline MoM figure – printing bang in line with consensus expectations.
Nevertheless, said reaction saw equities tear higher, with the front S&P future briefly trading north of 5,300, while Treasuries rallied as much as 8bp, led by the front-end of the curve. Falling Treasury yields pressured the dollar, which lost around 60 pips against most G10 peers, before rapidly paring around half of these declines, though gold failed to find too significant an immediate boost from the moves in the fixed income space.
Taking a step back from the aforementioned intraday noise, it is important to put some context around today’s figures.
Firstly, despite the April CPI report having a distinctly more optimistic bent to it than the three that came before, the near-term FOMC outlook remains unchanged – a rate cut in June simply isn’t going to happen, while the median dot is still likely to be hawkishly revised, showing an expectation for 50bp of cuts this year, compared to the 75bp foreseen at the March FOMC.
Secondly, there is the question of whether the data gives the FOMC “confidence” in inflation returning towards 2%. Here, the old adage that “one swallow doesn't make a summer” springs to mind. While the data will make a welcome change from the recent run of upside surprises, policymakers will want to see the data begin to trend lower, rather the over-reacting to a single print.
Hence, today’s data likely changes little in terms of the longer-run direction of travel for Fed policy, with the reaction function remaining as outlined by Chair Powell at the May press conference. Namely, that a rate cut is likely if the Committee obtain “greater confidence” in inflation falling sustainably towards 2%, or if an “unexpected” weakening occurs in the labour market. The third path, if disinflationary progress stalls, would see rates remain unchanged – aka ‘high for longer’.
Naturally, one therefore questions whether the April CPI report materially changes the cross-asset market outlook.
In short, it should not. As frequently noted in these pages, the ‘summer of easing’ is now upon us – the SNB and Riksbank have already cut, the BoE and ECB are highly likely to cut in June, while the FOMC appear somewhat desperate to join the policy normalisation club. As a result, liquidity is set to further improve as we move through the coming months, as policy support remains forceful. Furthermore, the central bank ‘put’ remains alive and well, with the Fed willing and able to cut as and when they need to.
This should continue to provide support to equities, with the path of least resistance continuing lead to the upside, while giving investors adequate confidence to remain further out on the risk curve, knowing that policymakers ‘have their backs’ once more. In addition, vol should remain relatively subdued, and conditions in the G10 FX space relatively rangebound, given the largely synchronised nature of the easing cycle upon which we will soon fully embark.
Related articles


The material provided here has not been prepared in accordance with legal requirements designed to promote the independence of investment research and as such is considered to be a marketing communication. Whilst it is not subject to any prohibition on dealing ahead of the dissemination of investment research we will not seek to take any advantage before providing it to our clients.
Pepperstone doesn’t represent that the material provided here is accurate, current or complete, and therefore shouldn’t be relied upon as such. The information, whether from a third party or not, isn’t to be considered as a recommendation; or an offer to buy or sell; or the solicitation of an offer to buy or sell any security, financial product or instrument; or to participate in any particular trading strategy. It does not take into account readers’ financial situation or investment objectives. We advise any readers of this content to seek their own advice. Without the approval of Pepperstone, reproduction or redistribution of this information isn’t permitted.