What is scalping in trading and how to apply it to your strategy?
Scalping in trading is a short-term strategy where traders aim to profit from small changes in price, often executing dozens or even hundreds of trades in a single day, holding positions for seconds to minutes.
Written by: Ioan Smith | Expert Financial Writer
What is scalping in trading?
Scalping traders hold positions for very short periods of time, ranging from a few seconds to a few minutes, and predominantly close all trades before the end of a trading session. This approach requires very quick decision-making, constant monitoring of markets, and a high tolerance for risk. The ultimate goal of scalping is to accumulate numerous small profits while minimising exposure to market risk. This strategy requires a disciplined approach and advanced trading tools to manage the fast pace of trading effectively.
How does scalping differ from other trading strategies like day trading or swing trading?
Scalping is about making many small profits over very short periods. Day Trading involves capitalising on intraday price movements and closing out all positions by the end of the trading session. Swing Trading focuses on capturing larger price movements over several days or weeks. Each strategy has its own risk profile, required skill set and time commitment. The trading style should be fitted around the market not around the trader.
What are the key characteristics of a good scalping strategy?
A good scalping strategy possesses several key characteristics to maximise profit and minimise risk in fast-paced trading environments. These characteristics include:
- High Liquidity - Scalpers need extremely liquid markets to enter and exit positions quickly without significant price slippage.
- Tight Spreads - Trading instruments with narrow bid-ask spreads ensure that transaction costs are minimised, which is crucial when aiming for small gains per trade.
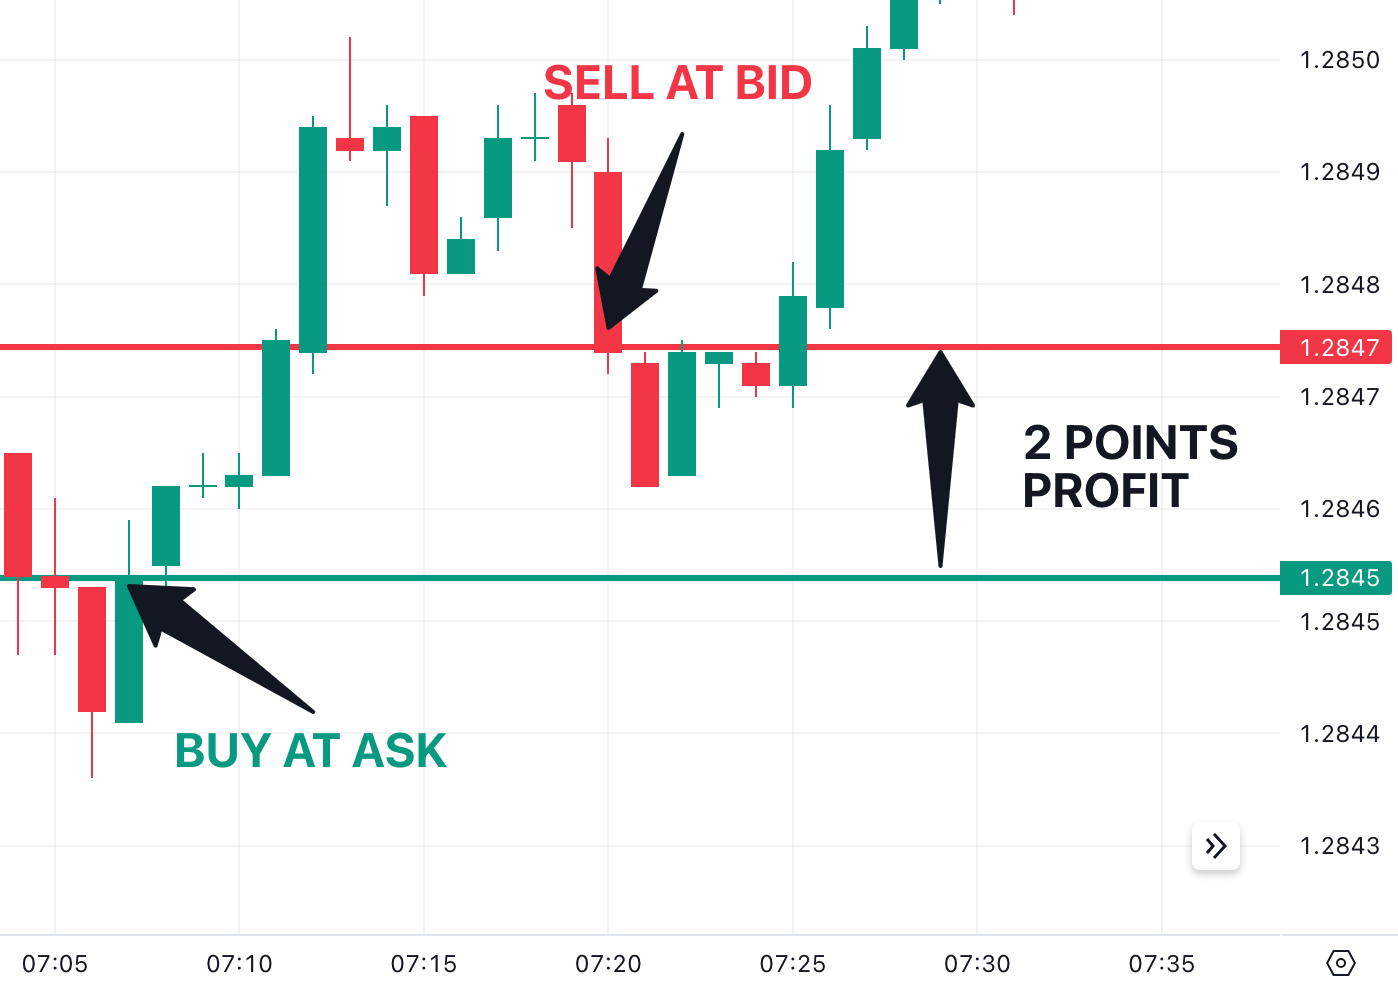
Source:TradingView
- Fast Execution - Scalping requires lightning-fast trade execution. Direct market access (DMA) and low-latency trading platforms such as Pepperstone's MT4, MT5 and cTrader platforms can significantly improve the chances of capturing small price movements.
- Effective Risk Management - Setting tight stop-loss orders is essential to limit potential losses. Scalpers have to be disciplined in adhering to scalping trading risk management rules to protect capital.
- Technical Analysis - Scalpers rely heavily on technical indicators such as moving averages, Bollinger Bands, and Relative Strength Index (RSI) to identify short-term price trends and entry/exit points.
- Consistency and Discipline - Scalping demands a consistent approach and strict adherence to a trading plan. Emotional control and discipline are vital to avoid impulsive decisions.
- Leverage - Using leverage can amplify profits from small price movements. However, it also increases risk, so it must be used judiciously.
- Market Knowledge - Understanding the market's behaviour and having a clear trading strategy based on that knowledge helps in making informed decisions quickly. Pepperstone provides comprehensive market coverage to help prepare for all major market moving events. Follow Pepperstone’s senior analysts Chris Weston (@ChrisWeston_PS) and Michael Brown (@MrMBrown) on X (Twitter) for insight into the various caveats to look out for in the releases.
By integrating these elements, traders can develop a robust scalping strategy to navigate the fast-paced trading environment effectively.
What time frames are most commonly used in scalping?
Scalping trading uses very short time frames to make quick decisions and execute trades. The most commonly used time frames on charts for scalping include:
- 15-Second: Not a common time frame but some highly experienced scalpers use very short time frames, to capture tiny price movements and make rapid decisions.
- 1-Minute: Arguably the most popular and most important among scalping traders. 1-minute charts allow traders to observe and react to rapid price movements and make frequent trades throughout the trading session.
- 5-Minute: Slightly less granular than 1-minute charts, but 5-minute charts still offer the quick feedback needed for scalping, allowing traders to track short-term price fluctuations and make rapid decisions.
- 1-Hour: While day traders primarily focus on shorter timeframes, the one-hour chart can provide valuable context. It helps traders identify key support and resistance levels and underlying market trends. By incorporating 1-hour charts into analysis, day traders can make more informed decisions about the overall market direction.
Some scalpers use tick charts. These charts show price movements based on a specific number of trades rather than time intervals. For example, a 100-tick chart will update with each 100 trades executed, offering a dynamic view of price action.

Source:TradingView
The choice of time frame often depends on the scalping traders’ personal preference, strategy, and the liquidity of the market being traded. Scalping traders need to have access to high-frequency, real-time data and execution platforms to succeed with these rapid trading strategies.
What technical indicators are most effective for scalping?
Combining the following indicators with solid risk management practices, such as using stop-loss orders, can help scalpers navigate the rapid pace of intraday trading effectively:
- Exponential Moving Average (EMA) - The EMA is favoured over a simple moving average in scalping due to its sensitivity to recent price changes. Traders often use shorter time frames, like the 5- or 9-period EMA, to identify trend direction and potential reversal points. The EMA crossover strategy involves using two exponential moving averages (EMAs) of different periods. A buy signal occurs when the shorter EMA crosses above the longer EMA, and a sell signal occurs when it crosses below.
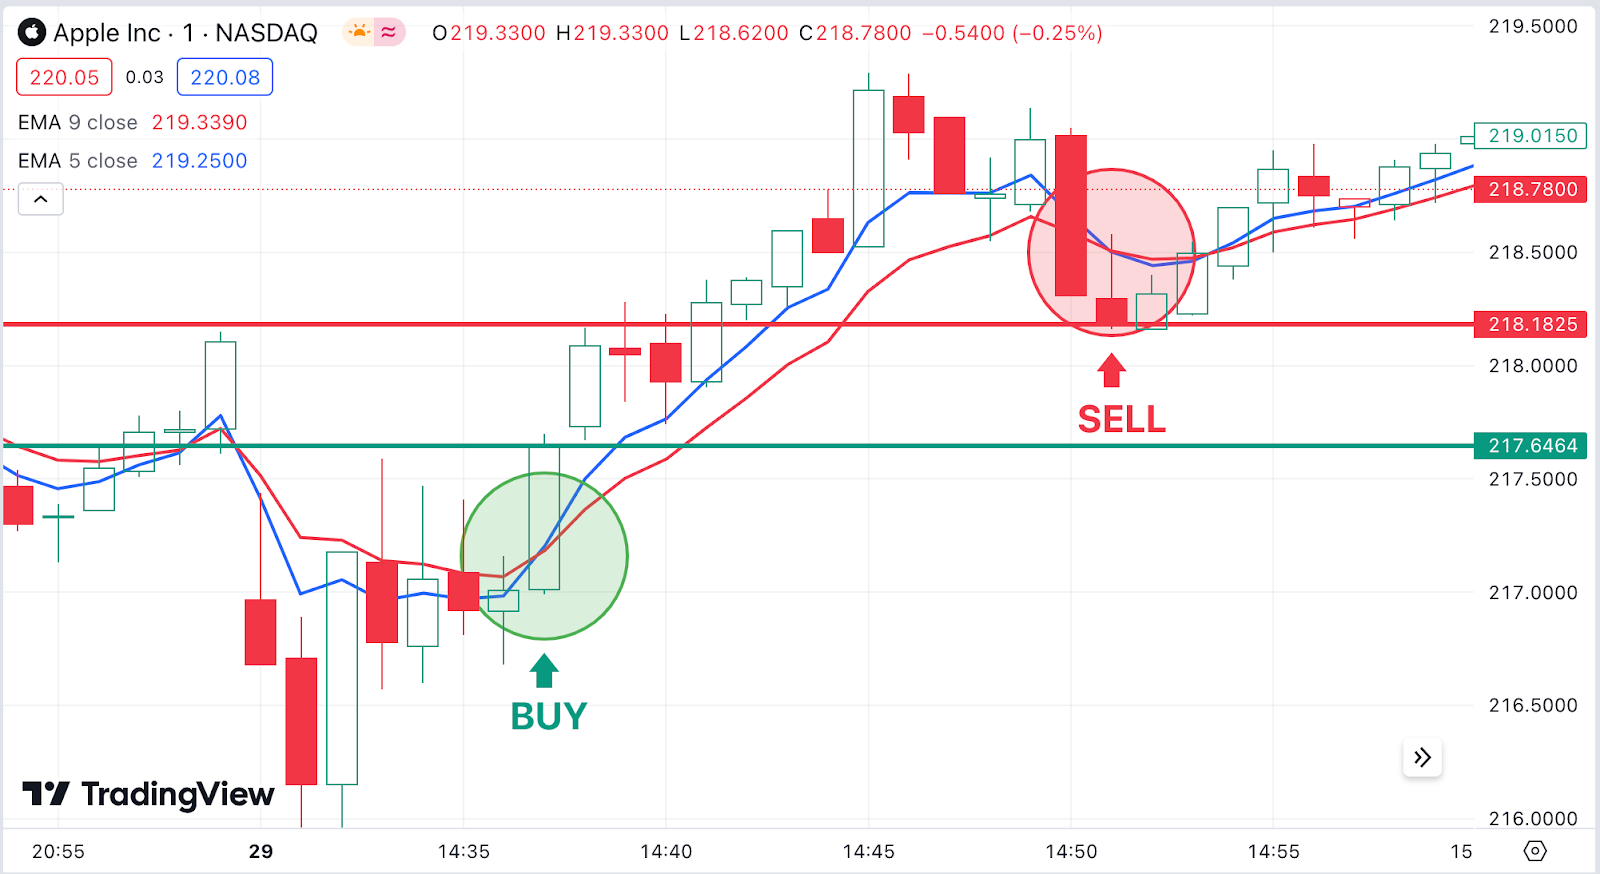
Source:TradingView
- Simple Moving Average (SMA) - The SMA is less responsive than the EMA, but used together can be useful in identifying overall trend direction and key support and resistance levels.
- Bollinger Bands - The bands consist of a moving average and two standard deviations above and below it (see chart below). They help scalpers identify overbought and oversold conditions, as well as volatility. Traders might look for price action to break the two standard deviation bands as potential signals to enter or exit trades.
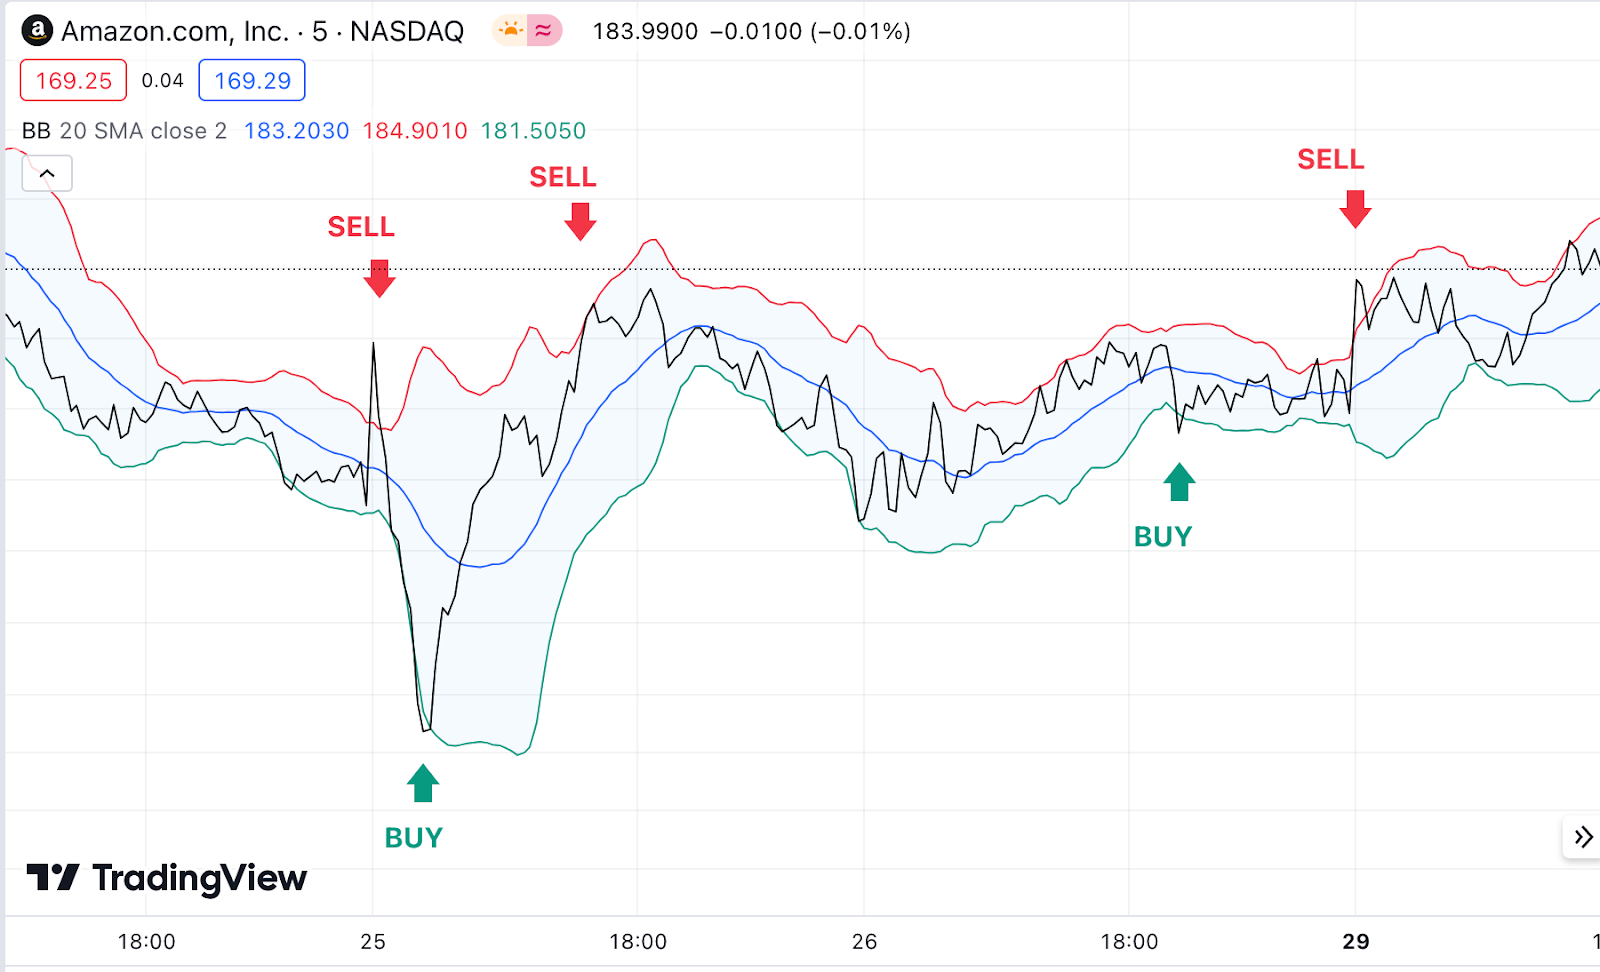
Source:TradingView
- Relative Strength Index (RSI) - The RSI measures the speed and change of price movements, ranging from 0 to 100. An RSI above 70 typically indicates overbought conditions, while below 30 indicates oversold conditions. In scalping, a shorter RSI period (e.g., 5 or 7) may be used to generate more frequent signals.
- Stochastic Oscillator - A momentum indicator that compares a particular closing price of a security to a range of its prices over a certain period. Values above 80 indicate overbought conditions, while values below 20 indicate oversold conditions. Scalpers use the Stochastic Oscillator to identify potential price reversals.
- Volume Indicators - Volume is a crucial factor in scalping, as it confirms price movements. Indicators like the On-Balance Volume (OBV) or Volume Weighted Average Price (VWAP) can help scalpers gauge the strength of a move and confirm the validity of breakouts or breakdowns.
- Moving Average Convergence Divergence - The MACD consists of two moving averages and a histogram, indicating the strength and direction of a trend. While typically used for longer time frames, shorter settings (like 6, 13, and 5) can be applied for scalping to signal potential buy or sell opportunities. See the chart below:
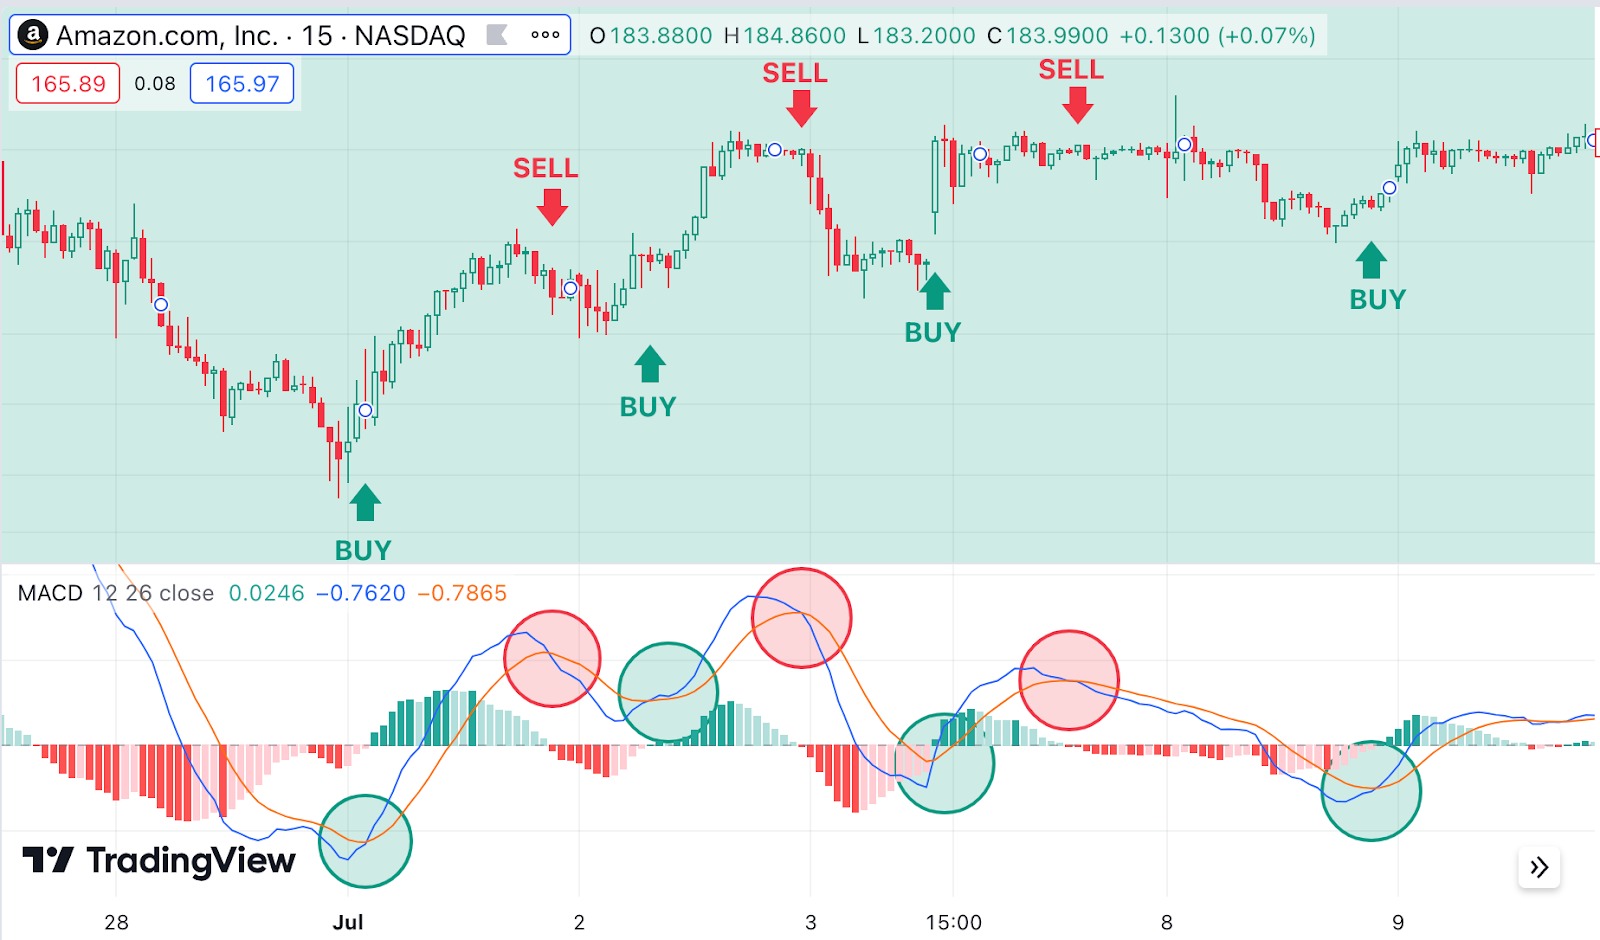
Source:TradingView
- Pivot Points - Pivot points are used to identify potential support and resistance levels based on the previous period's price action. Scalpers use these levels to determine entry and exit points, especially when combined with other indicators.
What is the best time of day to scalp the market?
The best time of day to scalp the market often depends on various factors, but primarily relies upon market liquidity and volatility. The specific trading strategy employed can also have a bearing on timing. Several general guidelines can help identify optimal times for scalping:
Market Open (First Hour After Market Open)
- Liquidity - The first hour after the market opens typically has high liquidity and volume, providing better opportunities for entering and exiting trades quickly.
- Volatility - Market open periods can be highly volatile as traders react to overnight news and economic reports, creating potential for small price movements that scalpers can exploit.
Market Close (Last Hour Before Market Close)
- Liquidity - Similar to the market open, the last hour of trading often experiences increased liquidity and volume, which can be advantageous for scalping.
- Volatility - The final hour can also be volatile as traders adjust positions before the market closes, potentially offering very short-term trading opportunities.
During Major Economic Releases or News Events
- Liquidity - Be aware of the scheduled release times. These are often in the morning for U.S. markets, or during market hours in Europe, and be prepared for rapid price changes. Websites like Trading Economics and Pepperstone provide comprehensive calendars combined with user-friendly charts to help prepare.
- Volatility - Scheduled economic reports (e.g., Non-Farm Payrolls, CPI) and major news events can create significant volatility. Scalping traders can take advantage of the price swings that occur during these times.
High- & Low-Volume Trading Sessions
- Liquidity - The overlap of major markets between major trading sessions, such as those in London and New York, tend to offer higher liquidity and volatility, beneficial trading conditions for scalping. In equities for example, the period between 10:30 AM and 3:00 PM (Eastern Time) can often be less volatile with lower trading volume.
- Volatility - Ultimately, the best time for scalping may vary based on the specific asset being traded and strategy. It’s essential to adapt trading approaches based on analysis of market conditions and the asset's behaviour during different times of the day.
How important is market volatility for a scalper?
Market volatility is critically important for scalpers for a number of reasons:
Opportunity for Price Movements
- Scalping Strategy: Higher volatility increases the likelihood of significant price swings, which can create more opportunities for scalping trades.
- Profit Margins: With higher volatility, price fluctuations become more pronounced, allowing scalpers to capitalise on even small moves.
Increased Liquidity
- Trading Volume: Volatile markets often attract more traders and investors, increasing overall market liquidity. High liquidity ensures that trades can be executed quickly and at desired prices, which is crucial for scalping where speed is essential.
- Tighter Spreads: In volatile markets with high liquidity, bid-ask spreads are often narrower, reducing the cost of trading and making it easier for scalpers to enter and exit positions profitably.
Enhanced Trading Opportunities
- Frequent Signals: Higher volatility can lead to more frequent trading signals and opportunities. Scalpers can benefit from the increased number of trade setups and price movements that occur in volatile conditions.
- Quick Reversals: Volatile markets are more prone to rapid price reversals, which can provide scalpers with multiple opportunities to make trades as the market oscillates.
Strategy Adaptation
- Volatility-Based Strategies: Some scalping strategies are specifically designed to exploit high volatility, such as trading breakouts or using volatility indicators to gauge potential price movements.
- Market Conditions: Scalpers often adjust their strategies based on current volatility levels. In highly volatile markets, they may trade more aggressively, while in low-volatility conditions, they might scale back or avoid trading.
Overall, understanding and adapting to market volatility is a key aspect that can contribute towards a successful scalping strategy. Scalpers must be skilled in reading market conditions and adjusting strategies to make the most of the opportunities presented by volatility while managing associated risks.
What types of markets or instruments are best for scalping?
High liquidity, tight spreads, and sufficient volatility in chosen market or instrument are required to maximise the effectiveness of any scalping strategy. Understanding the characteristics of different markets and instruments will help in selecting the best ones for the desired scalping strategy and help adapt the approach.
Forex
- Liquidity: The forex market is the largest and most liquid financial market globally. Major currency pairs like EURUSD, GBPUSD, and USDJPY offer high liquidity, making it easier to enter and exit trades quickly.
- Spreads: Major forex pairs often have tight bid-ask spreads, which minimises the cost of trading and is advantageous for scalping.
- Volatility: Forex markets can experience significant volatility, particularly during the overlap of major trading sessions (e.g., London and New York).
Stocks
- Liquidity: Stocks of large, well-established companies (blue-chip stocks) with high trading volumes are ideal for scalping due to their liquidity and tighter spreads.
- Active Stocks: Stocks that are heavily traded or have frequent news releases can provide the volatility needed for scalping. Consider choosing from a group of well known large-cap stocks like the FAANG stocks (Facebook, Amazon, Apple, Netflix and Google [Alphabet]). These stocks trade with extremely high liquidity, meaning there are plenty of buy and sell orders available over very short timeframes, and makes it more cost effective to buy and sell quickly.
How can I develop a consistent scalping routine or trading plan?
Developing a consistent scalping routine or trading plan involves creating a structured approach to trading that aligns with predetermined goals, risk tolerance, and market conditions. One way to consider improving trading is to focus on execution NOT the money or profit.
Step-by-step guide to establishing an effective scalping routine/strategy:
Define Objectives and Goals
- Profit Targets: Set realistic profit targets and daily goals. For example, target a specific percentage return on trading capital or a certain number of profitable trades per day.
- Risk Tolerance: Determine how much risk to take on a per trade basis and in total. Define acceptable loss per trade and daily loss limits. For example, never risk more than 1% of total trading capital on any single trade and stop trading completely if losses amount to 5% or more in any single trading day.
Carefully Select Markets and Instruments
- Market Selection: Decide which markets or instruments to focus on (e.g., forex, stocks). Ensure they align with predetermined trading strategies and offer high liquidity and volatility.
Develop a Scalping Strategy
- Technical Indicators: Select technical indicators that suit the scalping style adopted. Use common indicators like moving averages, RSI, Bollinger Bands, and MACD to identify entry and exit points.
- Entry and Exit Criteria: Define clear rules for entering and exiting trades. For example, enter when a short-term moving average crosses above a longer-term moving average and exit when the price reaches a predefined target or stop-loss level.
- Trade Duration: Specify the average duration of your trades. Scalping typically involves holding positions for seconds to minutes, so your strategy should be tailored to this time frame.
Create a Trading Routine
- Pre-Market Preparation: Review market news, economic calendars, and any relevant events that could impact trades. Analyse pre-market data to set up for the trading day.
- Trading Hours: Determine the best times to trade based on market liquidity and volatility. For example, focus on the first and last hours of the trading day or during major news releases.
- Post-Market Review: After the trading day, review all trades, analyse performance, and assess whether goals were met. Document any mistakes and successes to refine strategy.
Risk Management
- Position Sizing: Use appropriate position sizes based on risk tolerance and the distance to stop-losses. This helps in managing risk and protect capital.
- Stop-Loss and Take-Profit: Always use stop-loss orders to limit potential losses and take-profit orders to secure potential gains. Adjust these levels based on market conditions and volatility.
- Daily Loss Limits: Set a maximum loss limit for the day. If the limit is hit, stop trading for the day to avoid emotional decision-making and further losses.
Use a Trading Journal
- Record Keeping: A trading journal to document each trade should be maintained, including entry and exit points, trade size, and the reasoning behind each decision.
- Performance Analysis: Trading journals need to be reviewed regularly to identify patterns, assess the effectiveness of adopted strategy, and make necessary adjustments.
Maintain Discipline and Focus
- Stick to the Plan: Follow a trading plan and avoid deviating based on emotions or impulsive decisions.
- Avoid Overtrading: Trade only when criteria is met and excessive trading should be avoided, which can lead to increased costs and potential losses.
By following these steps, a consistent scalping routine can be built that helps manage risk and optimise performance.
What psychological factors should I be aware of while scalping?
Scalping, due to its fast-paced and high-frequency nature, can place significant psychological demands on traders. Understanding and managing these psychological factors is crucial for maintaining discipline, making sound decisions, and avoiding costly mistakes. Here are some key psychological factors to be aware of while scalping:
Stress and Pressure
- High-Stress Environment: Scalping requires quick decision-making and constant monitoring of markets, which can be highly stressful. The pressure to perform well in such a fast-paced environment can affect judgement and lead to impulsive decisions.
- Stress Management: Implement stress-reducing techniques, such as taking breaks and maintaining a balanced lifestyle to manage stress effectively.
Emotional Control
- Fear and Greed: Fear of losses and greed for profits can lead to poor decision-making. Fear might cause trade to be exited prematurely or even avoided completely, while greed can lead to overtrading or holding onto positions too long.
- Emotional Discipline: Develop and adhere to a trading plan that helps decision making based upon logic as opposed to emotion. Use pre-defined entry and exit criteria to avoid impulsive actions.
Decision Fatigue
- Cognitive Load: The constant need to make rapid decisions can lead to cognitive overload and decision fatigue, where the ability to make sound judgments significantly deteriorates over time.
- Routine and Rest: Establish a structured trading routine and take regular breaks to avoid fatigue.
What are some common mistakes that scalpers make and how can I avoid them?
Scalping involves making numerous trades over a short period, which can lead to several common mistakes.
Overtrading
- Mistake - Making too many trades in a short period, often driven by the desire to catch every small price movement or to recover from losses.
- Avoidance - Stick to a well-defined trading plan with specific entry and exit criteria. Only take trades that meet original setup requirements.
Ignoring Risk Management
- Mistake - Not using stop-loss orders or failing to adhere to risk management rules, leading to significant losses on individual trades.
- Avoidance - ALWAYS set stop-loss orders to limit potential losses. Define risk per trade as a percentage of trading capital and use position sizing to manage risk effectively.
Lack of Discipline
- Mistake - Deviating from the trading plan due to emotions such as fear, greed, or frustration. This can lead to inconsistent results and increased risk.
- Avoidance - Develop and adhere to a trading plan that includes clear rules for entry, exit, and risk management. Maintain emotional control and stick to the plan, even when facing losses or seeing potential opportunities.
Poor Execution
- Mistake - Delays in trade execution or errors in order placement, which can result in slippage or missed opportunities.
- Avoidance - Use a reliable and fast trading platform with low latency. Ensure familiarity with the platform’s features and order types. Consider using limit orders to avoid slippage in highly volatile conditions.
Neglecting Market Conditions
- Mistake: Trading without considering current market conditions, such as liquidity, volatility, or news events, leading to unfavourable trade outcomes.
- Avoidance - Stay informed about market conditions and economic events that can impact volatility and liquidity. Adjust your trading strategy based on the current market environment and avoid trading during low-liquidity periods.
Inadequate Preparation
- Mistake - Failing to conduct proper research or prepare before trading, which can result in poor decision-making and missed opportunities.
- Avoidance - Perform pre-market analysis to identify potential trade setups and review relevant news or economic data. Have a clear plan for the trading day and be prepared for different market scenarios.
Emotional Trading
- Mistake - Making trades based on emotions rather than a disciplined approach. This can lead to impulsive decisions and significant losses.
- Avoidance - Implement a strict trading plan and follow it regardless of emotions. Use techniques to manage stress and maintain focus, such as taking breaks and practicing mindfulness.
Ignoring Transaction Costs
- Mistake - Failing to account for transaction costs, such as commissions and spreads, which can eat into profits and impact overall performance.
- Avoidance - Be aware of broker fee structures and consider it when calculating potential profits. Choose a broker with competitive fees and ensure the trading strategy accounts for transaction costs.
Lack of Adaptability
- Mistake - Sticking rigidly to a strategy that may not be effective in changing market conditions or failing to adapt to new information.
- Avoidance - Regularly review and adjust the trading strategy based on performance and changing market conditions. Be flexible and willing to modify the approach as required.
Overconfidence
- Mistake - Becoming overconfident after a series of successful trades, leading to increased risk-taking and potential losses.
- Avoidance - Remain humble and stick to the trading plan. Continuously review performance and avoid letting past successes influence the decision-making process.
How do I evaluate the performance of my scalping strategy?
Evaluating the performance of any scalping strategy is essential for identifying strengths, weaknesses, and areas for improvement. A comprehensive approach to assess and refine any scalping strategy should include:
Key Metrics Tracking
Win Rate: Calculate the percentage of winning trades compared to the total number of trades. A higher win rate mostly indicates a more successful strategy, but it should be evaluated in conjunction with other metrics. If a trader manages risk well and limits losses on losing trades, even a 40% win rate can still lead to profitability.
Win Rate = Number of winning trades / (Number of winning traders + Number of losing traders) x 100%
Profit Factor: Measure the ratio of gross profit to gross loss. A profit factor greater than 1 indicates that the strategy is profitable. For scalping, a profit factor of 1.5 or higher is often desirable. There is a grading system (table below) for the profit factor to help traders assess the performance of their trades. It can be easy to assume trades are doing well when making substantial profits from a single trade but multiple losses from other trades.
Profit Factor = (Gross Profit) / (Gross Loss
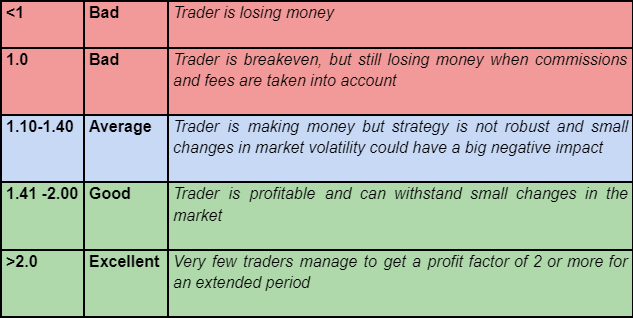
Average Gain vs. Average Loss: Compare the average profit from winning trades to the average loss from losing trades. Ensure that average gain is greater than average loss to achieve overall profitability.
- Average Gain = (Total profit from all winners) / (Number of winning trades)
- Average Loss = (Total loss from all losers) / (Number of losing trades)
Risk-Reward Ratio: Assess the ratio of potential reward to potential risk. Scalpers typically aim for a risk-reward ratio of at least 1:1 or better, meaning that the potential reward should be equal to or exceed the risk taken. Most traders’ ideal risk-reward is 1:3 as it has a high return ratio but not very risky. The ratio means that there is $3 profit for every $1 committed to a trade. Normally the higher the risk/reward ratio the lower the win ratio and vice versa. For example, scalpers will generally use a risk-reward ratio of 1:0.5 but have a win ratio of 80% or more, while swing traders might have a risk-reward ratio of 1:3 but a win ratio of 35%. The risk-reward should always be used in conjunction with the win rate.
| Risk/Reward | Win Rate % Required |
| 1:10 | 9% |
| 1:5 | 17% |
| 1:4 | 20% |
| 1:3 | 25% |
| 1:2 | 33% |
| 1:1 | 50% |
| 1:0.5 | 67% |
| 1:0.3 | 75% |
Maximum Drawdown: Measure the largest peak-to-trough decline in the trading equity. A smaller maximum drawdown indicates better risk management and stability.
Maximum Drawdown = (Capital Peak High-Capital Trough Low)/ Capital Peak High
Trade Execution Analysis
- Slippage: Monitor the difference between expected entry/exit prices and the actual prices achieved.
- Execution Speed: Delays in execution can impact the ability to take advantage of small price movements.
- Transaction Costs: Commissions, spreads, and other trading fees all need to be accounted for.
Trading Journal Reviews
- Trade Journal: A detailed trade journal recording each trade, including entry and exit points, trade size, rationale, and outcomes is required to be maintained. Journal regularly to identify patterns and areas for improvement. Keep a paper or free online trading journal such as TradeBench.
- Post-Trade Analysis: Analyse individual trades to understand what worked and what didn’t. Look for common factors in winning and losing trades to refine strategy.
Evaluate Consistency
- Performance Over Time: Assess strategy performance over various time frames (e.g., daily, weekly, monthly). Ensure that it performs consistently rather than showing erratic results.
- Adaptability: Evaluate how well the strategy adapts to different market conditions. A robust scalping strategy should perform well under various levels of volatility and liquidity.
Psychological Impact Assessment
- Emotional Response: Reflect on how the strategy affects emotions and decision-making. A strategy that causes significant stress or leads to impulsive decisions may need adjustment.
- Adherence to Plan: Deviations from a plan can lead to inconsistent results and performance issues.
Backtesting and Forward Testing
- Backtesting: Test strategy using historical data to see how it would have performed in the past. Ensure that the backtesting period is long enough to provide a meaningful analysis.
- Forward Testing: Implement strategy in a simulated or small-scale live trading environment to test its performance in real-time conditions. This helps validate the strategy’s effectiveness before scaling up.
Performance Benchmarking
- Compare to Benchmarks: Compare strategy performance to relevant benchmarks, such as market indices or other trading strategies. This helps assess whether your strategy is performing well relative to alternative approaches.
- Peer Comparison: Evaluate your performance against other scalpers or traders with similar strategies. This can provide insights into how well your approach stacks up in comparison.
By systematically evaluating these aspects, strengths and weaknesses in scalping strategy can be identified and make informed adjustments to enhance trading performance.
Scalping trading FAQs
How do transaction costs and fees impact scalping profitability?
Transaction costs and fees impact scalping profitability by reducing net gains from frequent trades. High costs erode small profits, making it crucial for scalpers to choose low-cost brokers and factor these expenses into their trading strategy to ensure overall profitability.
Is it necessary to use automated trading systems or bots for scalping?
Using automated trading systems or bots for scalping can enhance both speed and efficiency which are crucial for executing multiple trades quickly. While not necessary, they can significantly improve performance by minimising human error and optimising trade execution in high-frequency environments.
How much capital is needed to start scalping?
The capital needed to start scalping depends on the market and trading style, but typically, a minimum of $5,000-10,000 is normally recommended. This amount can help absorb transaction costs, manage risk, and ensure sufficient margin for frequent trades. Higher capital provides better flexibility and risk management.
What resources or tools are essential for a successful scalper?
Essential resources for a successful scalper include a reliable trading platform with low latency, real-time market data, advanced charting tools, and fast execution capabilities. Additionally, access to economic news, technical analysis indicators, and a stable internet connection are crucial for making timely, informed trading decisions.
Can scalping be profitable in both trending and ranging markets?
Yes, but the approach differs:
- Trending Markets: Scalpers can profit by capturing small price movements within the trend, focusing on momentum and trend-following indicators.
- Ranging Markets: Scalpers capitalise on price fluctuations between support and resistance levels, using strategies like mean reversion or range-bound indicators.
Success in either market requires adapting strategies to match market conditions and effective risk management.
What is the significance of bid-ask spreads in scalping?
Bid-ask spreads are crucial in scalping because they directly impact profitability.
- A narrow spread minimises the cost of entering and exiting trades, which is essential for capturing small price movements typical in scalping.
- Wide spreads can erode profits by increasing trading costs, making it harder to achieve consistent gains. Therefore, scalpers prefer markets or instruments with tight spreads to maximise their potential returns and enhance overall efficiency.
The material provided here has not been prepared in accordance with legal requirements designed to promote the independence of investment research and as such is considered to be a marketing communication. Whilst it is not subject to any prohibition on dealing ahead of the dissemination of investment research we will not seek to take any advantage before providing it to our clients.
Pepperstone doesn’t represent that the material provided here is accurate, current or complete, and therefore shouldn’t be relied upon as such. The information, whether from a third party or not, isn’t to be considered as a recommendation; or an offer to buy or sell; or the solicitation of an offer to buy or sell any security, financial product or instrument; or to participate in any particular trading strategy. It does not take into account readers’ financial situation or investment objectives. We advise any readers of this content to seek their own advice. Without the approval of Pepperstone, reproduction or redistribution of this information isn’t permitted.