Trend lines
Trend refers to the direction of travel in an instrument's price over a specific period. These trends are often highlighted on a chart through the use of trend lines which join two or more price points together under a straight line.
Trend lines can be used to identify support and resistance levels or possible turning points in price action, as well as to highlight potential entry and exit points for a trade.
Types of trends
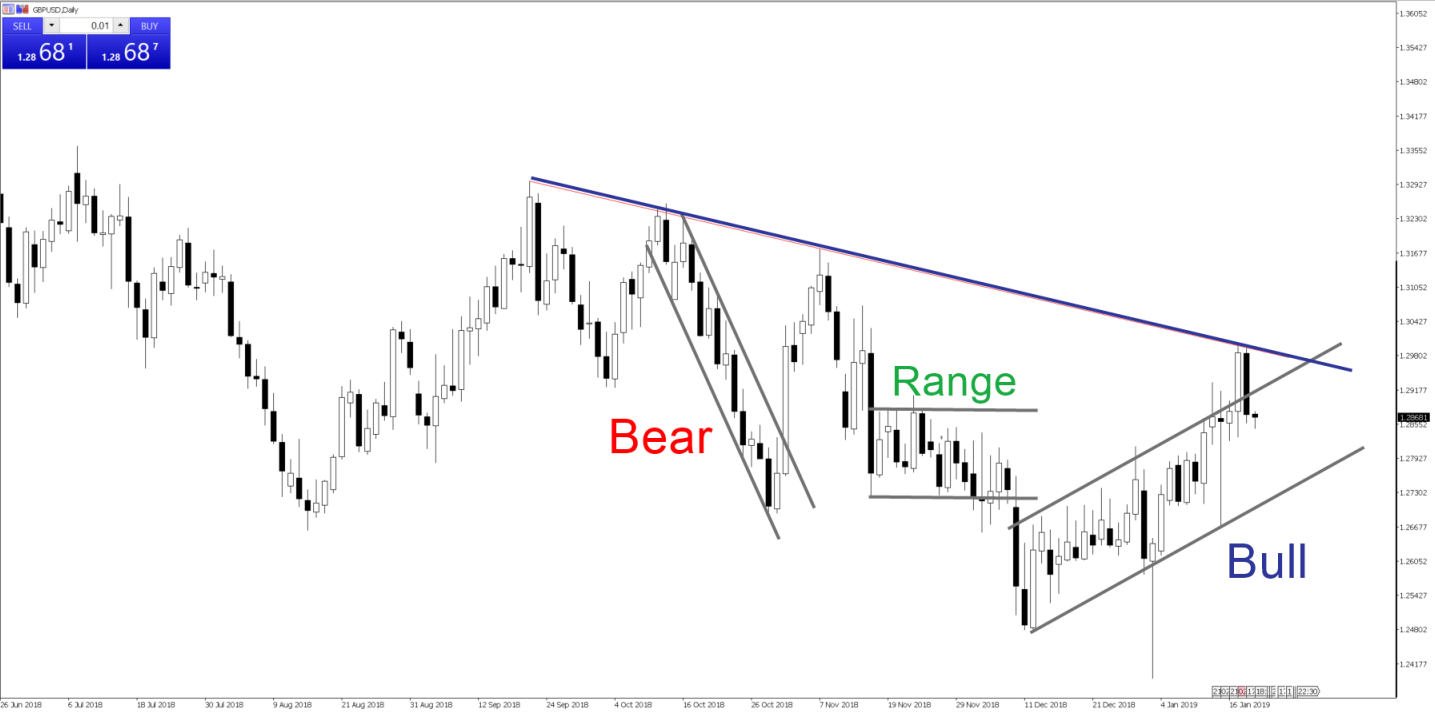
Bull or Uptrend
Uptrends are comprised of a series of consecutive higher highs and higher lows within price action under which the price is trending higher. A consistent and stable uptrend is seen as being bullish and a buying opportunity.
Bear or Downtrend
Downtrends are made up of a series of lower highs and lower lows during which the price of the instrument trends lower. Sustained downtrends are seen as being bearish for the underlying price and are considered to be selling opportunities.
Ranging or Flat
When a market isn't trending higher or lower it's said to be flat or range bound.
In these periods neither the bulls or the bears have control of the underlying price, and the market moves sideways until one of these groups becomes dominant once more.
Here are some examples of these trends in the candlestick chart below:
It’s often said that the trend is your friend and there is a lot of truth in that statement. Identifying the start and finish of a trend and being able to follow that trend to fruition can be a powerful trading tool for any trader.
Find out more about technical indicators and overlaying these on price chart data to forecast where the price could go.