How to trade gold
Gold is not only prized as a store of value, an industrial metal and a luxury item, but also for its unique financial characteristics, making it a key asset closely followed by traders worldwide.

An introduction to gold trading
At its core, gold trading involves buying and selling based on price fluctuations to capture potential profits. It does not necessarily involve the physical delivery of gold, but is expressed through financial instruments such as gold futures, ETFs, equities, and derivative products like CFDs (contracts for difference) and options, which enable you to take positions based on price movements.
You can go long (attempting to profit if gold rises from the entry point) or short (potentially profit if gold falls), while managing risk through position sizing, stop-losses and take-profit levels. In other words, the essence of gold trading lies in transforming your view of the market into actionable financial decisions.
Why is gold so widely followed by global traders?
This can be explained by likening an investment portfolio to a fleet of ships. Equities and other risk assets are the sails for long voyages, fixed-income instruments like bonds form the sturdy keel, and gold acts as the lifeboat. When the fleet encounters storms and market volatility rises, the value of the lifeboat becomes magnified. Analogies aside, gold has four core attributes that make it attractive to traders and investors:
1. Safe-haven demand: during geopolitical tensions, economic uncertainty or market panic, capital often flows into gold.
2. Inflation and debasement hedge: thanks to its inherent scarcity, gold helps preserve purchasing power against currency debasement.
3. Portfolio diversification: gold is widely employed for portfolio diversification due to its low correlation with equities and fixed-income assets. Incorporating gold can enhance risk-adjusted returns and serve as a hedge against systemic and currency-related risks.
4. High liquidity and global pricing: gold is traded globally, with a diverse participant base including institutional investors, central banks, retail traders and ETFs. Its long trading hours and strong liquidity make it easy to enter and exit positions, while quickly reflecting macroeconomic changes.
Looking at the period from 2015 to 2025, gold’s price history can be divided into three phases. First, from 2015–2019, before the pandemic, prices generally moved sideways with a mild upward trend. Then, from 2020–2023, following the outbreak of COVID-19, gold remained elevated and volatile, influenced by economic uncertainty and central bank policy adjustments. Since 2024, with loose liquidity, fiscal and monetary stimulus, persistent inflation concerns, and ongoing policy uncertainty, gold has entered a period of structural change, experiencing larger swings with a pronounced upward trend.
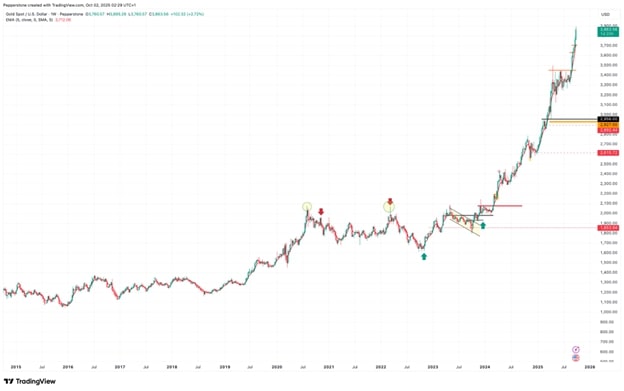
This history offers two key lessons. First, during periods of macroeconomic upheaval, gold’s safe-haven and value-storage attributes are amplified, making prices highly resilient. Second, gold is not guaranteed to rise continuously; it remains subject to volatility, meaning trading decisions should combine both macro insights and technical analysis.
Getting started and ways to trade gold
If you want to start trading gold, the first step is to choose the approach that best fits your strategy and trading style. The most common traditional methods include three main types:
1. Physical gold (bullion)
• Pros: provides direct ownership with no credit risk, making it well-suited for long-term holding.
• Cons: storage, security and insurance need to be considered, and the trading process lacks flexibility.
2. Gold futures
• Pros: highly liquid with transparent trading mechanisms, ideal for hedging and institutional operations.
• Cons: contracts have expiration dates, roll-over costs can be high and they may be complex for beginners.
3. Gold ETFs (eg, SPDR Gold Trust – GLD, Gold Miners ETF - GDX)
• Pros: easily traded through a standard brokerage account, closely tracks gold prices, cost-effective and suits long-term portfolio allocation.
• Cons: trading hours are restricted to the exchange schedule, and flexibility is lower than direct trading.
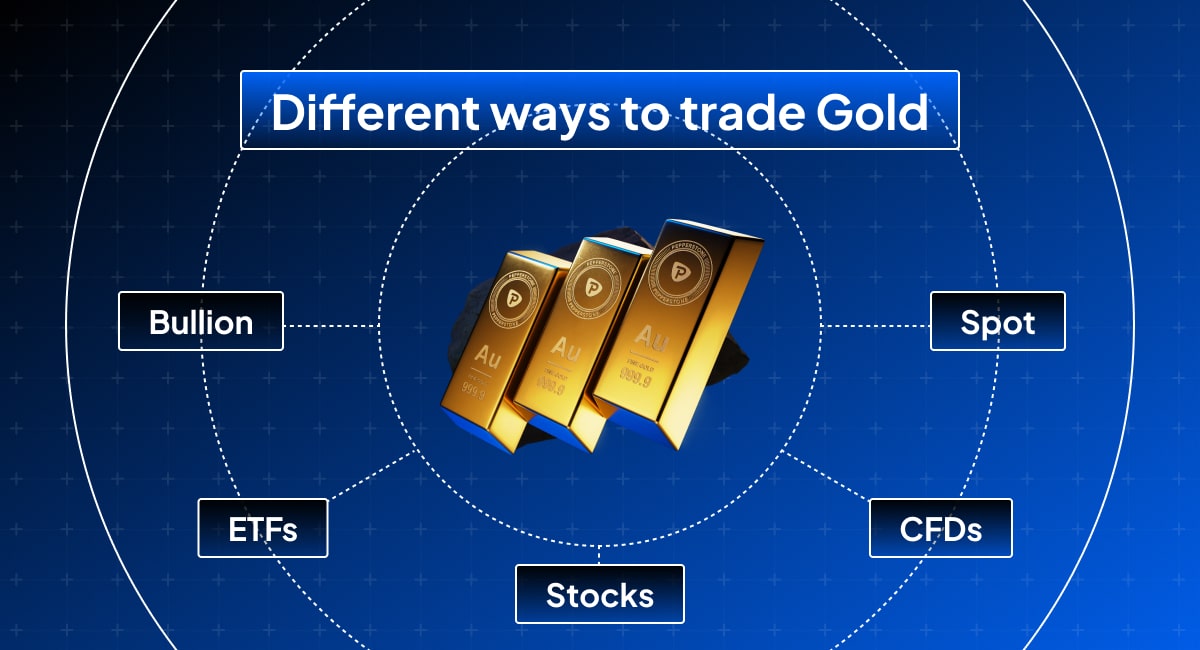
Compared to traditional methods, CFD (Contract for Difference) trading offers exceptional flexibility and operational efficiency. CFDs enable you to participate in gold price movements without holding physical gold. This reduces storage, security and delivery costs, while removing the constraints of fixed contract expiry (for retail CFDs), letting you adjust your positions according to your strategy.
Another key advantage of CFDs is two-way trading. This means you can go long to profit from rising prices or short to capture downward moves, which is particularly valuable if you’re a short-term or swing trader. CFDs also support leverage, enabling you to control larger positions with smaller capital, which significantly improves capital efficiency while requiring careful risk management.
- Pepperstone gold CFDs are available for nearly round-the-clock trading at low costs. This means that they can be used for a wide range of trading strategies, including trend-following (riding the direction of the trend), swing trading (buying near support and selling near resistance over several days), scalping (taking very short-term positions to profit from small price movements) and hedging strategies (protecting positions using other assets or options), etc.
This high level of flexibility and global accessibility makes gold one of Pepperstone’s most popular instruments, particularly favored by high-frequency traders.
Of course, leverage amplifies both profits and losses. Different brokers have varying spreads, overnight financing costs and margin requirements. Regardless of the strategy, effective risk management is critical. So, clearly define your risk tolerance before entering a trade, and strictly enforce position sizing and stop-loss rules to maintain a healthy risk-to-reward balance.
If you’re interested in getting started with gold CFDs, a typical entry process might look like this:
1. Open an account: choose a regulated and reliable broker like Pepperstone.
2. Fund the account and download a trading platform: deposit capital and choose a trading platform, such as MT4/MT5, cTrader or TradingView to access real-time gold CFD prices.
3. Practice with a demo account: get familiar with your platform and test your trading strategies in a risk-free environment.
4. Establish rules and trade live: once comfortable with your platform, create a clear trading plan and risk management rules before executing real trades.
In comparison to other global brokers, Pepperstone stands out for gold CFD trading because it:
1. Offers broad product coverage, including gold CFDs, other precious metals, ETFs and gold mining stock CFDs, which enables you to build diversified portfolios. In addition to USD pairs, gold CFDs are available against major G10 currencies like JPY and CHF, as well as emerging market currencies, giving you even more options.
2. Supports popular platforms like MT4, MT5, TradingView and cTrader for seamless trading and technical analysis integration.
3. Provides near-24-hour trading, low spreads, high liquidity, and negative balance protection, which gives you opportunities to enter positions across different market sessions, and makes short-term trading and risk management more effective.
4. Gives you access to built-in risk management tools, including stop-losses, trailing stops, and take-profit orders, which allow for precise and disciplined strategy execution, helping you protect your capital and lock in profits amid market volatility.
In summary, trading gold CFDs via Pepperstone combines the flexibility and efficiency of modern trading with robust risk management tools, enabling you to focus on strategy execution and opportunity capture.
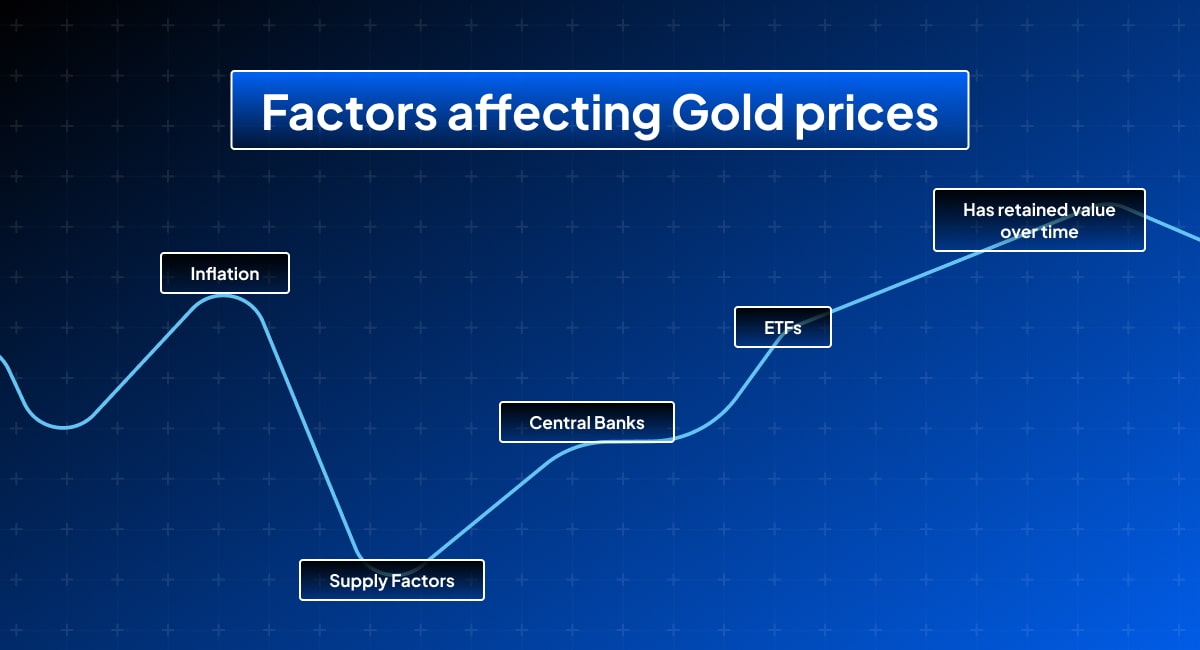
Key factors driving gold prices
Understanding the underlying drivers of any market is essential. Gold, with its unique combination of safe-haven appeal, inflation-hedging properties and store-of-value function, is influenced by a complex interplay of macroeconomic and market factors.
1. Interest rate environment
Interest rates are among the most important variables affecting gold. Central bank policies—especially those of the Federal Reserve—directly shape market pricing for gold.
• Hawkish signals or rate hikes raise the opportunity cost of holding gold, a non-yielding asset, which can suppress prices. Conversely, in a rate-cut cycle or when
central banks signal dovish intentions, capital often flows into gold and other 'yieldless but stable' assets.
• Real interest rates are equally critical. Calculated as nominal rates minus inflation (eg, inflation-adjusted Treasury yields), rising real rates reduce gold’s attractiveness, putting pressure on prices, while falling real rates enhance gold’s investment appeal and typically push prices higher.
2. The USD
Gold is priced in USD, so its performance is closely tied to the currency’s strength. A weaker dollar usually supports gold, while a stronger dollar exerts downward pressure.
3. Inflation expectations
Closely linked to interest rates, inflation expectations play a key role. If consumers and businesses anticipate rising future prices, gold’s role as a long-term store of purchasing power becomes more attractive.
4. Geopolitical risk and market sentiment
Short-term gold price swings are often driven by risk events. Sudden geopolitical conflicts, trade policy uncertainty, economic ambiguity or threats to central bank independence can prompt traders to increase gold holdings as a safe haven, pushing prices up.
5. Central bank and institutional demand
Over the longer term, purchases by central banks and major institutions reshape gold demand. With high US fiscal deficits and weakening dollar credibility, many emerging-market nations have been increasing gold reserves to reduce dollar dependence. This provides structural support for gold prices and highlights its strategic role in the global monetary system.
6. Portfolio diversification
Gold’s low correlation with traditional assets makes it a key diversification tool. At times, gold moves independently of stocks or the dollar, offering fund managers a way to smooth volatility and hedge risk.
7. Flow dynamics and market strategies
• Capital flows and trading strategies can amplify trends. Concentrated positioning by CTAs or momentum traders can extend existing gold trends.
• Cross-market flows can also create structural opportunities. For example, in early April 2025, markets anticipated a potential gold tariff from the Trump administration, leading to large preemptive moves from London to New York Exchange and a rapid gold price spike. This illustrates the role of expectation-driven trading and arbitrage.
Overall, gold prices reflect a combination of macro variables, policy expectations and market behavior. Therefore, if you’re seeking an edge, it’s important to understand these drivers and dynamically adjust your analysis framework, translating macro signals into actionable trading decisions.
To effectively monitor and quantify these signals, consider focusing on the following areas:
• Macroeconomic data and risk events
By using an economic calendar, you can track key releases from G10 and select emerging-market economies (eg, US Non-Farm Payrolls, CPI, etc.), as well as critical risk events (central bank rate decisions, tariff expirations, Jackson Hole symposiums, etc.) and public statements by central bank officials. Understanding consensus expectations, identifying market focal points and anticipating potential reactions can help you make timely gold price judgments. Pepperstone’s economic calendar provides convenient access to these data points.
• Interest rate curves and inflation expectations
Real interest rates are a core anchor for gold pricing, particularly long-term Treasury yields (10-year and above). A clear downward trend often signals higher probabilities for gold upside.You can use tools like TradingView to track US10Y – T10YIE for a direct view of real yields.
• Dollar and currency performance
Gold’s correlation with the USD Index (DXY) is significant. Beyond XAUUSD, Pepperstone offers pairs such as XAUEUR, XAUCHF, and XAUCNH, allowing you to leverage relative currency weakness to enhance returns.
• Central bank actions & balance sheets
Central bank policy is a primary driver of gold. You can monitor official Fed, ECB, and RBA websites for balance sheet updates and subscribe to notifications for FOMC rate decisions and minutes to stay ahead of policy shifts.
Trading gold with technical analysis
Once you have assessed the market’s dominant narrative and overall gold direction from a fundamental perspective, actionable trading still relies heavily on technical analysis. By interpreting price and volume information on charts, you can identify potential buy and sell signals. The following are some of the most commonly used foundational technical tools in gold trading. They can be applied across timeframes—from monthly charts down to 15-minute intervals—to better time entries, take-profits and stop-losses.
Support and resistance levels
Support levels represent areas where falling prices may find a floor, while resistance levels are where rising prices may face selling pressure. Observing historical price behavior is the most straightforward way to identify these critical levels: repeated lows often form support, while repeated highs form resistance. Psychological round numbers also naturally act as support or resistance.
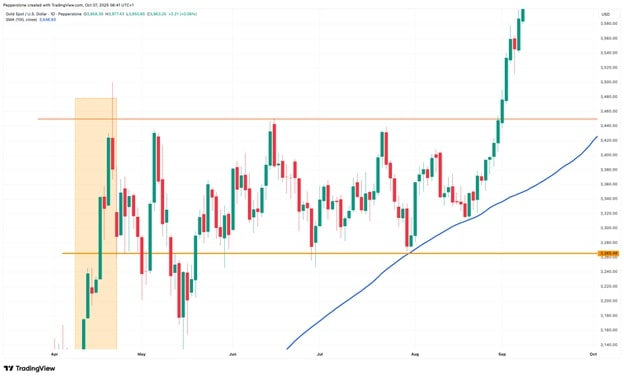
Some traders combine technical indicators to confirm these levels. Moving averages often provide dynamic support or resistance during trends, while Bollinger Bands can offer potential reversal cues. Using these dynamic indicators alongside historical and psychological levels can improve judgment accuracy.
Volume also serves as a valuable confirmation tool. If prices approach a support or resistance level with significantly increased volume, it suggests strong market conviction in that zone. Conversely, a breakout on low volume may indicate a false move prone to reversal.
When a price breaks above a previous resistance, that level often becomes new support, providing a floor during retracements; similarly, a broken support level can turn into resistance, limiting upward price corrections.
Trendlines and channels
Trendlines and price channels help you identify the market’s dominant direction, the rhythm of price movements and potential reversal or breakout signals.
A trendline is typically drawn by connecting two or more significant highs or lows. An upward trendline links progressively higher lows, representing persistent buying pressure, while a downward trendline connects lower highs, indicating dominant selling pressure. If gold repeatedly respects a trendline for support or resistance, it demonstrates broad market recognition and lends credibility to the line.
Traders often use two parallel trendlines to form a price channel, helping visualize price swings within a trend. The upper boundary serves as resistance, the lower as support. When gold trades within the channel, short-term traders may enter long positions near the lower boundary and take profits near the upper boundary. A breakout from the channel, especially on high volume, often signals trend acceleration or reversal.
_within_a_descending_channel_with_RSI_indicators_below.jpg)
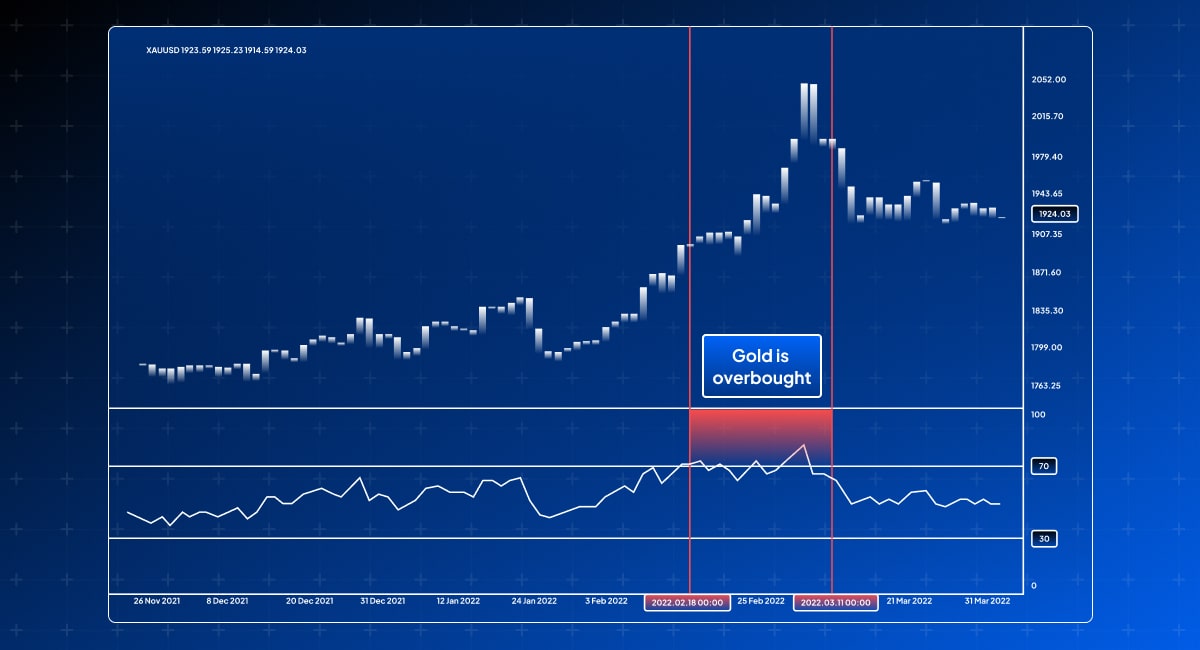
Oscillators like the 14-day RSI can complement trend analysis by highlighting overbought or oversold conditions. RSI above 70 indicates potential overbought conditions, suggesting upward momentum may weaken and a short-term pullback could occur. RSI below 30 indicates oversold conditions, hinting at a possible rebound. Combining RSI with trendlines, channels, and volume can provide a more comprehensive assessment of trend continuation or reversal probability.
Candlestick patterns
Candlestick formations are vital for identifying potential trend reversals or continuations. Single-candle patterns like'the hammer' or 'hanging man' often appear at trend extremes, signaling weakening selling or buying pressure. Multi-candle patterns, such as engulfing patterns, suggest a sudden shift in supply-demand balance.
Continuation patterns like three consecutive bullish/bearish candles or flags and rectangles-indicate momentum retention after short-term consolidation. To enhance reliability, you can combine candlestick patterns with support/resistance levels, trendlines, or volume. For example, a bullish engulfing pattern at support with strong volume suggests a higher probability of reversal, while continuation patterns reinforced by channel support increase the likelihood of trend persistence.
Fibonacci retracements and extensions
Fibonacci tools are widely used to identify potential support, resistance and target levels. Traders typically select a prominent trend swing, mark the high and low, and calculate retracement levels (eg, 38.2%, 61.8%). These levels often correspond to potential pullback or consolidation zones, aiding in entry and take-profit decisions.
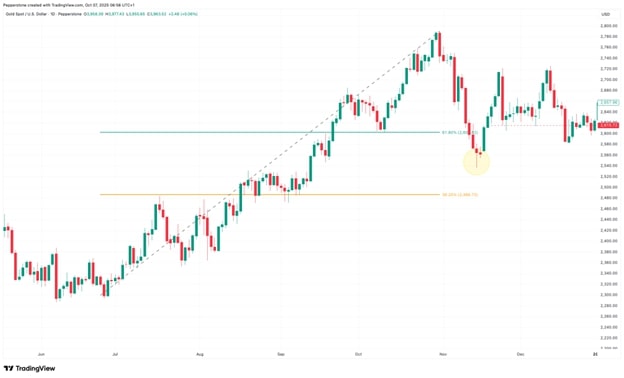
Fibonacci extensions, on the other hand, project possible trend continuation targets (eg, 161.8%, 261.8%) and can help you set profit objectives or gauge trend strength.
Breakouts vs. false breakouts
To distinguish real from false breakouts, you must first assess whether the price convincingly crosses a key technical level, such as a previous high or low. A true breakout typically closes beyond the level rather than merely touching it intraday.
Volume serves as an important confirmation. Genuine breakouts are often accompanied by a notable surge in volume, reflecting broad market participation. Low-volume breakouts are more likely to be false moves.
Subsequent price action is also telling. A real breakout often sees a retest of the new support (or resistance) level before continuing along the trend, whereas a false breakout quickly reverses.
Combining trendlines, channels or moving averages further aids in confirming breakout validity. For instance, a price exceeding a channel’s upper boundary or long-term moving average without volume support, then falling back inside the channel, is likely a false breakout.
In summary, technical analysis in gold trading transforms 'fuzzy intuition' into actionable rules, providing clear guidance for strategy implementation. As you gain experience, you’ll discover that technical tools extend far beyond these basics. Crucially, trading gold requires not only identifying profit opportunities but also defining strict stop-loss logic to manage risk.
It’s also important to note that, unlike equities, certain fundamental data—such as central bank gold purchases—are released with delays. Sole reliance on charts may not immediately capture all market information. Effective decisions come from combining technical analysis with fundamental insights to form a comprehensive trading framework.
Building a gold trading framework and how Pepperstone can support you
After integrating fundamental and technical factors that influence gold, you can create a comprehensive trading framework and establish a standardised preparation workflow, by including the following steps:
1. Macro assessment: begin by analyzing the current economic environment, monetary policy trends, inflation outlook and overall market sentiment. This clarifies the fundamental logic behind gold prices and sets the direction for subsequent operations.
2. Strategy selection: based on your macro assessment and market structure, choose the appropriate trading strategy—whether going long or short with the trend, or trading within a range using swing strategies.
3. Technical confirmation: identify key technical signals on the charts, such as trendline breaks, support/resistance reversals or specific candlestick patterns. Determine entry points, stop-loss levels and profit targets to ensure your decisions are backed by clear evidence.
4. Risk management: strictly enforce stop-losses and position sizing, while considering event risks or hedging with related assets to ensure potential losses remain within acceptable limits.
5. Post-trade review: record the rationale behind each trade, execution deviations, emotional influences, profits and losses, and improvement points to enhance future decision-making.
In essence, successful gold trading is not about predicting the market perfectly—it’s about turning your analysis into a repeatable, executable and risk-managed process. Sustainable trading boils down to three essentials: accurate probability assessment + clear technical confirmation + strict risk control.
Throughout this process, Pepperstone’s platforms and tools provide powerful support. You can trade gold CFDs on MT4/MT5, cTrader, TradingView or Pepperstone’s own platform, and leverage built-in technical indicators and charting tools for market analysis. Pepperstone also supports a variety of order types—such as limit orders, stop-loss orders, and trailing stops—and includes risk management features like margin alerts and negative balance protection, helping you control potential risks and execute strategies more confidently.
Ready to start your gold trading journey? Open an account with Pepperstone today!
The material provided here has not been prepared in accordance with legal requirements designed to promote the independence of investment research and as such is considered to be a marketing communication. Whilst it is not subject to any prohibition on dealing ahead of the dissemination of investment research we will not seek to take any advantage before providing it to our clients.
Pepperstone doesn’t represent that the material provided here is accurate, current or complete, and therefore shouldn’t be relied upon as such. The information, whether from a third party or not, isn’t to be considered as a recommendation; or an offer to buy or sell; or the solicitation of an offer to buy or sell any security, financial product or instrument; or to participate in any particular trading strategy. It does not take into account readers’ financial situation or investment objectives. We advise any readers of this content to seek their own advice. Without the approval of Pepperstone, reproduction or redistribution of this information isn’t permitted.