- English
- 简体中文
- 繁体中文
- ไทย
- Tiếng Việt
- Español
- Português
- لغة عربية
Bitcoin Breakout: Technical Signals and ETF Flows Put BTC Back on Traders’ Radar

Quick Summary
• Bitcoin surged 7.8% in one session, marking one of the largest daily gains in the past year
• Price broke above a multi-week consolidation range between $63,000 and $71,700
• Bitcoin Futures volumes jumped 50% above the 15-day average, confirming strong participation
• In the past 24 hours, there's been $575 million in liquidations across the exchanges, with roughly 85% coming from short positions
• Spot Bitcoin ETF inflows hit a year-to-date high, averaging $274 million over five days
• Bitcoin’s correlation with NASDAQ futures has risen to 81%, reinforcing its role as a high-beta risk asset
• Corporate treasury buyers now hold more than 1 million BTC collectively
After months of drawdown and reduced conviction among long traders since October, Bitcoin is beginning to show more constructive signals. The recent price action, combined with improving flows and strong derivatives activity, has traders asking a familiar question again: Is Bitcoin back?
It is still early to call a full trend reversal, but the combination of technical breakout, rising ETF inflows, and increased short liquidations suggests momentum may be building.
Bitcoin Technical Breakout Signals a Shift in Momentum
From a technical perspective, Bitcoin’s price structure has improved meaningfully.
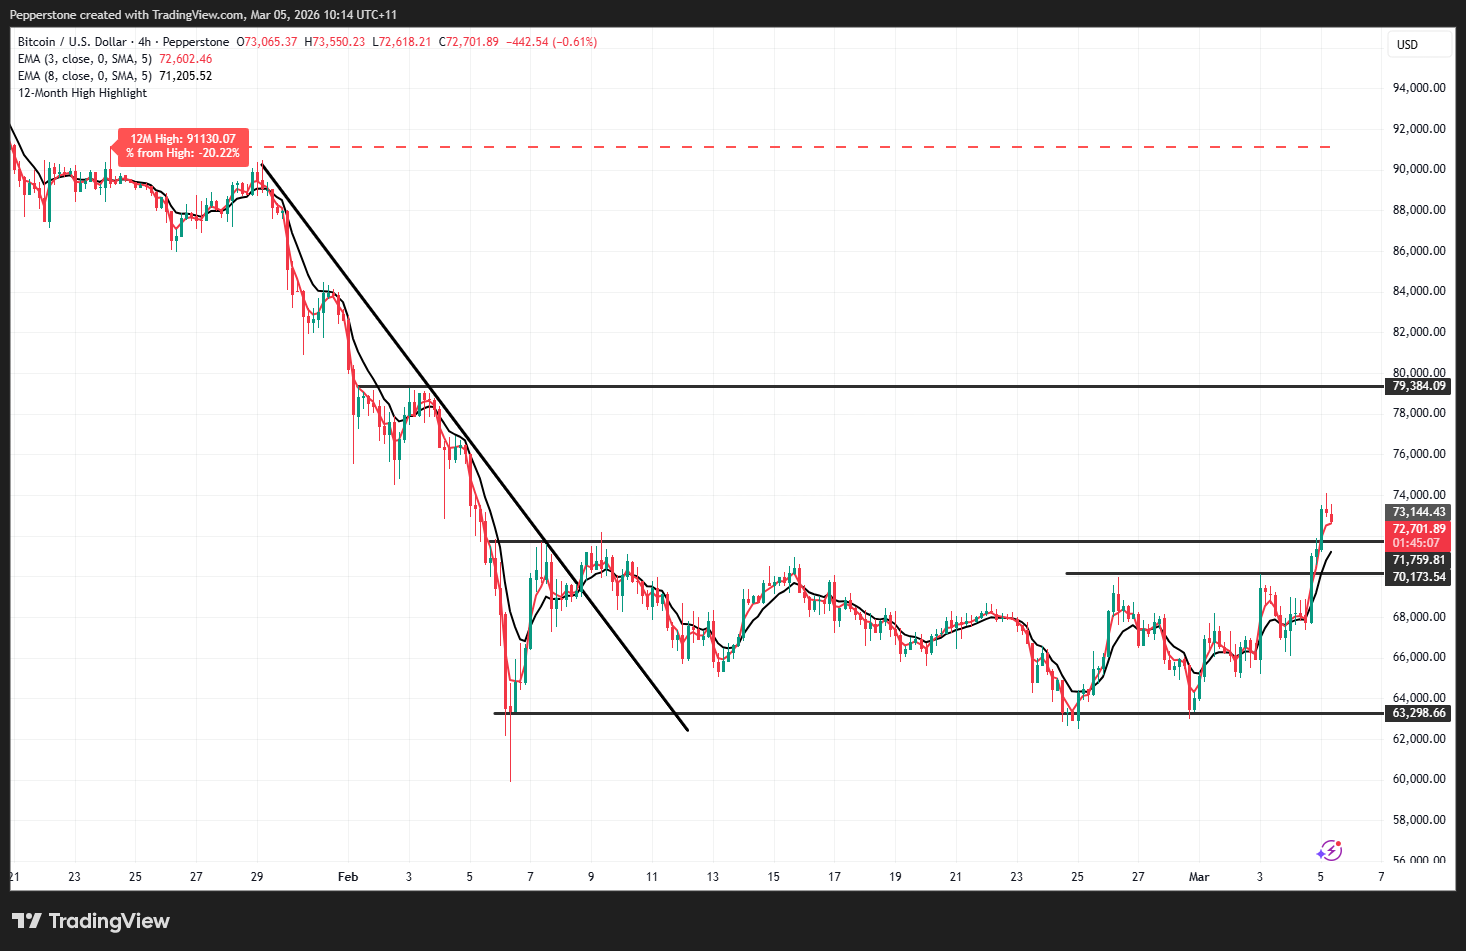
The market broke the January to February downtrend on 5 February, before entering a period of consolidation. Since early February, BTC had been trading within a defined range between $63,000 and $71,700.
On Wednesday, price finally broke above the upper end of that range, rallying 7.8% on the day. That move ranks as the fourth largest daily percentage gain over the past 12 months, signalling strong directional conviction.
Breakouts following extended consolidation periods often attract momentum traders. When ranges compress over time, the eventual break can produce powerful directional moves, particularly if supported by strong volume.
BTC Futures Volume Confirms Strong Participation
The breakout was supported by a notable surge in derivatives activity. Volumes in front-month Bitcoin futures traded roughly 50% above the 15-day average, indicating strong participation from traders reacting to the move. When price expansion is accompanied by higher-than-normal volume, it typically suggests genuine demand rather than a thin liquidity rally. For traders, this combination of range expansion and volume confirmation often strengthens the case for momentum continuation.
Short Liquidations Add Fuel to the Rally
Another key element behind the rally has been forced positioning adjustments in the derivatives market. Across major exchanges, roughly $575 million in liquidations occurred during the move, with approximately 90% coming from short positions.
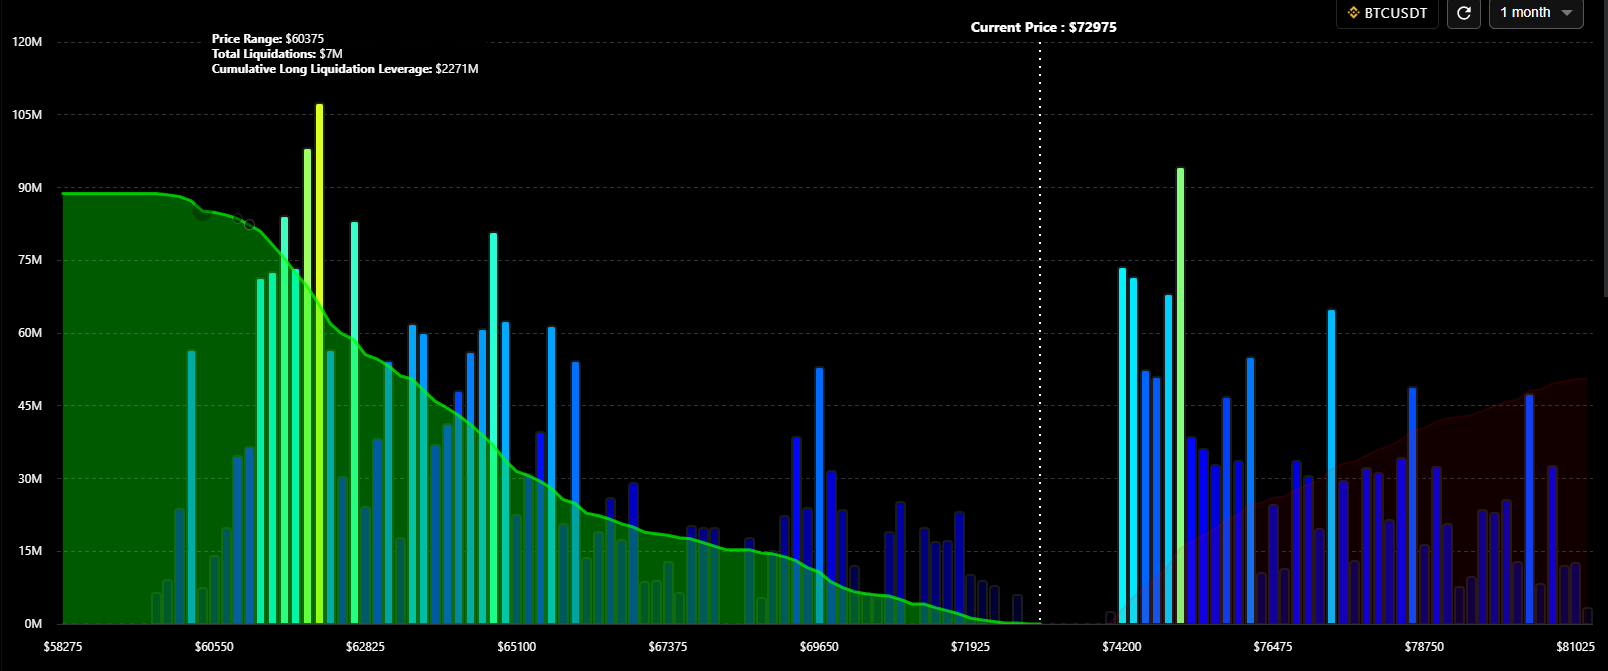
Liquidation heat maps show that leveraged short exposure is heavily concentrated up to around $76,000, meaning that further upside could trigger additional short covering.
If BTC continues to move toward the 50-day and 100-day moving averages, these positions may unwind further, potentially accelerating price toward the $80,000 level.
Short squeezes can often amplify price action during early stages of momentum moves, particularly when positioning becomes crowded.
Bitcoin ETF Inflows Hit Year-to-Date Highs
The improvement in price action is also being supported by stronger institutional flows into spot Bitcoin ETFs.
Across all listed spot BTC ETFs, the five-day average inflow has reached $274 million, marking the highest inflow pace of the year so far.
Much of this capital has been directed into BlackRock’s IBIT ETF, which has started to record increasing allocations from institutional accounts.
ETF flows have become one of the most important drivers of Bitcoin demand since the launch of US spot ETFs, with sustained inflows often correlating with stronger price momentum.
Bitcoin Trades as a High Beta Risk Asset
Another factor influencing Bitcoin’s direction is its relationship with broader risk markets.
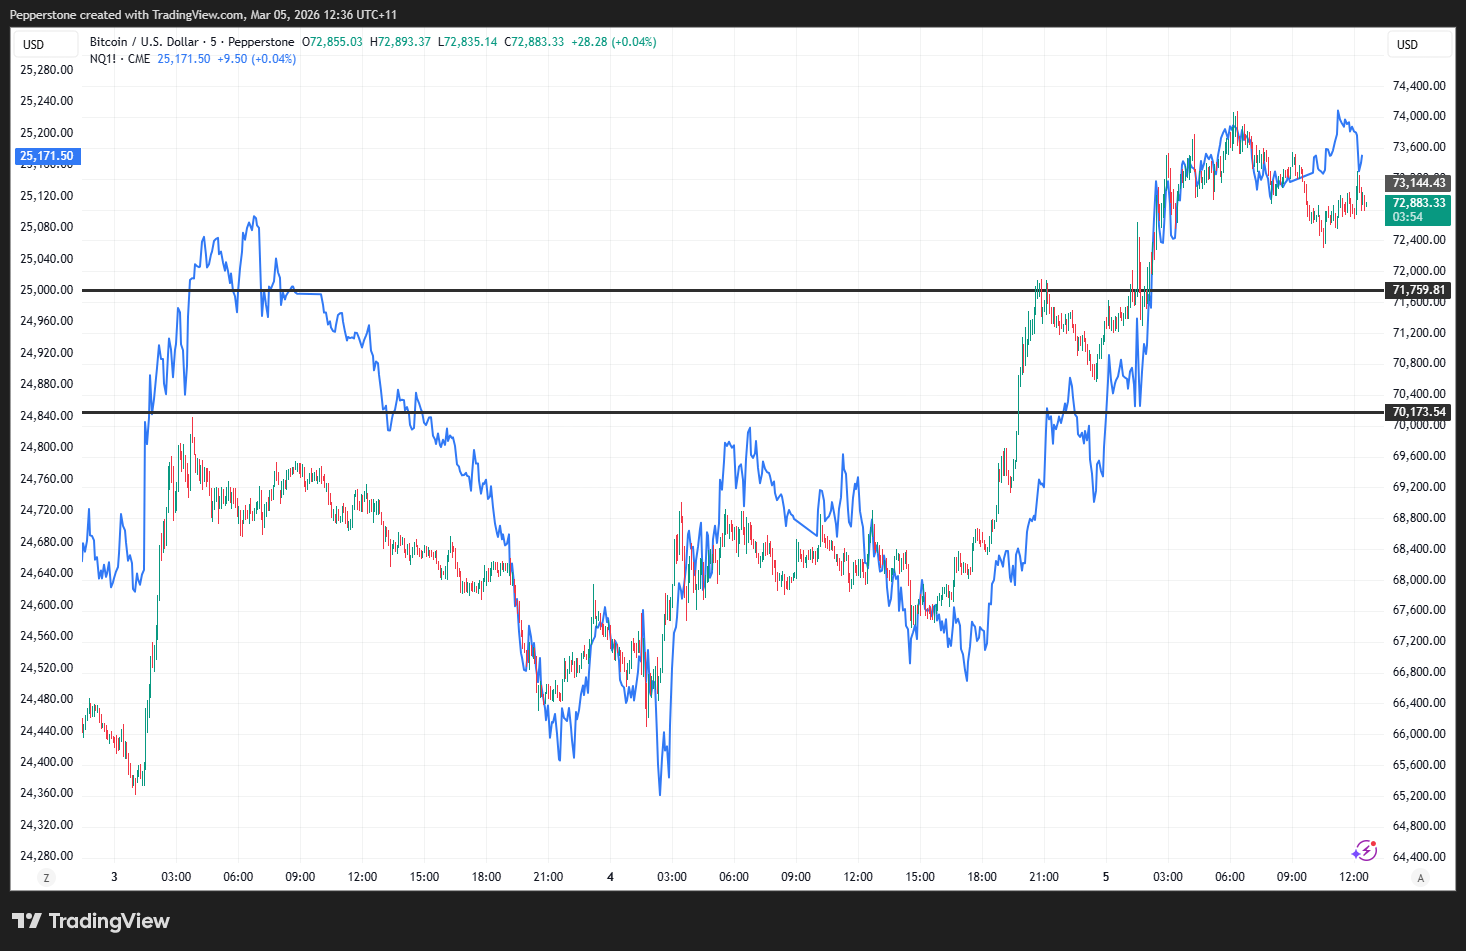
The 10-day rolling correlation between Bitcoin and NASDAQ futures has risen to around 81%, highlighting how closely BTC is currently trading alongside high-beta technology equities.
This relationship suggests that Bitcoin is increasingly behaving like a leveraged expression of risk sentiment. If high-beta technology stocks continue to attract buyers and the NASDAQ extends higher, Bitcoin may benefit from that positive risk environment. Conversely, any sharp risk-off move in equities could quickly spill over into crypto markets.
Corporate Treasury Buying Continues to Support Demand Beyond ETFs, another structural source of demand is coming from corporate treasury buyers.
Companies and BTC treasury entities that accumulate Bitcoin as a balance sheet asset now collectively hold more than 1 million BTC.
One of the most notable buyers continues to be Strategy, whose share price has also recovered alongside the recent move in Bitcoin. With its enterprise value to net asset value ratio sitting near 1.21x, the company still retains flexibility to raise capital and continue adding Bitcoin to its balance sheet if market conditions allow.
This ongoing corporate accumulation adds a longer-term demand base that did not exist in earlier Bitcoin cycles.
Can Bitcoin’s Breakout Turn Into a Counter-Trend Reversal?
While the recent breakout is encouraging for bulls, the bigger question remains whether this move can evolve into a sustained trend.
Breakouts often fail, especially in volatile markets like crypto. However, the current setup contains several ingredients that traders typically look for when assessing potential trend development:
• A clear technical breakout from consolidation
• Above-average derivatives volume
• Large short liquidations
• Improvement ETF inflows
• Supportive macro risk sentiment If these factors continue to align, Bitcoin could attempt a move toward $76,000 and potentially $80,000.
For now, the key takeaway is that Bitcoin is back on traders’ radar. Whether this becomes a lasting reversal or simply another rally within a broader range will depend on how the next phase of price action unfolds.
The material provided here has not been prepared in accordance with legal requirements designed to promote the independence of investment research and as such is considered to be a marketing communication. Whilst it is not subject to any prohibition on dealing ahead of the dissemination of investment research we will not seek to take any advantage before providing it to our clients.
Pepperstone doesn’t represent that the material provided here is accurate, current or complete, and therefore shouldn’t be relied upon as such. The information, whether from a third party or not, isn’t to be considered as a recommendation; or an offer to buy or sell; or the solicitation of an offer to buy or sell any security, financial product or instrument; or to participate in any particular trading strategy. It does not take into account readers’ financial situation or investment objectives. We advise any readers of this content to seek their own advice. Without the approval of Pepperstone, reproduction or redistribution of this information isn’t permitted.