- English (UK)
US Q2 earnings preview - our playbook for Equity, Index and FX traders

For those trading our US30, US500, US2000 and NAS100 markets, one could also assume that if we see increased volatility in US equities, then it could spill over into FX and commodity markets too.
So, it's an event risk to consider.
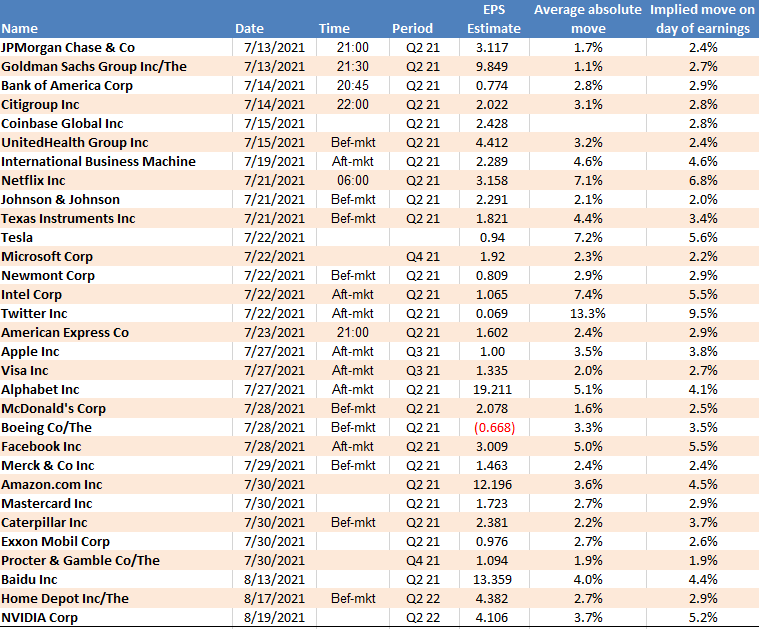
Earnings calendar – the names from our total shares universe we could see strong interest in.
(*the information includes the average absolute move (up or down) over the past eight earnings quarters and the implied move for the day of earnings priced by the options markets).

What’s expected?
The market expects S&P 500 companies to produce aggregate Earnings-Per-Phare (EPS) of $44.96, a 9% decline from Q1 21, but a 60% increase vs Q220 - although, Q220 was the very height of the pandemic and therefore it's a very low base to contrast to.
The bar for beating the streets consensus expectations feels reasonably low and it would be disappointing if at least 70% of S&P 500 companies didn't beat their respective consensus EPS expectations, given the five-year average for companies beating consensus earnings is 74%. On sales, it would be disappointing if we saw less than the five-year of 64% of companies beating.
We will update the results of earnings periodically on our Telegram channel.
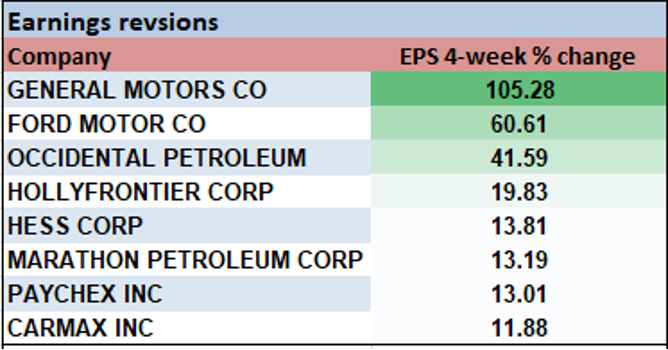
Stocks with the strongest 4-week % EPS revisions:

Company guidance has been very positive
By way of expectations, the signs are promising with 103 companies having issued EPS guidance ahead of their reporting date, with 66 of these guiding to higher earnings. This is the highest positive-to-negative guidance ratio since 2006 and when FactSet started recording these stats. On the revenue side, we’ve seen 85 companies issue positive sales guidance – the second highest ever, only slightly lower than what we saw in Q121.
The fact US Q2 GDP is estimated to be over 8.5%, portrays what a solid backdrop it has been for US companies to generate income. It should reflect in the results.
Outlooks are critical
Perhaps the more important focal point is the outlooks from CEO’s – it’s all well and good beating expectations for Q2, but the market looks forward not backwards. Consider that for Q321 analysts’ consensus EPS is $47.62 (+5.9% QoQ) and Q421 $49.68 (+4.3% QoQ), putting full-year EPS at an expected $189.
In effect, the market will mark-to-market what they’re hearing from corporates relative to the expected EPS and make an assumption that these forward earnings expectations are either too low or too high and revise accordingly – this is where investors get the appetite to add or reduce equity exposures to portfolios and movement and volatility ensues.
Other than financial factors – the market will be keen to assess:
- The inflation vs deflation debate - The impact of price pressures and input costs on margins. Do CEOs see these pressures as longer-term issues?
- Wages – are companies finding it hard to source good staff. Are they paying more for these workers?
- Capital management - The outlook for cash flow growth and the potential for big increases in share buybacks and/or dividends
- The outlook for capital expenditure (CAPEX) – could this lead to increased GDP estimates?
- ESG - The changing trend towards ESG (environmental, social, and governance) – how many will spend time in analyst calls talking up their involvement in ESG.
Consider the full-year P/E (price to earnings) multiple currently sits at 22.6x, which given that the 10-year US Treasury yield resides at 1.47%, S&P 500 implied volatility (the VIX index) is 15.8% and corporate credit spreads are so incredibly tight, suggests that the US equity index is not unreasonably expensive – there's effectively room for error without companies getting smashed just for missing even slightly. In fact, if we see upgrades we could see the index PE multiple falls to 20x earnings which should incentivise further buyers and push the markets to new highs.
Never forget the macro
Macro will naturally play a big part in broad markets sentiment over the next month, especially if interest rate expectations start to turn higher, and we approach a formal announcement where the Fed will taper its bond-buying program – in the near-term however, it seems clear announcements from corporates could play a more important role in the markets psyche.
Other consideration for equity traders:
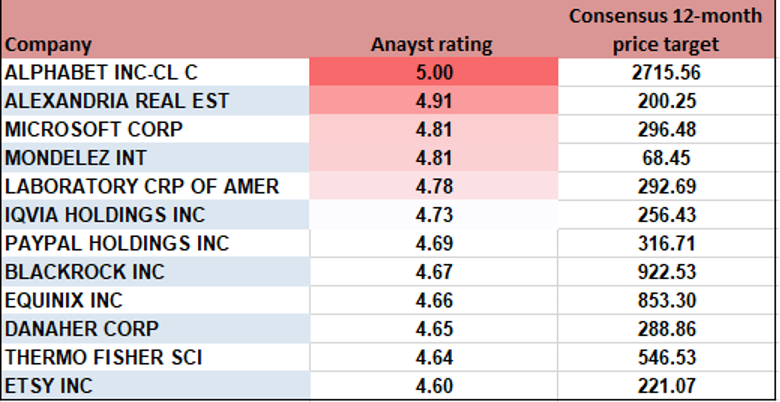
Stocks with the highest analyst rating (5 highest – 1 worst) and consensus 12-month price target – looking for those names deemed to be market darlings, with good upside to price targets.

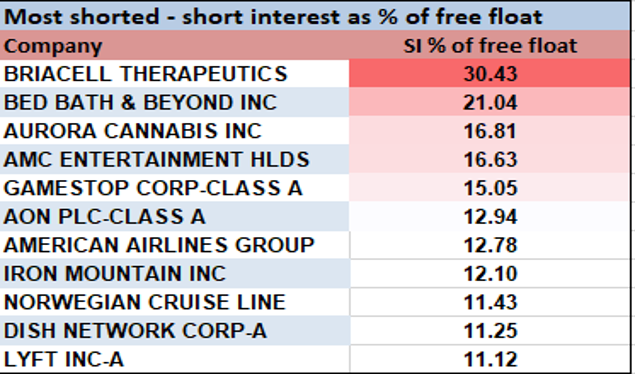
Stocks with highest short interest as % of free float. These names could have more pronounced moves through earnings.

Ready to trade?
It's quick and easy to get started. Apply in minutes with our online application process.
The material provided here has not been prepared in accordance with legal requirements designed to promote the independence of investment research and as such is considered to be a marketing communication. Whilst it is not subject to any prohibition on dealing ahead of the dissemination of investment research we will not seek to take any advantage before providing it to our clients.
Pepperstone doesn’t represent that the material provided here is accurate, current or complete, and therefore shouldn’t be relied upon as such. The information, whether from a third party or not, isn’t to be considered as a recommendation; or an offer to buy or sell; or the solicitation of an offer to buy or sell any security, financial product or instrument; or to participate in any particular trading strategy. It does not take into account readers’ financial situation or investment objectives. We advise any readers of this content to seek their own advice. Without the approval of Pepperstone, reproduction or redistribution of this information isn’t permitted.