- English (UK)
- English (UK)
A traders' week ahead playbook- commodities get close attention

The USD has eased back following US 2yr Treasury yields, which have pulled back from 3.45% to 3.06%, and we see a pennant consolidation pattern in the USDX daily that needs to play out and may impact sentiment in broad markets when it does.
Certainly, the mood in equities has lifted but remains unconvinced and we’ve seen both the US500 and NAS100 fill and break above their respective 10 June gap – will month-end flows continue to support, with further fund rebalancing, trader short-covering and relief buying? Clearly, sentiment was so shot to pieces and positioning so light into mid-June that (with hindsight) there was always going to be a risk of a sustained bear market rally in risk assets, but let’s see if the bulls can build on this, as we assess the potential to take the NAS100 into 12,800 and US500 into 4100 – how the market digests this week’s economic data will be closely watched, notably the US ISM manufacturing report.
With Jay Powell validating the ‘recession’ callers growing belief, there has been some easing in US and global rate hike expectations, with 29bp priced out of the US swaps market over the next two years. FX volatility (vol) has dropped, and most pairs on my vol matrix sit around the 40th percentile of the 12-month range. Equity vol is still elevated with the VIX index at 27.23% and there is scope for the market to push into the 23-25% range. We see the CBOE S&P 500 put/call ratio dropping back to 0.51 and well off the highs we saw in April/May, so the demand for puts and portfolio hedges has been unwound.
Anyhow, keeping a close eye on US equity indices, crude, and commodities more broadly and what they signal on growth. Copper has become the bellwether again on economics and having lost 16% in the past 14 days, this is one that is getting the love from the shorts – that said, we saw some indecision to push this far below $3.70 on Friday and shorts are at risk of a quick move into $3.95. Keen to watch the XLE ETF (energy sector) and whether this can find buyers, I see risks that will be the case.
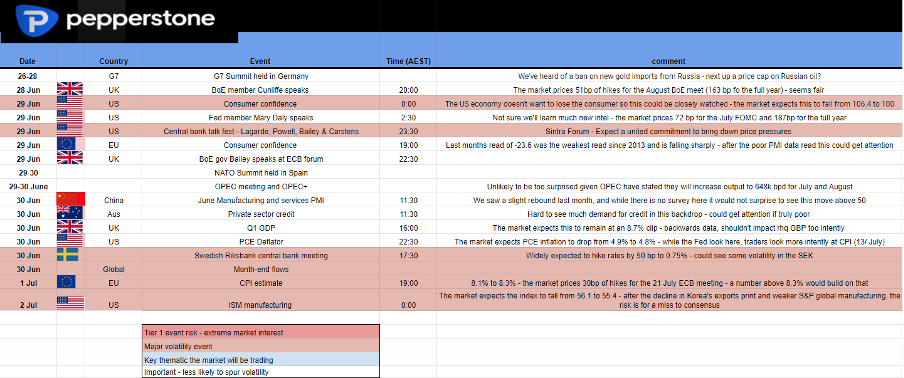
Key themes aside, here are the core focal points. Anything growth focused seems key – notably the US ISM manufacturing report later in the week may get the lions share of attention. A G7 plan to ban Russian gold imports is unlikely to promote too much reaction from Putin, but it does suggest keeping an eye on XAUUSD, while talk of oil price caps is worth exploring too. If cant see the pictures clearly, here's the Twitter link for clarity.
(Source: Pepperstone - Past performance is not indicative of future performance.)
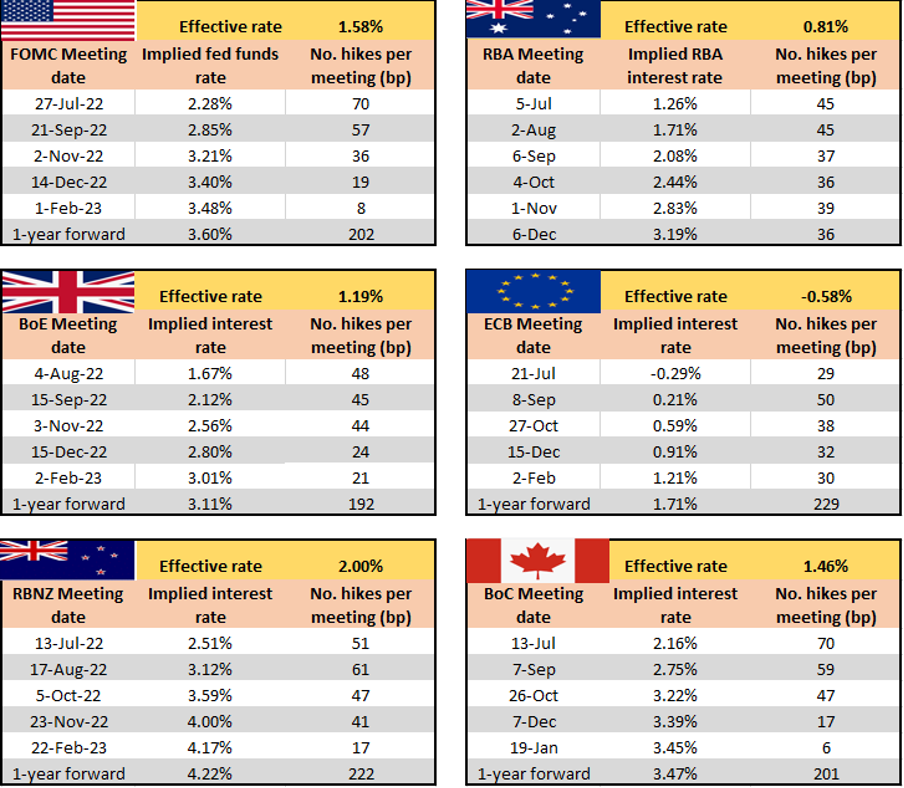
Interest rate expectations – I’ve looked at the implied rate for each meeting (using swaps and futures pricing). I’ve looked at the step-up in rate hike expectations for each following meeting. For example, we see 70bp of hikes priced for the July FOMC meeting, with a further 57bp priced for the September meeting. We see 45bp priced for the next RBA meeting, which suggests if the RBA meeting was today and they hiked by 50bp – without considering the outlook and how it reconciles with the forward pricing, the AUD shouldn’t move on a 50bp hike.
(Source: Pepperstone - Past performance is not indicative of future performance.)
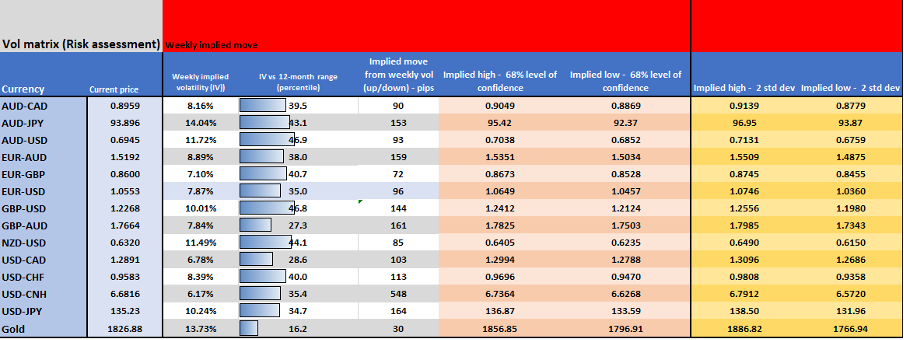
Implied volatility matrix – Again, I looked at the options market and the implied volatility priced by dealers – we can then look out and calculate the implied trading range. This is one of the only forward-looking guides and is based on expectations of movement. I find it useful to understand how the market is feeling about key event risks and how to guide my risk and we can also use it for mean reversion levels. With vols pulling back it suggests closer stop placement which means potentially increasing position sizing.
(Source: Pepperstone - Past performance is not indicative of future performance.)
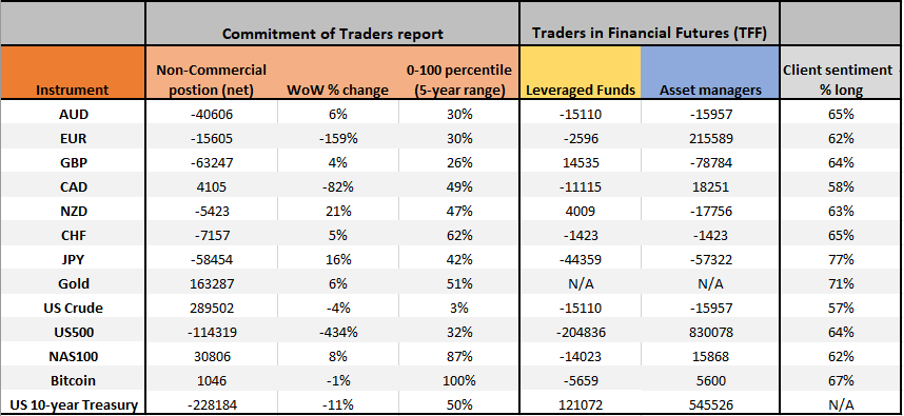
Positioning – here I’ve looked at the CoT/TFF futures report on positioning in our most traded markets and added the current skew of longs from clients.
(Source: Pepperstone - Past performance is not indicative of future performance.)
Related articles

Ready to trade?
It's quick and easy to get started. Apply in minutes with our online application process.
The material provided here has not been prepared in accordance with legal requirements designed to promote the independence of investment research and as such is considered to be a marketing communication. Whilst it is not subject to any prohibition on dealing ahead of the dissemination of investment research we will not seek to take any advantage before providing it to our clients.
Pepperstone doesn’t represent that the material provided here is accurate, current or complete, and therefore shouldn’t be relied upon as such. The information, whether from a third party or not, isn’t to be considered as a recommendation; or an offer to buy or sell; or the solicitation of an offer to buy or sell any security, financial product or instrument; or to participate in any particular trading strategy. It does not take into account readers’ financial situation or investment objectives. We advise any readers of this content to seek their own advice. Without the approval of Pepperstone, reproduction or redistribution of this information isn’t permitted.