- English (UK)
- English (UK)
A risk-on market hedging virus exposure - 5 charts that capture the cautious mood

Because investors maintain faith in the USD and US assets, the mood remains fairly risk-on. One theory is that Instead of selling off stocks amid uncertainty, markets have hedged the exposure in gold, which has soared past $1600 USD and hit record highs in most currencies outside of the USD.
Here are five charts that capture the markets cautious but risk-on mood.
Gold (XAUUSD)
Gold closed above 1600 USD on Tuesday as investors hedged equity exposure risk after Apple announced it will miss Q1 revenue guidance. Surely markets knew the virus would disturb production, but waited for the headline as confirmation rather than pricing it in.
The outlook for gold from here will depend how other major companies fare as China slowly gets back to work and the virus reality sets in. US stocks are in a bull market and will continue to be, so rather than selling down stocks amid the panic, investors seem to be hedging the risk exposure into gold.
Apple might be the first of many major companies to report a material disruption. Then as economic data for February comes available in March, markets will begin to better understand the fallout. Gold should continue to perform well as a hedge against the temporary slump.
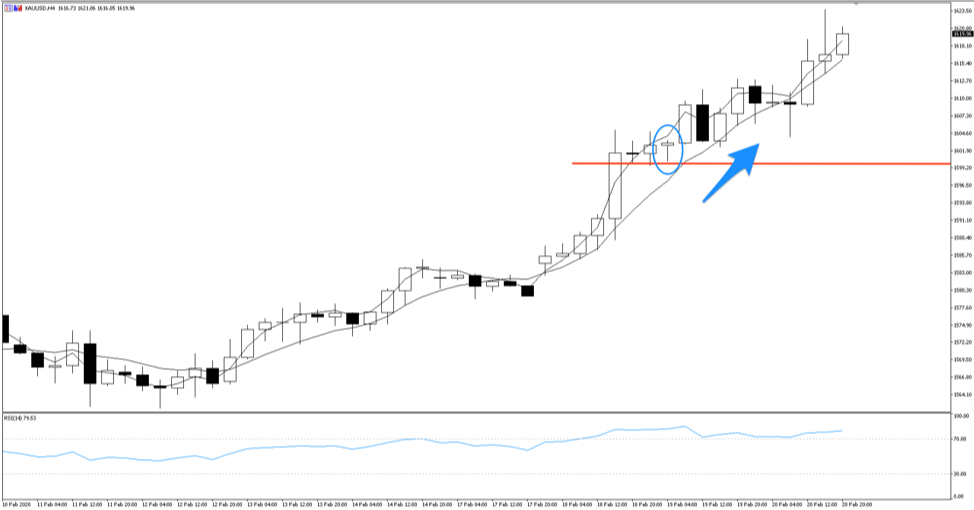
On the 4-hour chart, you can see that gold settled on the 1600 level for a while, testing it before a bullish hammer candle propelled it higher again. We wait for February economic data throughout Asia and news of other major companies facing significant coronavirus disruption for gold to track higher. Gold is at record highs against a handful of currencies including EUR, AUD, NZD, ZAR, and BRL.
Apple stock
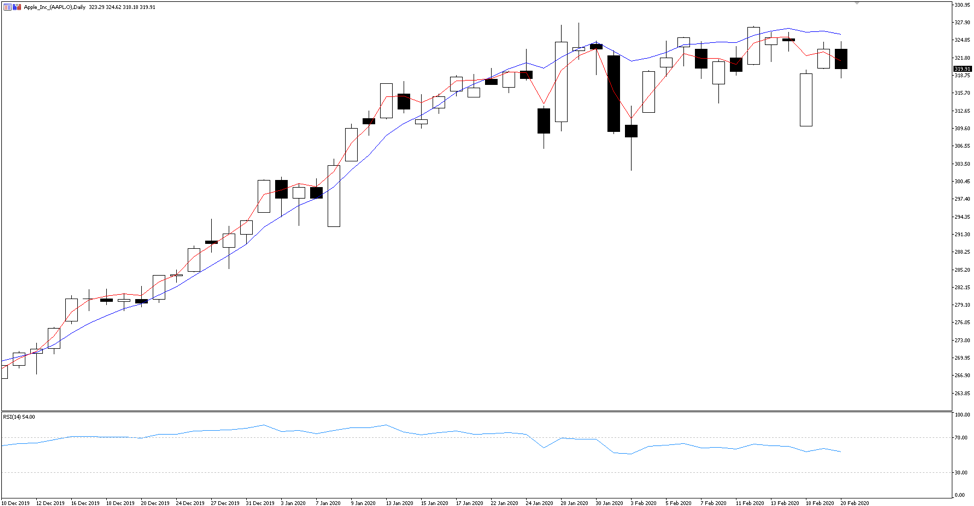
Apple (AAPL.O) spooked markets when it announced it would miss Q1 guidance due to virus disruption in China, sparking a flee to safe havens as investors hedged their equity exposure.
Apple gapped lower on the Tuesday US open but spent the day regaining considerable ground on its losses. Even since late January when the scale of the CoVID-19 outbreak became apparent, it resulted in some choppy sideways action rather than a considerable move lower. It seems US stocks, notably the tech giants, continue to be unstoppable.
Apple is the most valuable company in the world and you can trade Apple Share CFDs with Pepperstone on MetaTrader 5.
Dow Jones US30
The Dow Jones (US30) is on its way to an eye-watering 30,000 USD valuation, and the index is reluctant to let the virus fallout stop it.
The index, which measures the performance of 30 large US companies including Apple, is being pushed higher by global investors pouring money into the US. At the time of writing, it’s less than 750 points from the 30k target.
Why is so much capital flowing into the US? Well, as Asia suffers from a virus breakout and data in Europe trends down, the US seems the safest place for capital returns. The US economy is in a sweet spot: a strong labour market, low Federal Funds rate, and ample liquidity from the Federal Reserve’s balance sheet expansion and repo market operations.
All this makes us ask: is the US stock market itself now a global safe haven?
The bulls are battling with the bears as they try to drag it higher. When they take control again, it’ll be a sprint to the 30k goal.
The US30 is one of our most popular indices, and you can trade the after-hours market with Pepperstone on its journey to a 30,000 valuation.
USDJPY
This chart says it all. It’s risk-on for the USD and its stock market and amid uncertainty, the Japanese Yen is currently not the safe haven we’re used to.
One of China’s closest neighbours, Japan is particularly exposed to the virus outbreak. Confirmed cases are increasing daily and the quarantined Diamond Princess cruise ship has battered headlines. Add to that the Japanese economy looking weak, with Q4 GDP printing -6.3% YoY this week. Recession fears are looming.
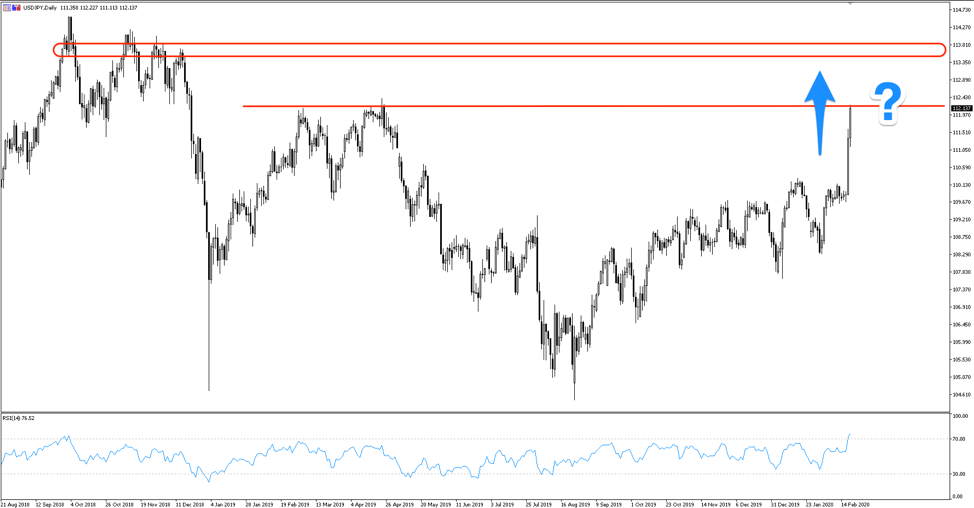
Usually in times of uncertainty, the JPY would be flying and our chart would be moving in the opposite direction. Instead, the USD strengthens against the safe haven.
The outlook for the JPY doesn’t look flash, with the newsflow certainly working against it. USDJPY is testing 1-yr resistance at the 112.175 level. A continued bad feel for the Japanese economy and it breaks above resistance, granting permission for a move to 113.500 and beyond.
EURUSD
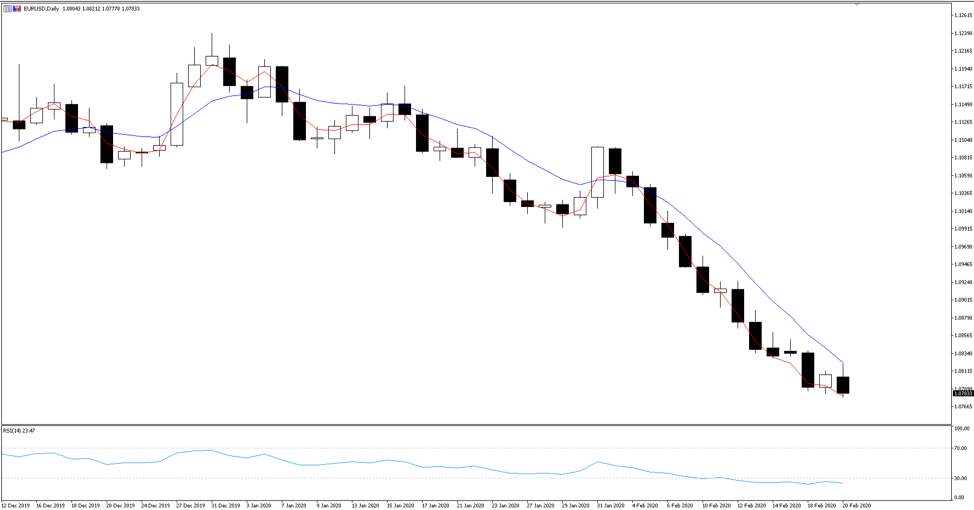
The strong downtrend in EURUSD illustrates a weak Europe’s capital flow as money moves into the safer US, increasing demand for the USD and depleting the euro’s value. After nine days of consecutive lower lows, EURUSD is moving sideways. A pause before another move lower?
This isn’t just a coronavirus story, but also a Europe story. Markets were betting on a euro recovery for sometime and it hasn’t happened. German data continues to underperform, with Q4 GDP printing 0% growth on Friday.
While the world looks weak, the US looks comparatively safe
The euro is trading at lows not seen since April 2017 and has no strong support from here. A close above the 5-day moving average could indicate the strong downtrend is cooling, but the euro needs little conviction to move lower while the USD holds strong.
Ready to trade?
It's quick and easy to get started. Apply in minutes with our online application process.
The material provided here has not been prepared in accordance with legal requirements designed to promote the independence of investment research and as such is considered to be a marketing communication. Whilst it is not subject to any prohibition on dealing ahead of the dissemination of investment research we will not seek to take any advantage before providing it to our clients.
Pepperstone doesn’t represent that the material provided here is accurate, current or complete, and therefore shouldn’t be relied upon as such. The information, whether from a third party or not, isn’t to be considered as a recommendation; or an offer to buy or sell; or the solicitation of an offer to buy or sell any security, financial product or instrument; or to participate in any particular trading strategy. It does not take into account readers’ financial situation or investment objectives. We advise any readers of this content to seek their own advice. Without the approval of Pepperstone, reproduction or redistribution of this information isn’t permitted.