Spread bets and CFDs are complex instruments and come with a high risk of losing money rapidly due to leverage. 72% of retail investor accounts lose money when trading spread bets and CFDs with this provider. You should consider whether you understand how spread bets and CFDs work, and whether you can afford to take the high risk of losing your money.
- English (UK)
The bears are certainly getting the upper hand, and today's Asian open is looking fairly dicey as the various indices start to unwind.
While we’ve seen the USD outperform, I can’t go past moves in the options markets, with oil volatility (vol) moving like a freight train, and there are a few charts that suggest trading in a more defensive tone for now. I won’t go through all the news flow, as price tells the clearest story here and maybe I’ll cover off on most the news and views in tonight’s webinar, which if you haven’t sign up for and are keen.
Once again, when it comes to focal points, the session belonged to crude and while we saw June crude trade into $6.50 (our ‘spot’ crude price traded to $3.39), and we’ve seen June Brent crude into $17.51. The move in implied vols that have materialised have been incredible.
The CBoE oil volatility index for example, traded in a monster range of 517 to 213 today, although it ultimately closed up an impressive 99-vols on the day at 325.
This implies that crude will move (higher or lower) by 20% a day. So, consider since the futures re-set June crude is +21% and July 13% and despite this being an incredible percentage change, it feels effortless.

"Source: Bloomberg"
The ICE exchange has announced they are preparing the Brent futures to accept negative prices, so that is one to watch as we head towards expiry on 30 April. Although the June WTI expiry on 19 May will be the main event.
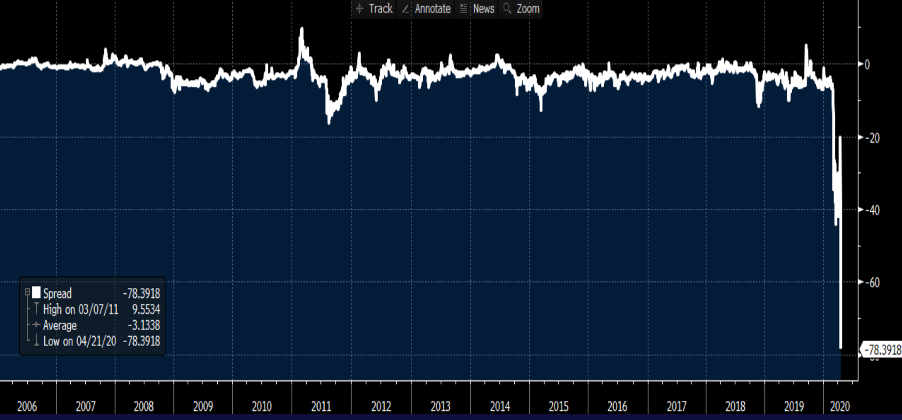
If we look at the crude 1-month risk reversals - that being the difference between 1-month crude 25-delta call volatility minus put volatility, we’ve seen it blow out to -78 vols. That is an insane move. Options traders are saying if there is a move the downside move is going to be far greater than any upside move.
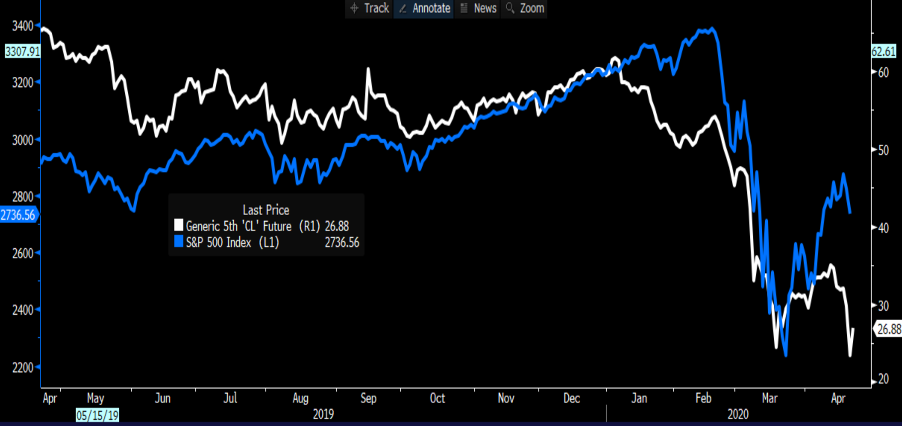
Let’s take the near-term storage issues out of the equation and look further out the crude curve, at say the 5th-month futures (October contract). I like this part of the curve as it removes a lot of the near-term storage issues that are playing into the front-month futures.
As we can see, price never really took off from the March lows, or should I say it did but now it has rolled over hard. Clearly, the lack of follow-through highlights that crude wasn’t affected by the Fed’s buy everything program, in the same way, equities and credit have.
That said, when crude collapsed in January, the S&P 500 followed. When 5th-month crude rallied in March, the S&P 500 followed. Could this be a sign the S&P 500 is to follow? Maybe this tells a far clearer story of future demand and economics.
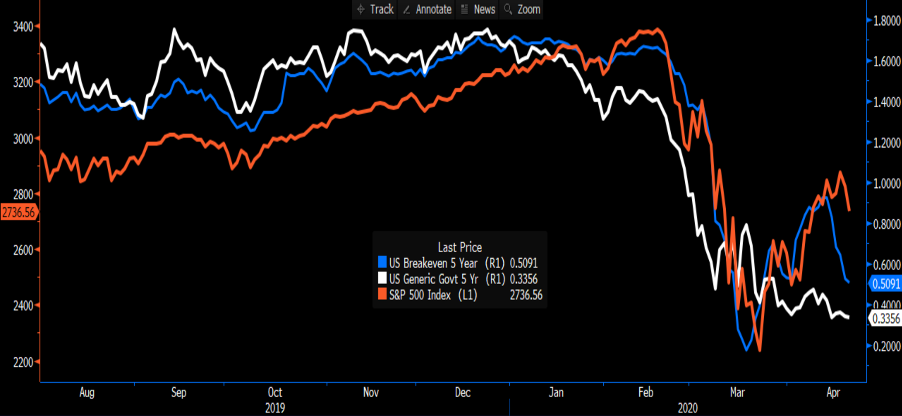
Inflation expectation rolling over - This chart also throws weight to the notion that volatility is going to stay high and that I should be trading on the defensive side of the ledger. For perspective, from the March lows US 5-year inflation expectations/’breakevens’ (blue) moved sharply higher and this put a backbone, not just into the S&P 500 (orange), but gold too – which I have left off. US 5yr Treasury yields (white) remained anchored through the move, with the Fed ramping up its QE program and no one is going to fight the Fed here – as inflation expectations moved up faster than bond yields we saw ‘real’ yields falling and this not only boosted the equity market but weakened the USD.
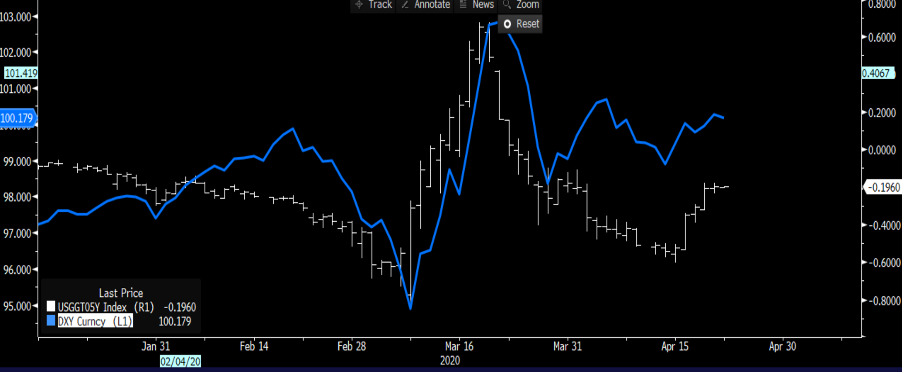
Maybe it’s been driven by crude, but inflation expectations are now rolling over hard and this is boosting real yield. This could be very influential to the risk trade, as well as where to for the USD.
(Blue – USDX, white – US real yields)
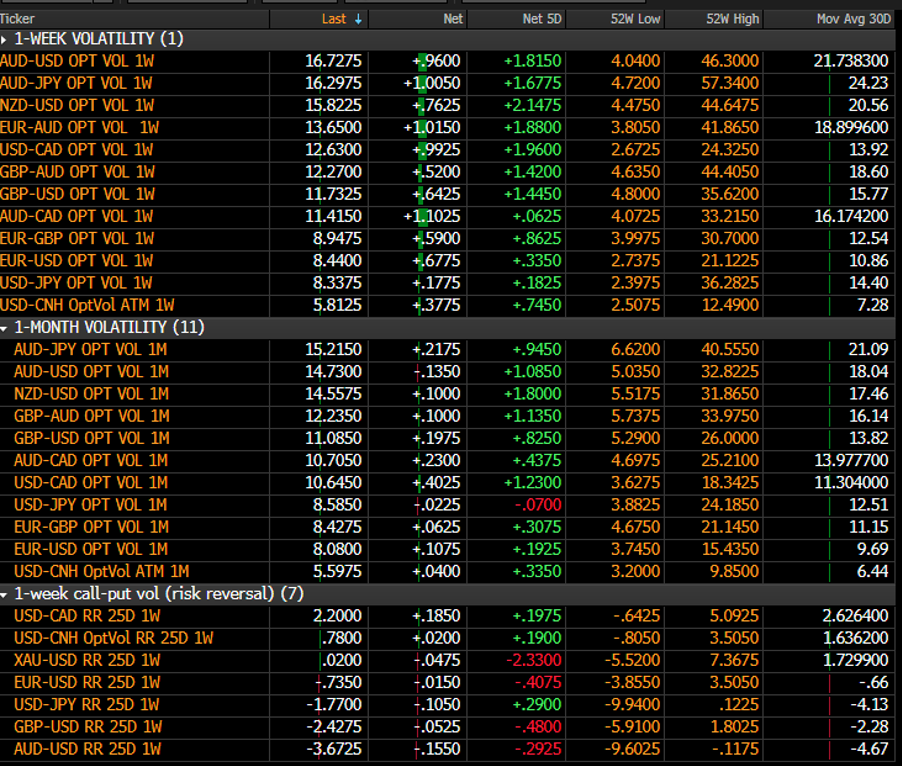
In terms of FX vols, we’ve seen a slight move in petro-currency volatility, but they haven't been as punchy as I would expect. This is also quite interesting, as I would certainly have expected vols to ramp up and FX traders are taking a calm approach to the madness seen in crude markets.
Ready to trade?
It's quick and easy to get started. Apply in minutes with our online application process.
The material provided here has not been prepared in accordance with legal requirements designed to promote the independence of investment research and as such is considered to be a marketing communication. Whilst it is not subject to any prohibition on dealing ahead of the dissemination of investment research we will not seek to take any advantage before providing it to our clients.
Pepperstone doesn’t represent that the material provided here is accurate, current or complete, and therefore shouldn’t be relied upon as such. The information, whether from a third party or not, isn’t to be considered as a recommendation; or an offer to buy or sell; or the solicitation of an offer to buy or sell any security, financial product or instrument; or to participate in any particular trading strategy. It does not take into account readers’ financial situation or investment objectives. We advise any readers of this content to seek their own advice. Without the approval of Pepperstone, reproduction or redistribution of this information isn’t permitted.
