- English (UK)
- English (UK)
Analysis

In my note on using volatility as a central guide in trading, I touched on certain variables and indicators I use to understand the expected move on the day in any instrument. I have put this into a table for clients to use, that hopefully gives perspective.
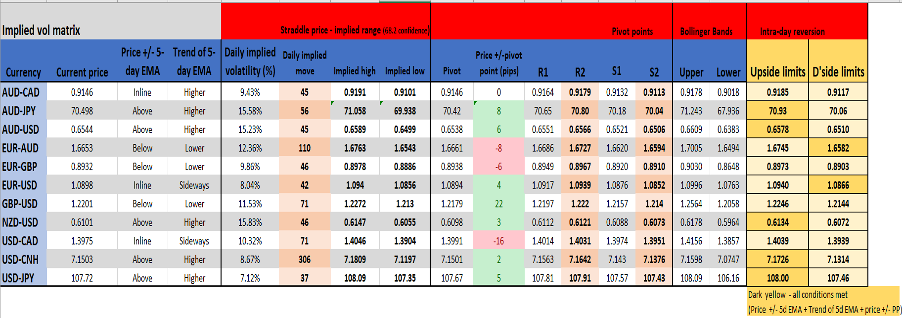
The crux of this is I want to understand areas where an intra-day price move may start to look ‘tired’, and we see a higher probability that the move is capped. This is useful for mean reversion, and to identify areas which may be considered extreme.
Of course, if there is news then these levels can be blown right open, and that is why we always assess known event risks before they happen. The fact, this model has an implied volatility element, rather than simply just taking realised vol (statistical fact – Bollinger bands/ATR etc), helps shape my understanding - as this is the market making a judgment call on the expected move and not just my view. I have sourced the implied move by assessing the daily options ‘straddle’ price, which I source from Bloomberg.
The ‘intra-day reversion’ level
I consider the implied (options) move and weight it with R2/S2 - although, I am looking to tweak this to take a blend of S2/R2 and R3/R3. There is an extra consideration for the proximity of the upper or lower Bollinger Band levels. This will provide me with levels on the ‘intra-day reversion’ column.
Follow the money flow
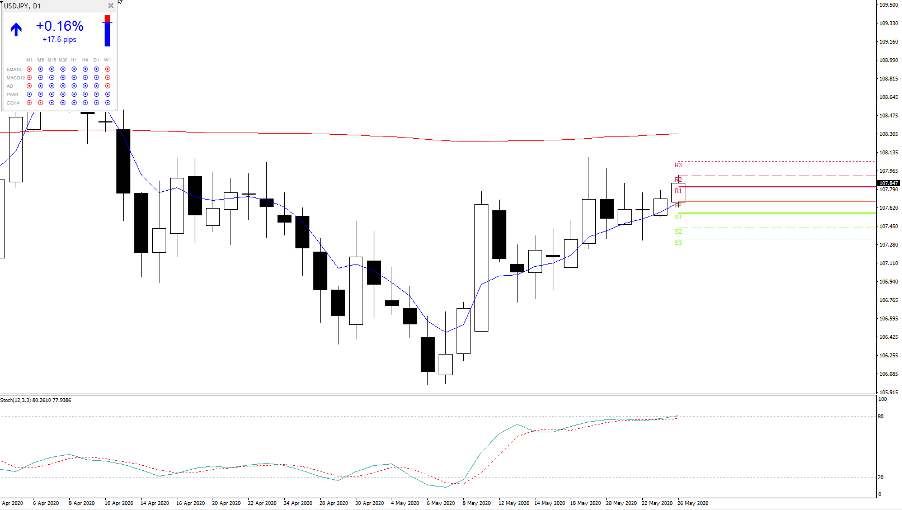
I look at whether price is above/below the 5-day EMA, the direction of the 5-day EMA trend and whether price is above/below the pivot point. This offers an understanding of the potential short-term price direction. If I see alignment in all three variables then it offers an expectancy of ST upside or downside - For example, for USDJPY, I see the 5-day EMA is moving higher, price is also above this average and above the PP – all three are in alignment/agreement and the probability favours a test of the upside limit at the time of running the model.
It's not just mean reversion, but if I am going to take a position, I can use this to define my risk and therefore position sizing.
I will back-test the changes and report back. However, I thought I would share, and this is just one example of how we can create structure in our trading plan. Happy to share on an ongoing basis if clients feel it is useful.
Related articles


Ready to trade?
It's quick and easy to get started. Apply in minutes with our online application process.
The material provided here has not been prepared in accordance with legal requirements designed to promote the independence of investment research and as such is considered to be a marketing communication. Whilst it is not subject to any prohibition on dealing ahead of the dissemination of investment research we will not seek to take any advantage before providing it to our clients.
Pepperstone doesn’t represent that the material provided here is accurate, current or complete, and therefore shouldn’t be relied upon as such. The information, whether from a third party or not, isn’t to be considered as a recommendation; or an offer to buy or sell; or the solicitation of an offer to buy or sell any security, financial product or instrument; or to participate in any particular trading strategy. It does not take into account readers’ financial situation or investment objectives. We advise any readers of this content to seek their own advice. Without the approval of Pepperstone, reproduction or redistribution of this information isn’t permitted.