- English (UK)
- English (UK)
Analysis
The great disconnect: Bullish equities and bearish economics

Of course you know this is not the case, with fatalities still sharply rising and a mass wave of unemployment yet to be fully felt, not to mention an oil rout triggering a reassessment across risk assets. Yet major global stock indices have rallied more than 20% off the March lows - that’s a technical bull market - revealing a grave disconnect between markets and economics.
Wall Street, it seems, is pricing only a mild recession, but is that unrealistic given the current state of economics? Here’s the case.
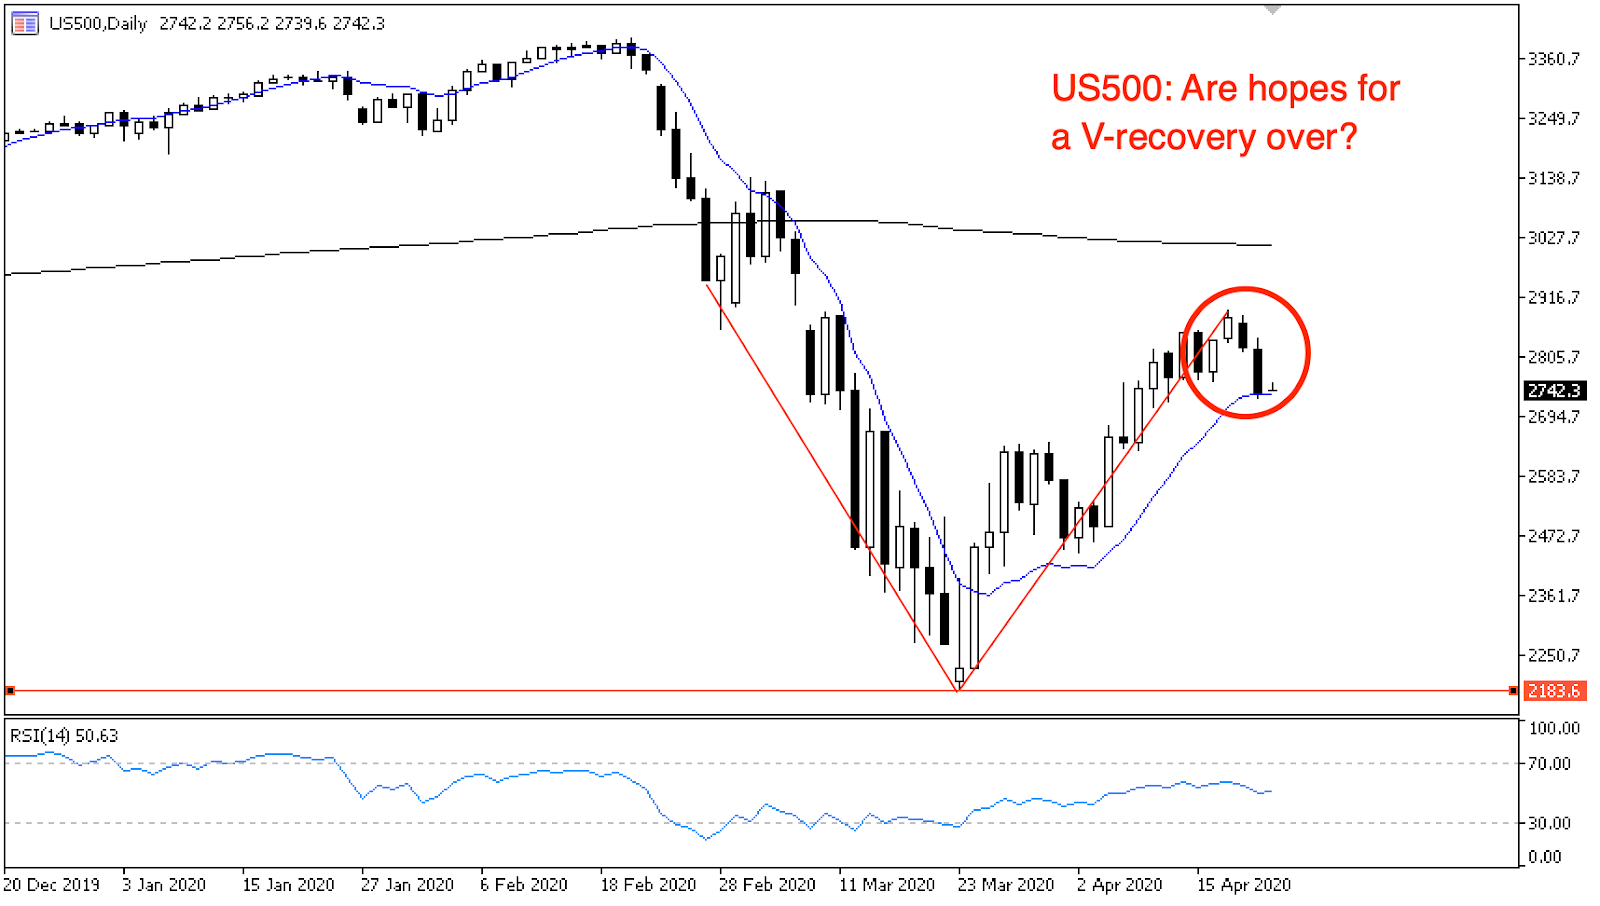
"Daily chart: The oil rout has jeopardised what was shaping up to be a V-shaped recovery in equities. Was the equity rally off the March low too optimistic? Chart source data: Metaquotes MT5"
US equity benchmark the S&P 500 (US500) is one of many major global stock indices that has rallied off the March lows on optimism that everything will be back to normal sooner rather than later. It was shaping up to be a V-shaped recovery but it’s now showing signs of cracking.
The rally has been led by tech and healthcare companies. You can see it best on the US Tech 100 Index (NAS100) below, which last Friday had reclaimed all of its 2020 losses. Stay-at-home tech companies like Amazon (AMZN.O) and Netflix (NFLX.O) have surged, as have healthcare stocks as investors bet on the development of a COVID-19 cure.
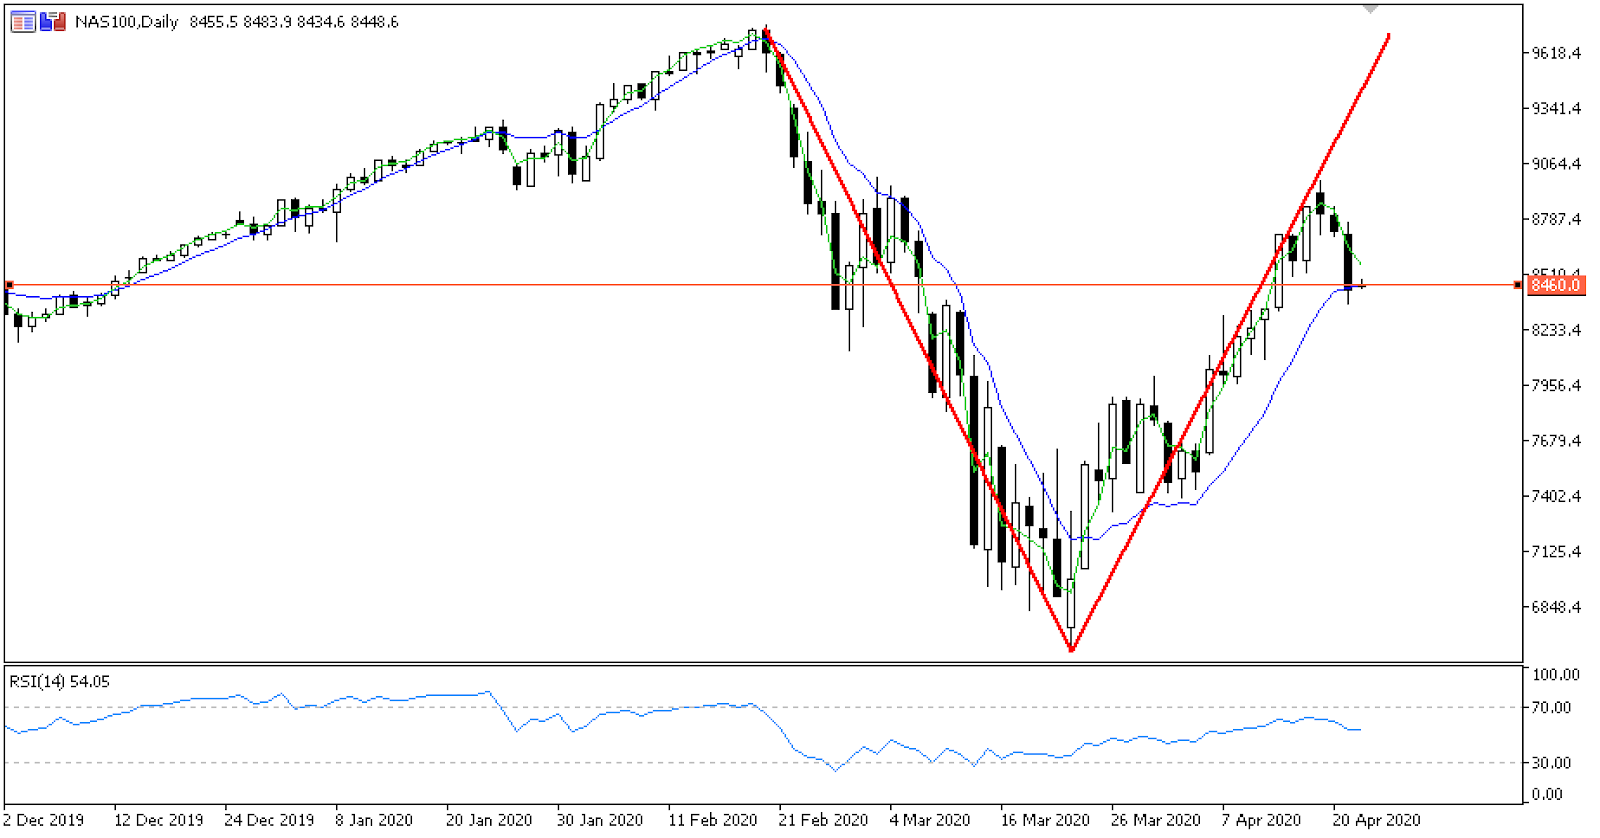
"Daily chart: The NAS100 had wiped all 2020 losses last Friday but has traded lower again since. Chart source data: Metaquotes MT5"
The NAS100 has slid again this week alongside plummeting crude prices, now trading at mid-December levels as hopes for a V-shaped recovery fade.
The recent rally has three key drivers. 1) optimism that lockdowns will be lifted sooner rather than later. 2) Developments in healthcare as researchers scramble for a treatment. 3) Central bank expansionary measures providing easy money and policy to drive an eventual economic recovery.
But look outside of equity markets at broader economics and prolonged lockdowns and the rally’s vulnerabilities are easily exposed. Let’s start with lockdowns, which can only be lifted once and for all without risk of a second wave if the virus is successfully contained. While some countries are flattening the curve with great success, others aren’t. Then there’s the collapse in crude prices, revealing deeper concerns that could drag equities lower.
Here’s what’s driving the rally and where its vulnerabilities lie.
Q2 2020 - the worst in a lifetime
Investors have accepted that Q2 2020 (that’s April - June) will probably be the worst in anyone’s lifetime, with historic rates of economic contraction and surging unemployment. But remember that equity prices don’t reflect the present and instead reflect the present value of all future cash flows, forever. Equity markets are looking past what they know will be an awful Q2, and counting on a quick recovery afterwards.
But a V-shaped recovery needs a buoyant consumer. The surge in unemployment will run deep, and consumers could remain cautious for a long time, all of which will delay any possible recovery to pre-pandemic economic activity. Without a confident, buoyant consumer, the risk here is that the major impacts of lockdowns we’ll feel in Q2 could leak into future quarters. Then consider the prospect that lockdowns in major economies could last longer than expected, and we have a few cues for equities to correct lower.
Historic surge in unemployment
Unemployment rising at historic rates, much sharper than during the GFC, will hurt economies for a long time.
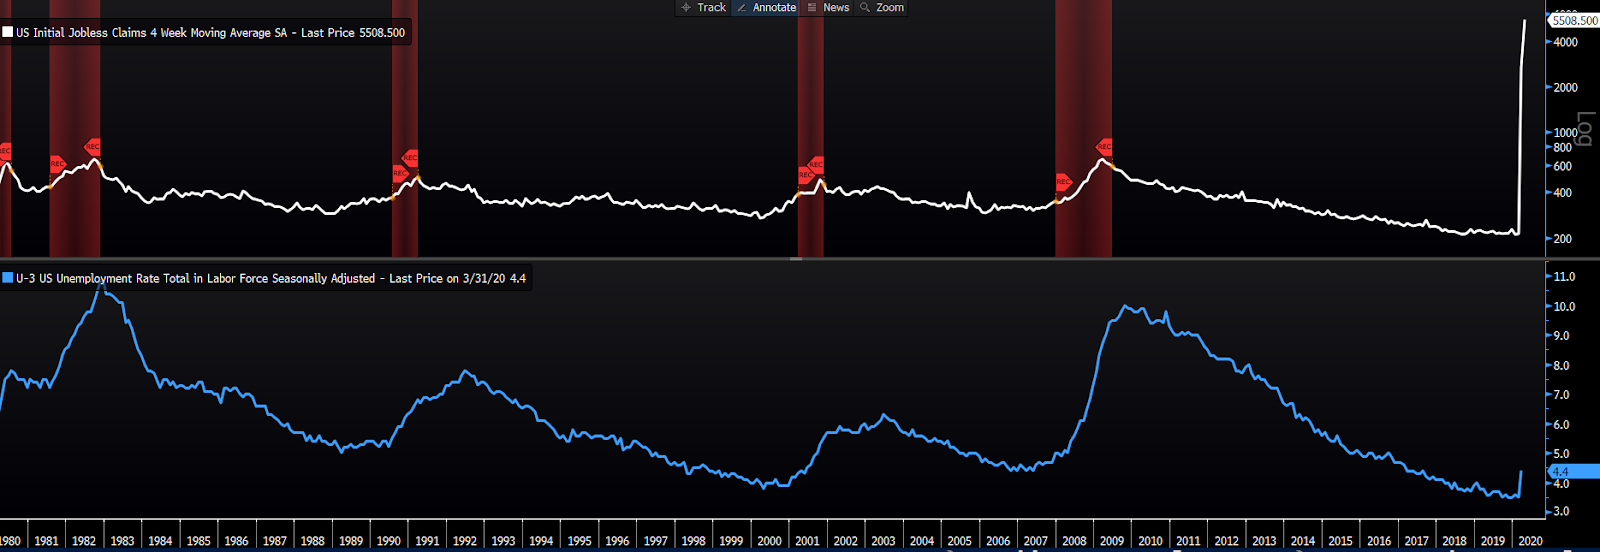
"Upper pane: US initial jobless claims (white line) has spiked sharply during the COVID-19 crisis. Red indicates past recessions. Lower pane: US unemployment rate at 4.4% for March. Source: Bloomberg"
The numbers are staggering. The US unemployment rate for March printed at 4.4% (blue line, lower pane), an increase from 3.5% the previous month and the highest level since August 2017. Initial jobless claims increased by a further 5.2 million last week (white line, upper pane), taking the 4-week total to 22 million - that’s 13.5% of the labour force. The rise was so large and so sharp that we’ve had to use a logarithmic scale as to not flatten the rest of the curve.
The US unemployment rate prints the second Friday of each month, so we will have the devastating April numbers on 8 May. Markets already expect this number to be devastating along with a slew of other awful Q2 data, so I’d expect even a worse-than-expected print to be largely forgiven by equity markets.
Any economy that has faced lockdowns will be left with a mass wave of unemployment. What threatens the V-shaped recovery is the prolonged effect this could have. If consumers remain cautious of public spaces or simply withhold spending during an uncertain recovery, the journey to ‘normal’ employment and economic activity could be particularly prolonged and painful.
‘Whatever it takes’ policy
Global central banks have responded swiftly to the crisis, ensuring easy monetary policy to drive an economic recovery, as they show they’ll do whatever it takes to minimise the economic fallout.
Global central banks quickly slashed rates to near zero. The RBA and Reserve Bank of New Zealand (RBNZ) then introduced their first ever quantitative easing (QE) program, while the Fed ramped up its existing asset-purchasing program to ‘QE unlimited’.
QE unlimited initially meant no ceiling to the Fed’s balance sheet expansion, but it also came to mean purchases of corporate debt in both the primary and secondary market, an unprecedented first for the US. The program will last through to 30 September 2020.
Governments have also come to the table with major fiscal packages, including wage subsidies and small-to-medium business relief. US Congress argued over finer details but passed a $2 trillion stimulus package late March, providing helicopter money to households, temporary increases to unemployment benefits, and a $500 billion lending program to businesses, states, and municipalities. In Australia, Job Keeper legislation hopes to maintain a connection between employer and employee through wage relief so that when the crisis is over, the unemployment impact is reduced.
They say don’t fight the Fed. With so much easy money and policy ready to propel economies out of a crisis, that saying has so far rung true. But is it enough to uphold a V-shaped recovery?
Negative oil prices
Oil is often considered a recession barometer. In good times, companies ramp up production to meet increasing consumer demand. Oil is often required to boost production, so its price increases. This then ricochets to all corners of financial markets, with several major corporations benefiting from higher oil prices.
Energy producers like Exxon Mobil (XOM.N) and Chevron (CVX.N) are obvious beneficiaries of higher prices, but so is the financial sector. Banks issue loans to energy companies who are more likely to finance new research or drilling projects, which become profitable as prices rise. But these projects aren’t viable when prices are low, so producers slash capex and abandon new projects, and the banks lose out on business. It also hurts steel and heavy machinery. Companies like Caterpillar (CAT.N), which provide machinery to the industry, will also feel the pinch of lower oil prices.
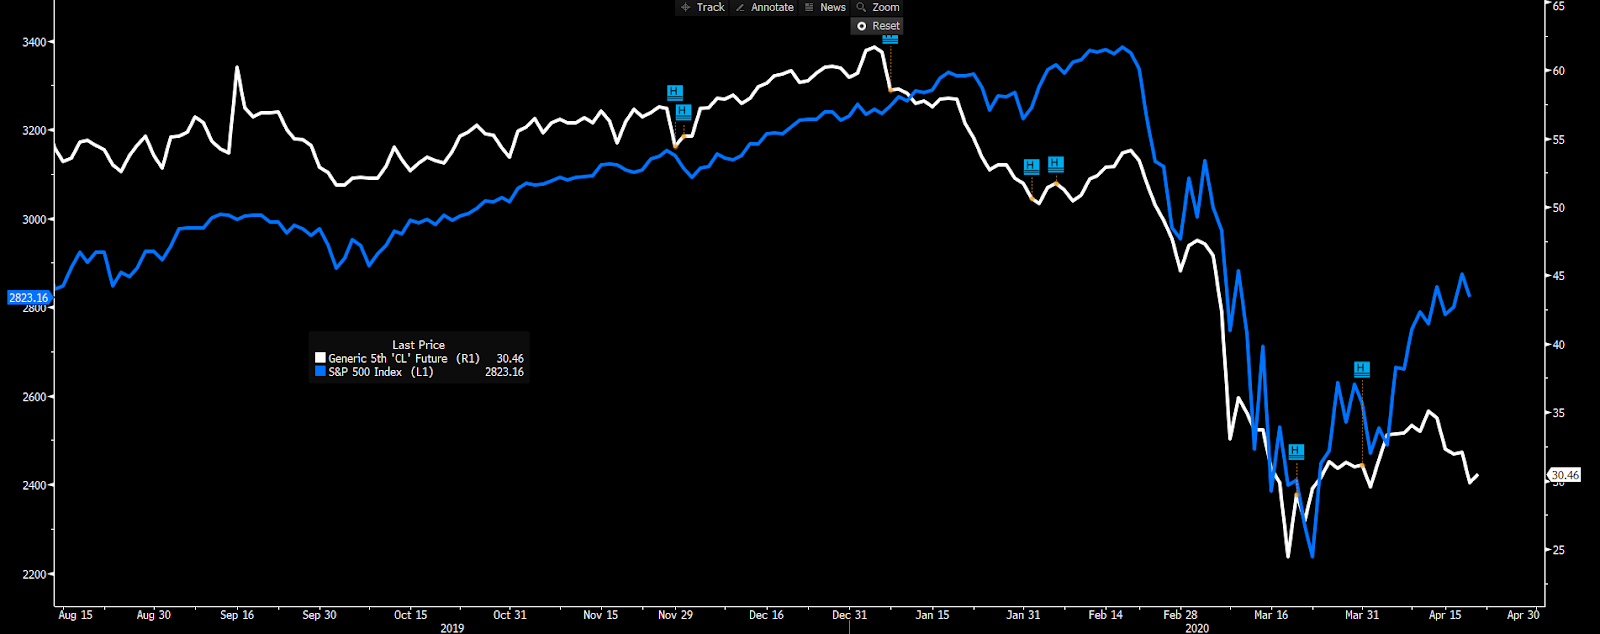
"Crude 5th month futures (white line) against the S\u0026P 500 (blue line). Over time, the S\u0026P 500 has broadly followed movements in crude price. With a large discrepancy at present, will low oil prices drag equities lower? Source: Bloomberg"
While equities rallied, crude prices never took off from the March lows, reflecting the deep demand glut caused by global lockdowns. Crude didn’t benefit from Fed measures like equities did. You can see in late January that the S&P 500 (blue line) followed crude prices (white) lower. Looking at the present discrepancy, you’re forced to ask if the oil rout will drag equity prices lower.
WTI crude futures slipped into negatives on Monday as May contracts wound up - yes, traders were paying people to take the oil off their hands as they had no one to sell oil to at contract expiry, nor anywhere to store it upon delivery.
Major US companies simply can’t balance their books below $30 a barrel. A prolonged price slump will bankrupt many producers. US banks are already preparing to step in and takeover operations.
It’s an ominous indicator that the economic consequences of the pandemic could run deeper than equity markets yet realise. The fallout in oil isn’t just accounting for a demand level last seen in 1995, but also a slow, painful recovery. The assumption so far has been that once lockdown restrictions are eased, economic activity and oil demand will quickly snap back, that’s our V-recovery. But 2020 could see oil demand wipe out a decade of growth. That’s going to hurt every corner of financial markets, and if investors haven’t priced for this, equities could draw back significantly.
What’s best for the virus, it seems, is also best for an economic recovery in the long-run. Sure strict lockdowns hurt in the short-run but if we can flatten the curve and eliminate the risk of a second wave, we’ll have a stronger economy on the other side of this.
Ready to trade?
It's quick and easy to get started. Apply in minutes with our online application process.
The material provided here has not been prepared in accordance with legal requirements designed to promote the independence of investment research and as such is considered to be a marketing communication. Whilst it is not subject to any prohibition on dealing ahead of the dissemination of investment research we will not seek to take any advantage before providing it to our clients.
Pepperstone doesn’t represent that the material provided here is accurate, current or complete, and therefore shouldn’t be relied upon as such. The information, whether from a third party or not, isn’t to be considered as a recommendation; or an offer to buy or sell; or the solicitation of an offer to buy or sell any security, financial product or instrument; or to participate in any particular trading strategy. It does not take into account readers’ financial situation or investment objectives. We advise any readers of this content to seek their own advice. Without the approval of Pepperstone, reproduction or redistribution of this information isn’t permitted.