- English (UK)
- English (UK)
Will EURUSD rally once more?
Undervalued assets?
This move has at least the makings of a decent short to medium term countertrend rally, if not a complete change in fortune. Remember it was only late March when the euro was trading above €1.14 to the greenback. Of course, much water has flowed under the bridge since then.
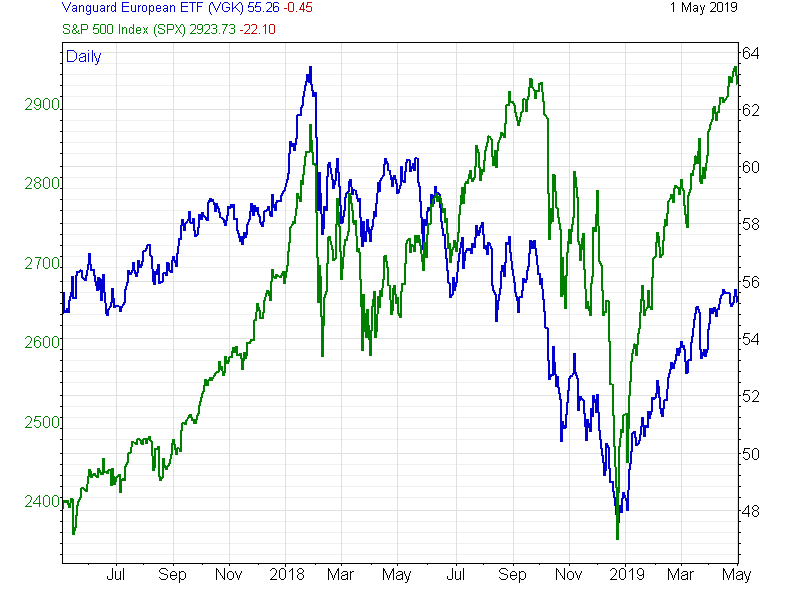
Let’s take a look at the case for the euro and European assets versus their US peers. The chart below is a prime example of the price action we have seen from the two groups over recent years. In this chart, I have used the ETF VGK as a proxy for European equities and plotted them against the broad-based US 500 index.
US outperformance
What is immediately apparent is just how much the US 500 index (green) has outperformed this diversified basket of European equities (blue) this year. We could look at numerous other charts, however, the point I am trying to make is that there’s potential for a revaluation of these underperforming assets relative to their US peers. Of course, that could manifest itself in a sharp and ongoing correction in US/dollar-based assets. For the moment that doesn't look likely.
Perhaps a more plausible turn of events would be a revaluation of European assets starting at the top and filtering down. At the pinnacle of the European asset pyramid sits the euro, whose exchange rates are a gauge of confidence in and the outlook for the single market, the eurozone, and to some extent the wider EU.
Poor macro data
The macroeconomic background for the eurozone has been poor of late. Indeed, if we look at the economic surprise index for the single currency area, compiled by HSBC, it's hard to imagine that it could look much worse. See below.
Economic surprise indices measure the positive or negative surprise contained in macroeconomic data releases versus analyst estimates. In essence, they measure the degree of 'disappointment or delight' contained in the data.
The chart below clearly shows us that the former has had the upper hand as far as the eurozone is concerned for the last year or more.
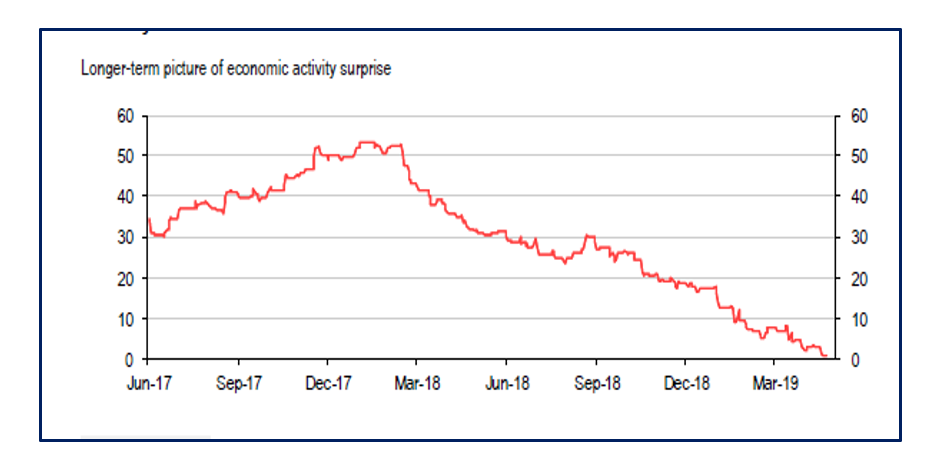
"HSBC Longterm Eurozone economic surprise index"
Underdogs can be attractive
The underperformance of Europe, the Eurozone, and the associated assets make them attractive to traders and money managers looking for oversold instruments, outliers, and opportunities for reversion to the mean.
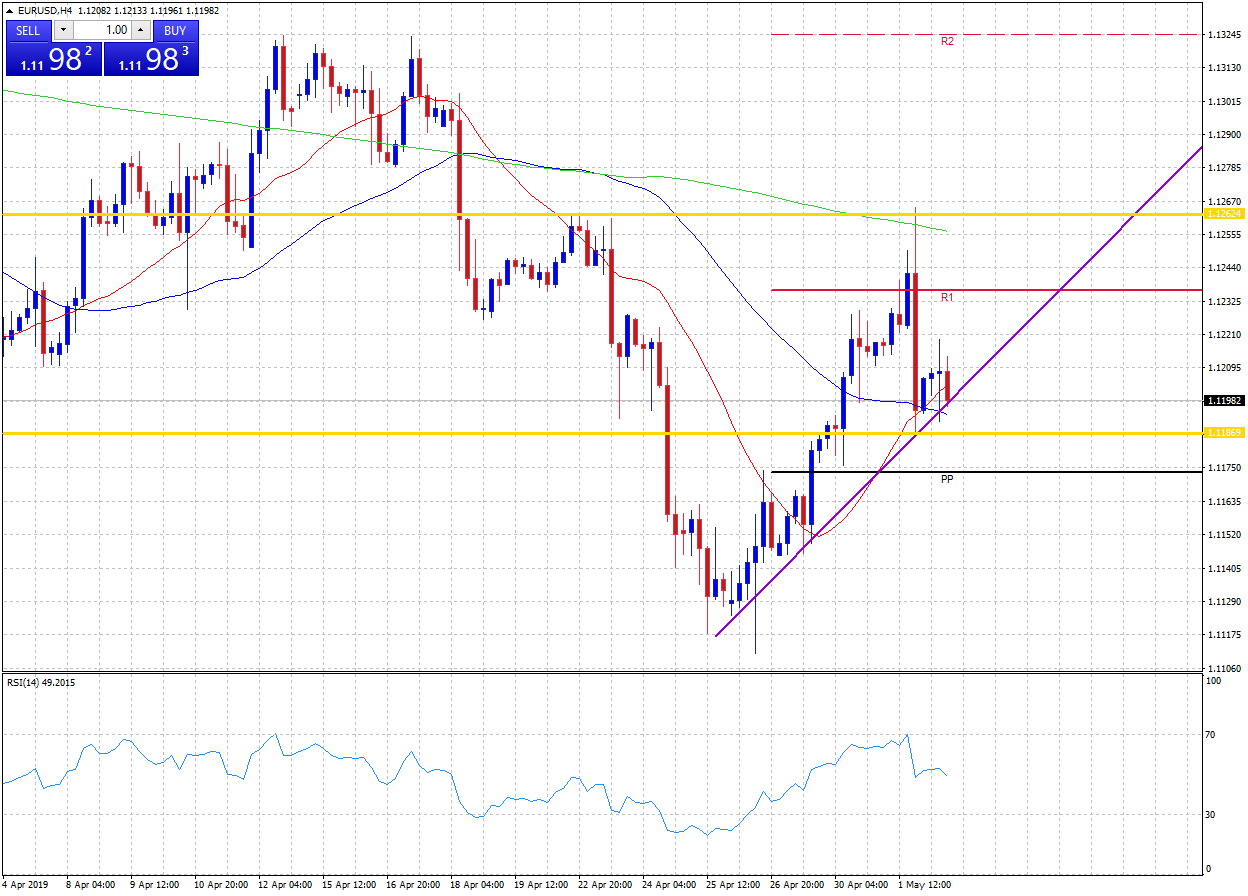
The euro rallied nicely against the USD from the 26th of April lows of €1.1111 before peaking at 1.126480 on the 1st of May. From here, it sold off sharply. You’ll see below that despite the sharp pullback, EURUSD did not break its near-term uptrend shown by the purple line on the chart (at the time of writing). This suggests to me that the upside bias may remain in place and that we may not have seen the last of this rally.
Short term retracement
As I write, the uptrend line comes in around €1.1197, backed up by horizontal support at €1.1187 and €1.1166. My thoughts are that as long as we don't see EURUSD make a sustained move below these levels then there are still opportunities on the upside. Even if we do push through those levels, €1.1157 would be an interesting area to consider getting long, as would €1.1145.
We often say that trying to pick a top or bottom in a trend or countertrend retracement is a sure-fire way to find yourself on the wrong side of the trade and lose money.
One way to avoid that is to read the price action and note how the price reacts at critical levels. In this case, the supports outlined above. Under this kind of countertrend retracement, we are looking for the point at which that short-term move runs out of momentum and reverses to reinstate the prior trend. If that doesn't happen, the retracement becomes the new dominant trend.
What to look out for
The chart above is drawn over an H4 timescale but there is nothing to stop you drawing something similar, over 60-minutes or shorter, and tracking how the price reacts at the levels we have outlined above. In this instance, we would want to see that the supports hold firm when tested and that subsequent candles contain a higher high and a higher lower than those that came before.
If we see that type of price action, then there could well be an opportunity to play eurodollar on the upside once more. €1.1157 is an area to use as a stoploss if you do go long. Although if that’s your entry point, consider using the area around €1.1144, however that will only come into play if €1.1157 holds firm. Upside levels to aim at are the supports and recent highs, which we have outlined above.
Ready to trade?
It's quick and easy to get started. Apply in minutes with our online application process.
The material provided here has not been prepared in accordance with legal requirements designed to promote the independence of investment research and as such is considered to be a marketing communication. Whilst it is not subject to any prohibition on dealing ahead of the dissemination of investment research we will not seek to take any advantage before providing it to our clients.
Pepperstone doesn’t represent that the material provided here is accurate, current or complete, and therefore shouldn’t be relied upon as such. The information, whether from a third party or not, isn’t to be considered as a recommendation; or an offer to buy or sell; or the solicitation of an offer to buy or sell any security, financial product or instrument; or to participate in any particular trading strategy. It does not take into account readers’ financial situation or investment objectives. We advise any readers of this content to seek their own advice. Without the approval of Pepperstone, reproduction or redistribution of this information isn’t permitted.